

Just like I wrote last time we have been correcting and looks like we will continue to do so at the short / medium term future.

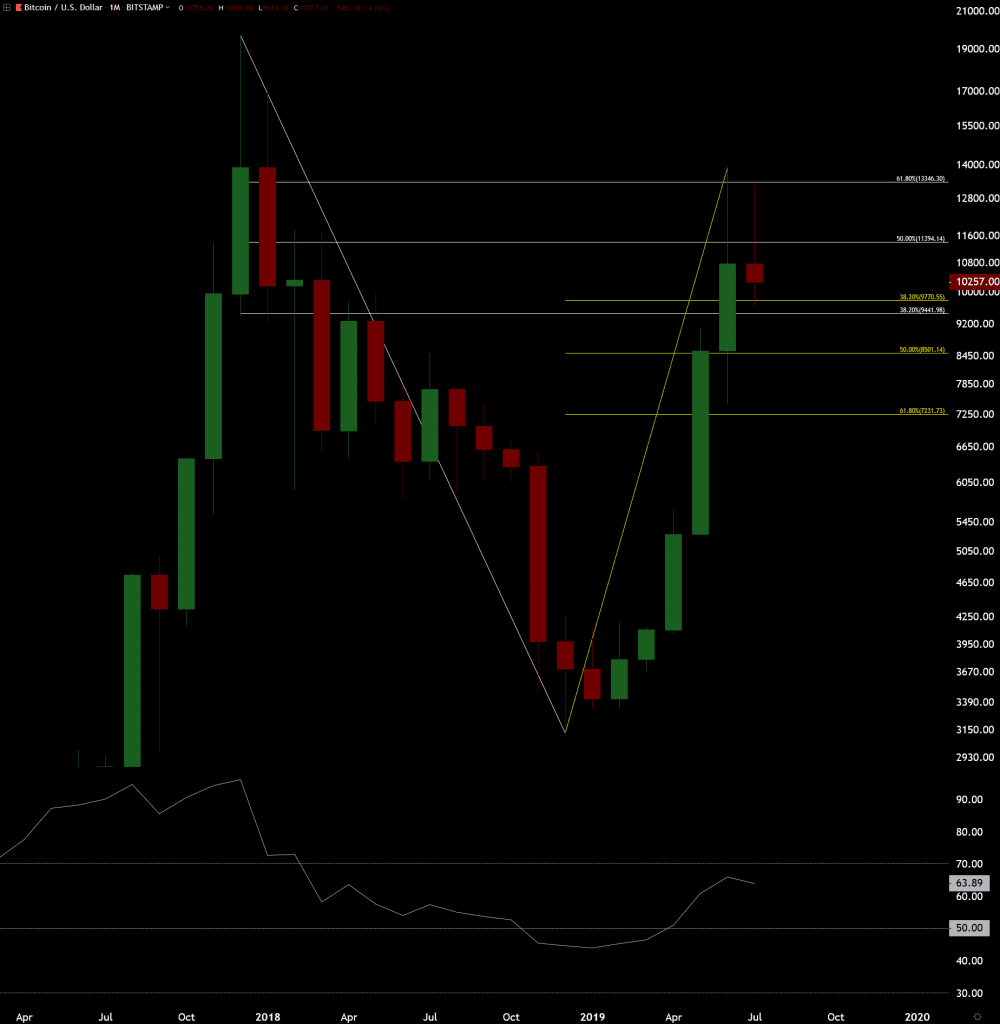
Current monthly candle is red with a big up wick. Previous green top candle had also a big up wick at the top. Wicks reach about the level of the whole bear market 62% fibonacci retrace. RSI (relative strength index) looks to be turning down from 70. RSI was actually 70 when price was 13880 dollars at the top few weeks back.
These wicks, if this months candle closes anything like this, are signs of rejection from the important bear market 62% fibonacci retrace level and from the probably important 70 RSI level.
If we close the monthly candle red like this it could very well mean correction for months and possibly for the rest of the year. This could mean we have to wait until 2020 before any new highs in price. But price movements are always more important than time.
Green top candles open is at about the same level with the yellow 50% fibonacci retrace of this rise from the bear market bottom. This is the obvious magnet for the price at the moment. Even if we reach this price fast we probably won’t go much lower during the whole correction.
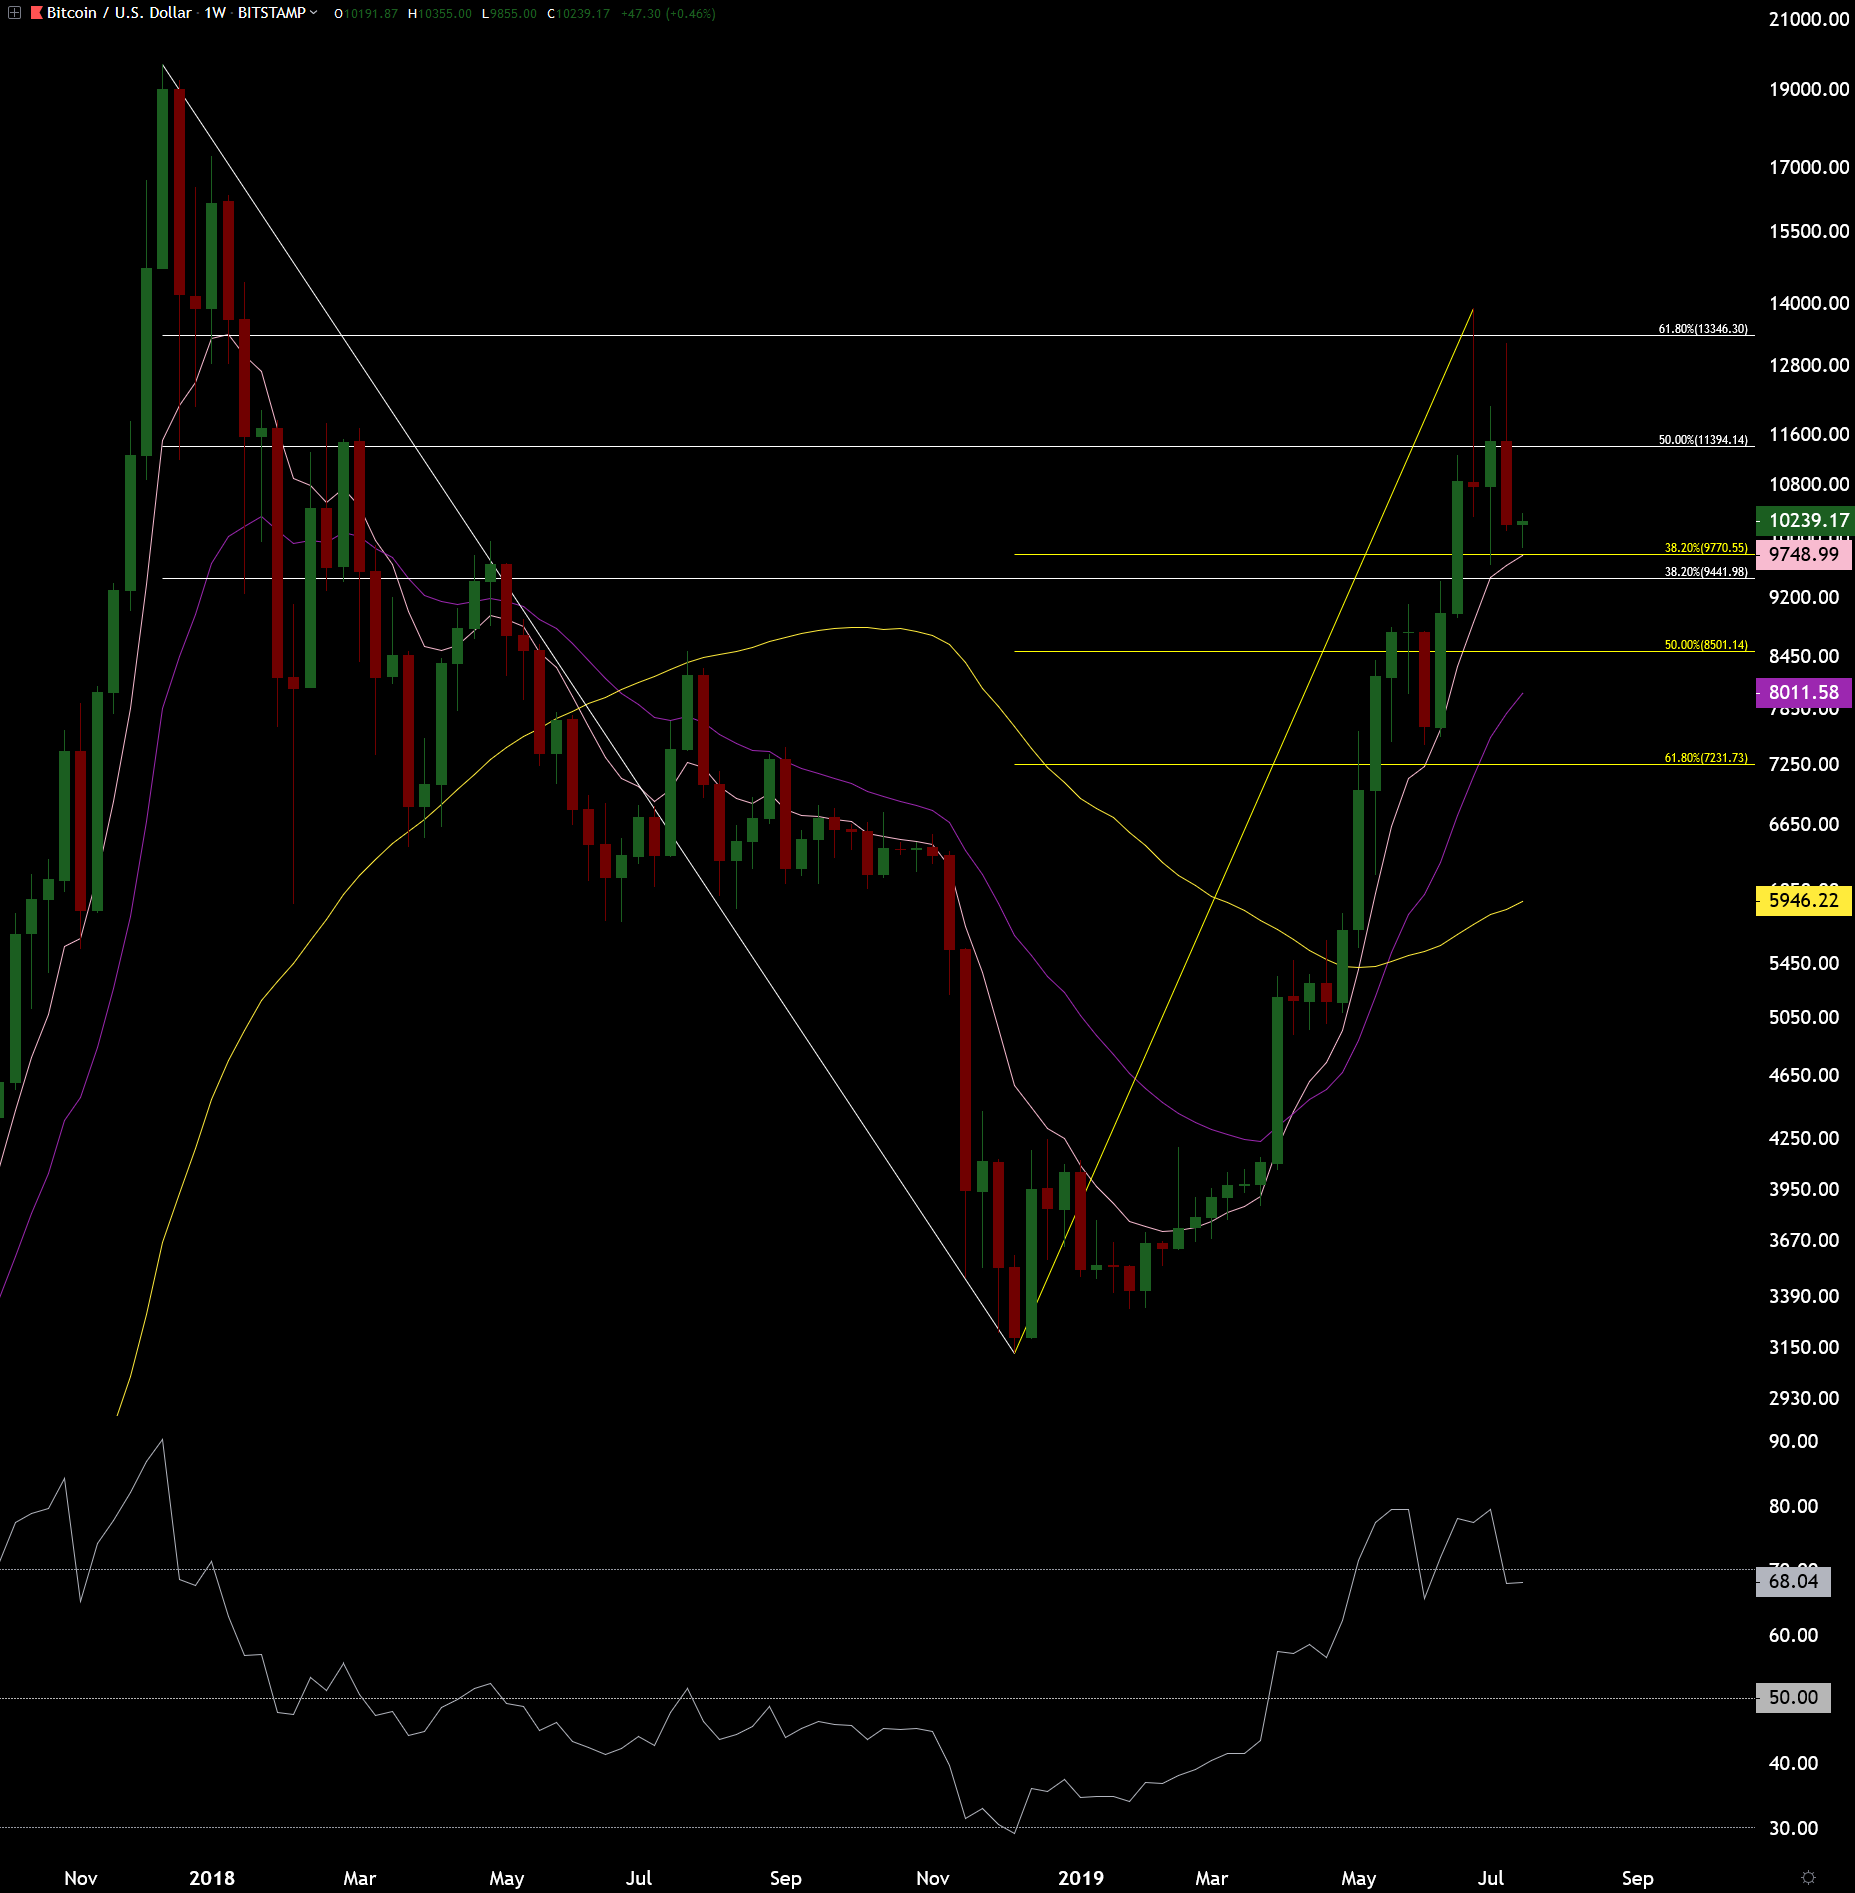
On weekly chart we closed the candle as red engulfing with big up wick. First we had shooting star from the 62% bear market fibonacci (that I wrote on previous analysis) and then green bounce candle and now red candle that has bigger body than that green bounce candle making it engulfing.
Rejection wicks from the 62% fibonacci level are shown well on weekly chart too. RSI went back below 70. During the previous bull market during corrections weekly RSI went pretty close to 50 level, at least below 55. That is something to pay attention to also.
On previous bull market the correction almost always ended up hitting the purple EMA (exponential moving average) from 20 weeks, just once it only hit the pink EMA from 8 weeks, this time is shown in the chart on left corner.
With these rejection wicks from the bear market 62% fibonacci and with this monthly and weekly RSI action, I do not think that the pink weekly EMA8 is able to stop this going down more. Purple EMA20 happens to be close to the yellow 50% fibonacci and will be little bit higher again next week.
Longer term bull trend seems to be strong and this current move looks to be only a correction. The move from the bear market bottom has been amazing and the market just needs some time to cool off before pushing to new highs.