

The TA of week 28 analyses the recent bullish price action and fresh risk-on sentiment. Additionally, we’ll explore the status of DXY and how different on-chain indicators point towards a bottoming market.
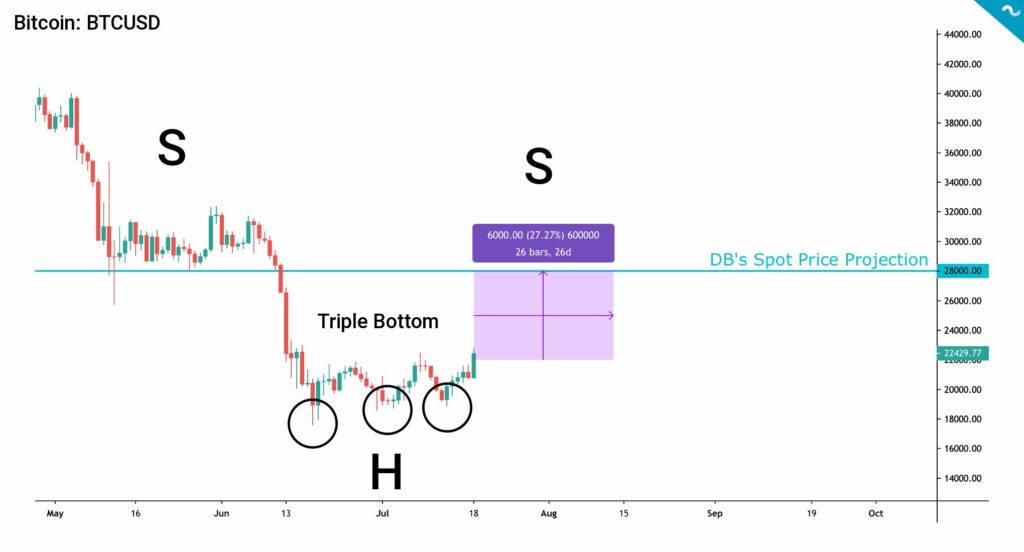
Bitcoin Approaches Deutsche Banks’s $28K Target
The leading cryptocurrencies Bitcoin and Ethereum had a massive week, as the former climbed 15,9 percent and the latter over 42%. Deutsche Bank published its spot price target of $28K two weeks ago, estimating bitcoin to follow the S&P in close correlation. Bitcoin has recently hit a triple bottom pattern in the $18-20K range, bouncing on the 2017 cycle peak support. Bitcoin has also formed an inverse head and shoulders pattern, which includes the left shoulder (S) in May-June, the head (H) with technical triple bottom in June-July, and the right shoulder (S) in July-August.
Bitcoin has truly gained new organic upward momentum, not seen since the late 2021 bull rally. Bitcoin’s rally is supported by multiple factors, including Ethereum’s ongoing merge rally, the US dollar’s potential weakening, and peaking inflation. Some analysts are also saying that a truce between Ukraine and Russia would be possible, lowering the geopolitical risk environment. As a high beta asset, Bitcoin was the first to fall in 2021, alongside the technology stocks. While Bitcoin was the first “risk-off” asset, it’s now being bought again as a “risk-on” asset, respectively.
Ethereum is leading the updraft of risk-on assets, accompanied by other decentralized finance related assets like Aave (+40%) and Uniswap (+33,8%). Ethereum has been strengthening significantly against bitcoin as ETH/BTC pair has increased from 0,054 to 0,07 within a week. Now that investors are seemingly willing to take more risk again, the more speculative tokens are viewed as having even higher beta than the leading cryptocurrency bitcoin.
7-Day Price Performance
Bitcoin (BTC): +15,9%
Ethereum (ETH): +42,8%
Litecoin (LTC): +19,6%
Aave (AAVE): +40%
Chainlink (LINK): +19,4%
Uniswap (UNI): +33,8%
Stellar (XLM): +16%
XRP: +17,5%
– – – – – – – – – –
S&P 500 Index: +2,86%
Gold: -1,44%
– – – – – – – – – –
Bitcoin’s 90-Day Pearson Correlation with S&P 500 Index: 0,64
Bitcoin RSI: 59
– – – – – – – – – –
Important Dates
26-27.7: FOMC Meeting
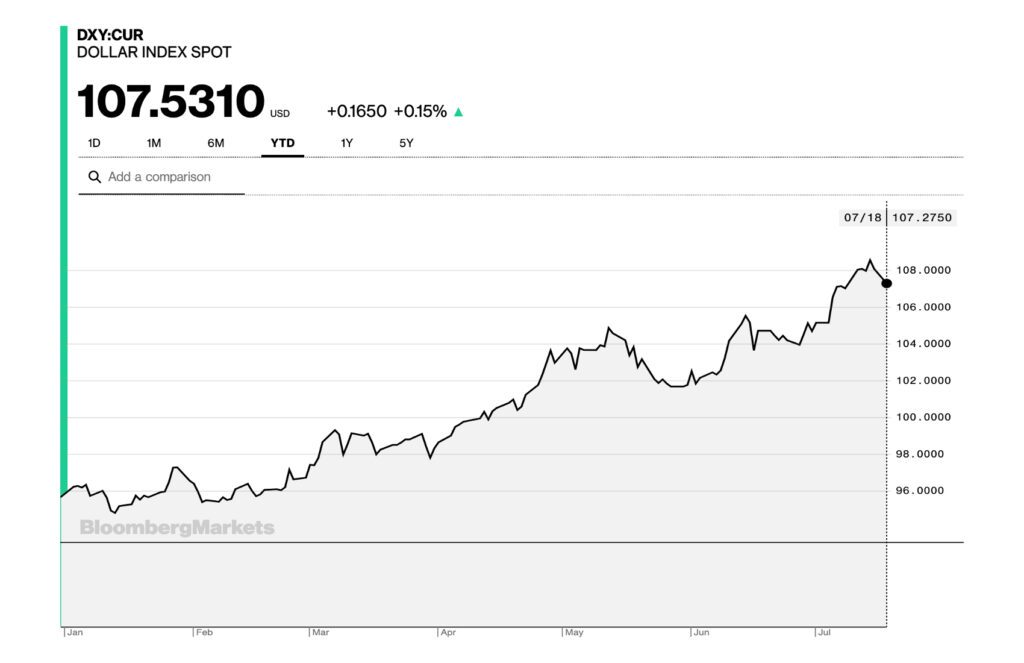
Another factor heavily contributing to the bullish environment is the US dollar, which seems to be rolling over. The dollar index DXY has been strengthening 11,38 percent this year and might be reaching the end of its cycle. The pivoting DXY would generate huge shifts across markets, including equity, raw materials, and digital assets. By default, the weak DXY has given bitcoin and cryptoassets some room to grow, while strong DXY has acted as a black hole of value. Markets are also waiting for the FOMC meeting next week, in which the Fed might even raise rates by 100 basis-points. The FOMC will be held on July 26th and 27th.
On-Chain Data Indicates a Bottoming Market
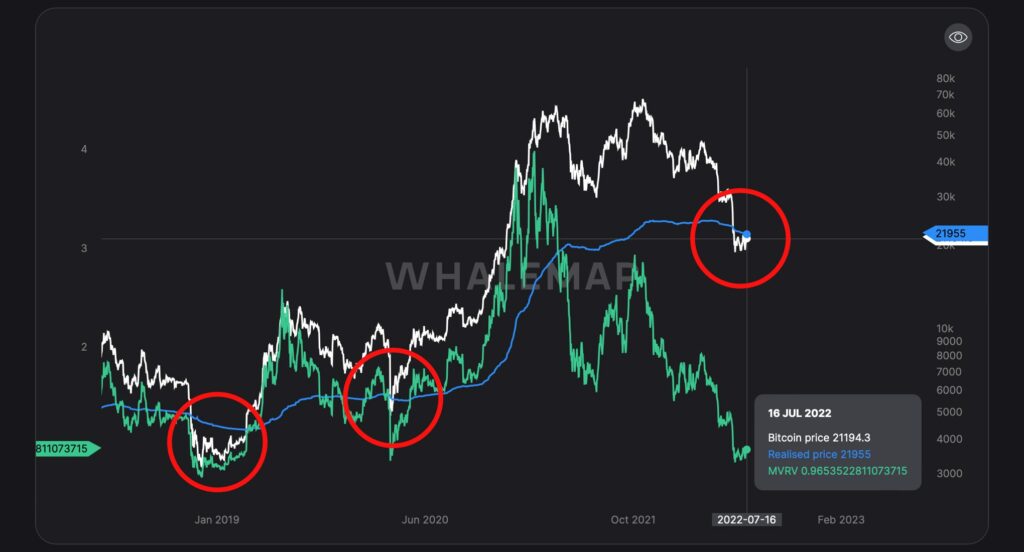
The data collected by the Whalemap shows how the spot price of bitcoin has fallen below the realized price (blue) for the fifth time in the history of the leading cryptocurrency. The last time the spot fell below the realized price was during the spring 2020 COVID crash, after which the bitcoin quickly recovered. Whalemap’s chart also shows how Bitcoin’s MVRV indicator has remained below 1 for a month, indicating oversold bitcoin. Below one MVRV recommends a gradual long position.
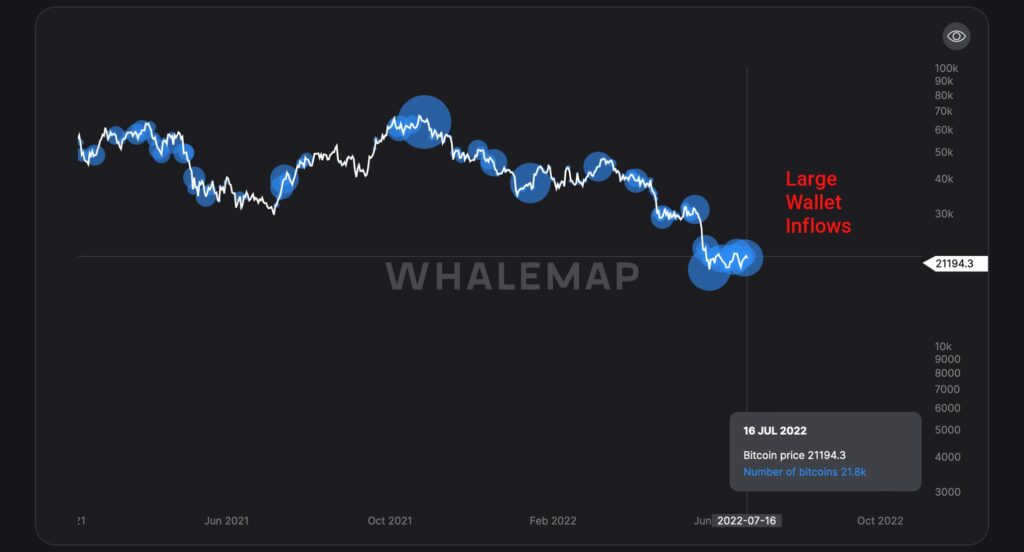
Whalemap’s data also shows how the amount of large wallet inflows is rapidly increasing, setting up a scene for a relief rally.
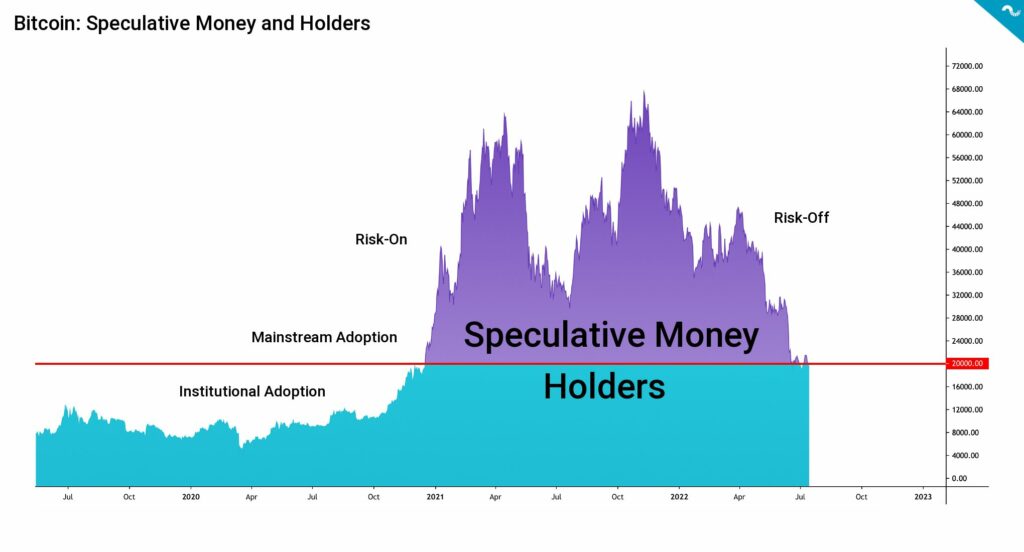
The Current Market Structure Favors Holders
While Bitcoin’s year 2022 has been brutal in terms of price action and the asset is -50,8% year to date, the correction can be seen as a mandatory “purge” of excess speculative money. As the following chart shows, speculative money started to enter the market in early 2021, wildly pushing the spot price up. The speculative money also significantly increased the amount of leverage in markets. Over longer time spans the excess leverage starts to act as a speculative ballast to spot price and it needs to be “flushed out” on a timely basis.
As the embedded chart shows, under $20K valuations are skewed towards long-term holders, or “holders of last resort”. Now with the fresh risk-on sentiment, we’ll see speculative money enter the markets again. Like Mark Twain famously said: “History never repeats itself, but it does often rhymes.”
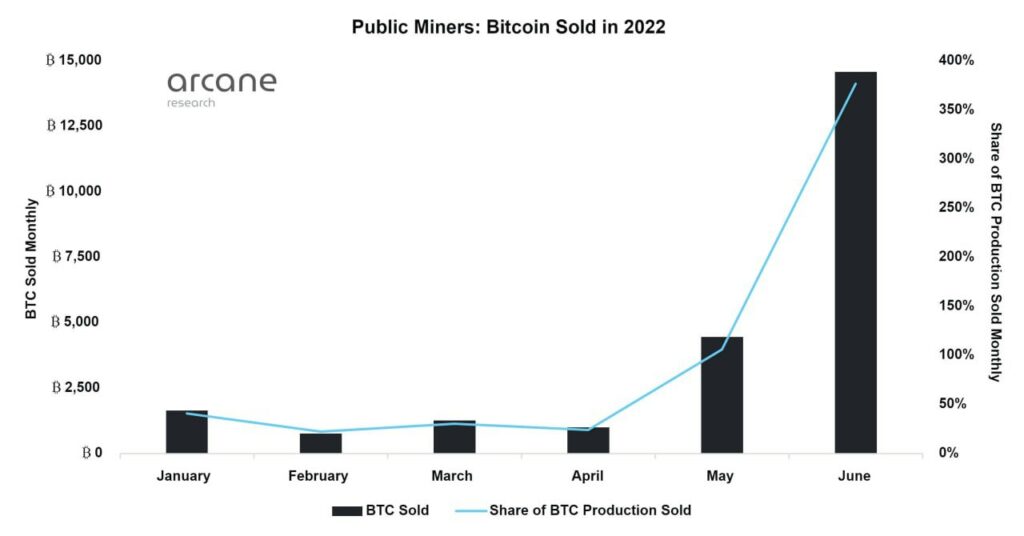
Miner Capitulation
Another factor pointing towards a bottoming market is the escalating miner capitulation. Norwegian Arcane Research has estimated that Bitcoin miners sold a total of 14 600 bitcoin units in June, a 400 percent increase from May. According to Arcane Research’s report, the public miners have produced 3900 Bitcoins this month, meaning they have sold over 400% of their supply.
Bitcoin’s Puell Multiple indicator has dropped to a value of 0,55, indicating a heavy buy zone. The indicator has been below 0,6 only four times before in Bitcoin’s history. Puell Multiple is an essential indicator that focuses on Bitcoin’s supply and mirrors the profitability of PoW mining. As we know, miners need to sell native bitcoin units in order to keep their operation running, Puell Multiple revolves around the mining revenue generation.
The Puell Multiple (PM) is calculated by dividing the daily issued bitcoins (in USD) by the 365D daily unit issuance moving average (MA). This gives us an indicator we’re usually benchmarking against bitcoin spot price BTCUSD. In summary, the Puell Multiple pulls mining data and compares mining profitability now (per day) against over the whole year (365 MA). The Puell Multiple can be used to form buy and sell zones in the following manner:
Buy Zone: Puell Multiple Between 0 and 0,5
Sell Zone: Puell Multiple Between 4 and 10
What Are We Following Right Now?
The stock market is recovering and it will pull higher beta assets, like Bitcoin, up in its wake.
How landfill methane can be used to power Bitcoin mining, turning waste into an asset, reducing greenhouse emissions, and building decentralised baseload energy facilities?

Euro suddenly breaking higher against the US dollar. Is the dollar wrecking ball season over?
Stay in the loop with our newsletter:

The views, thoughts, and opinions expressed in the text belong to the author and not necessarily to the author’s employer, organization, committee, or other group or individual.