


Yes the correction has been continuing like I’ve been predicting based on these simple charts. Just a few lines in a chart is all we need, if we have the correct lines. Was this the bottom of the correction? Most likely no, let’s see what I mean and what needs to happen for me to change my mind.
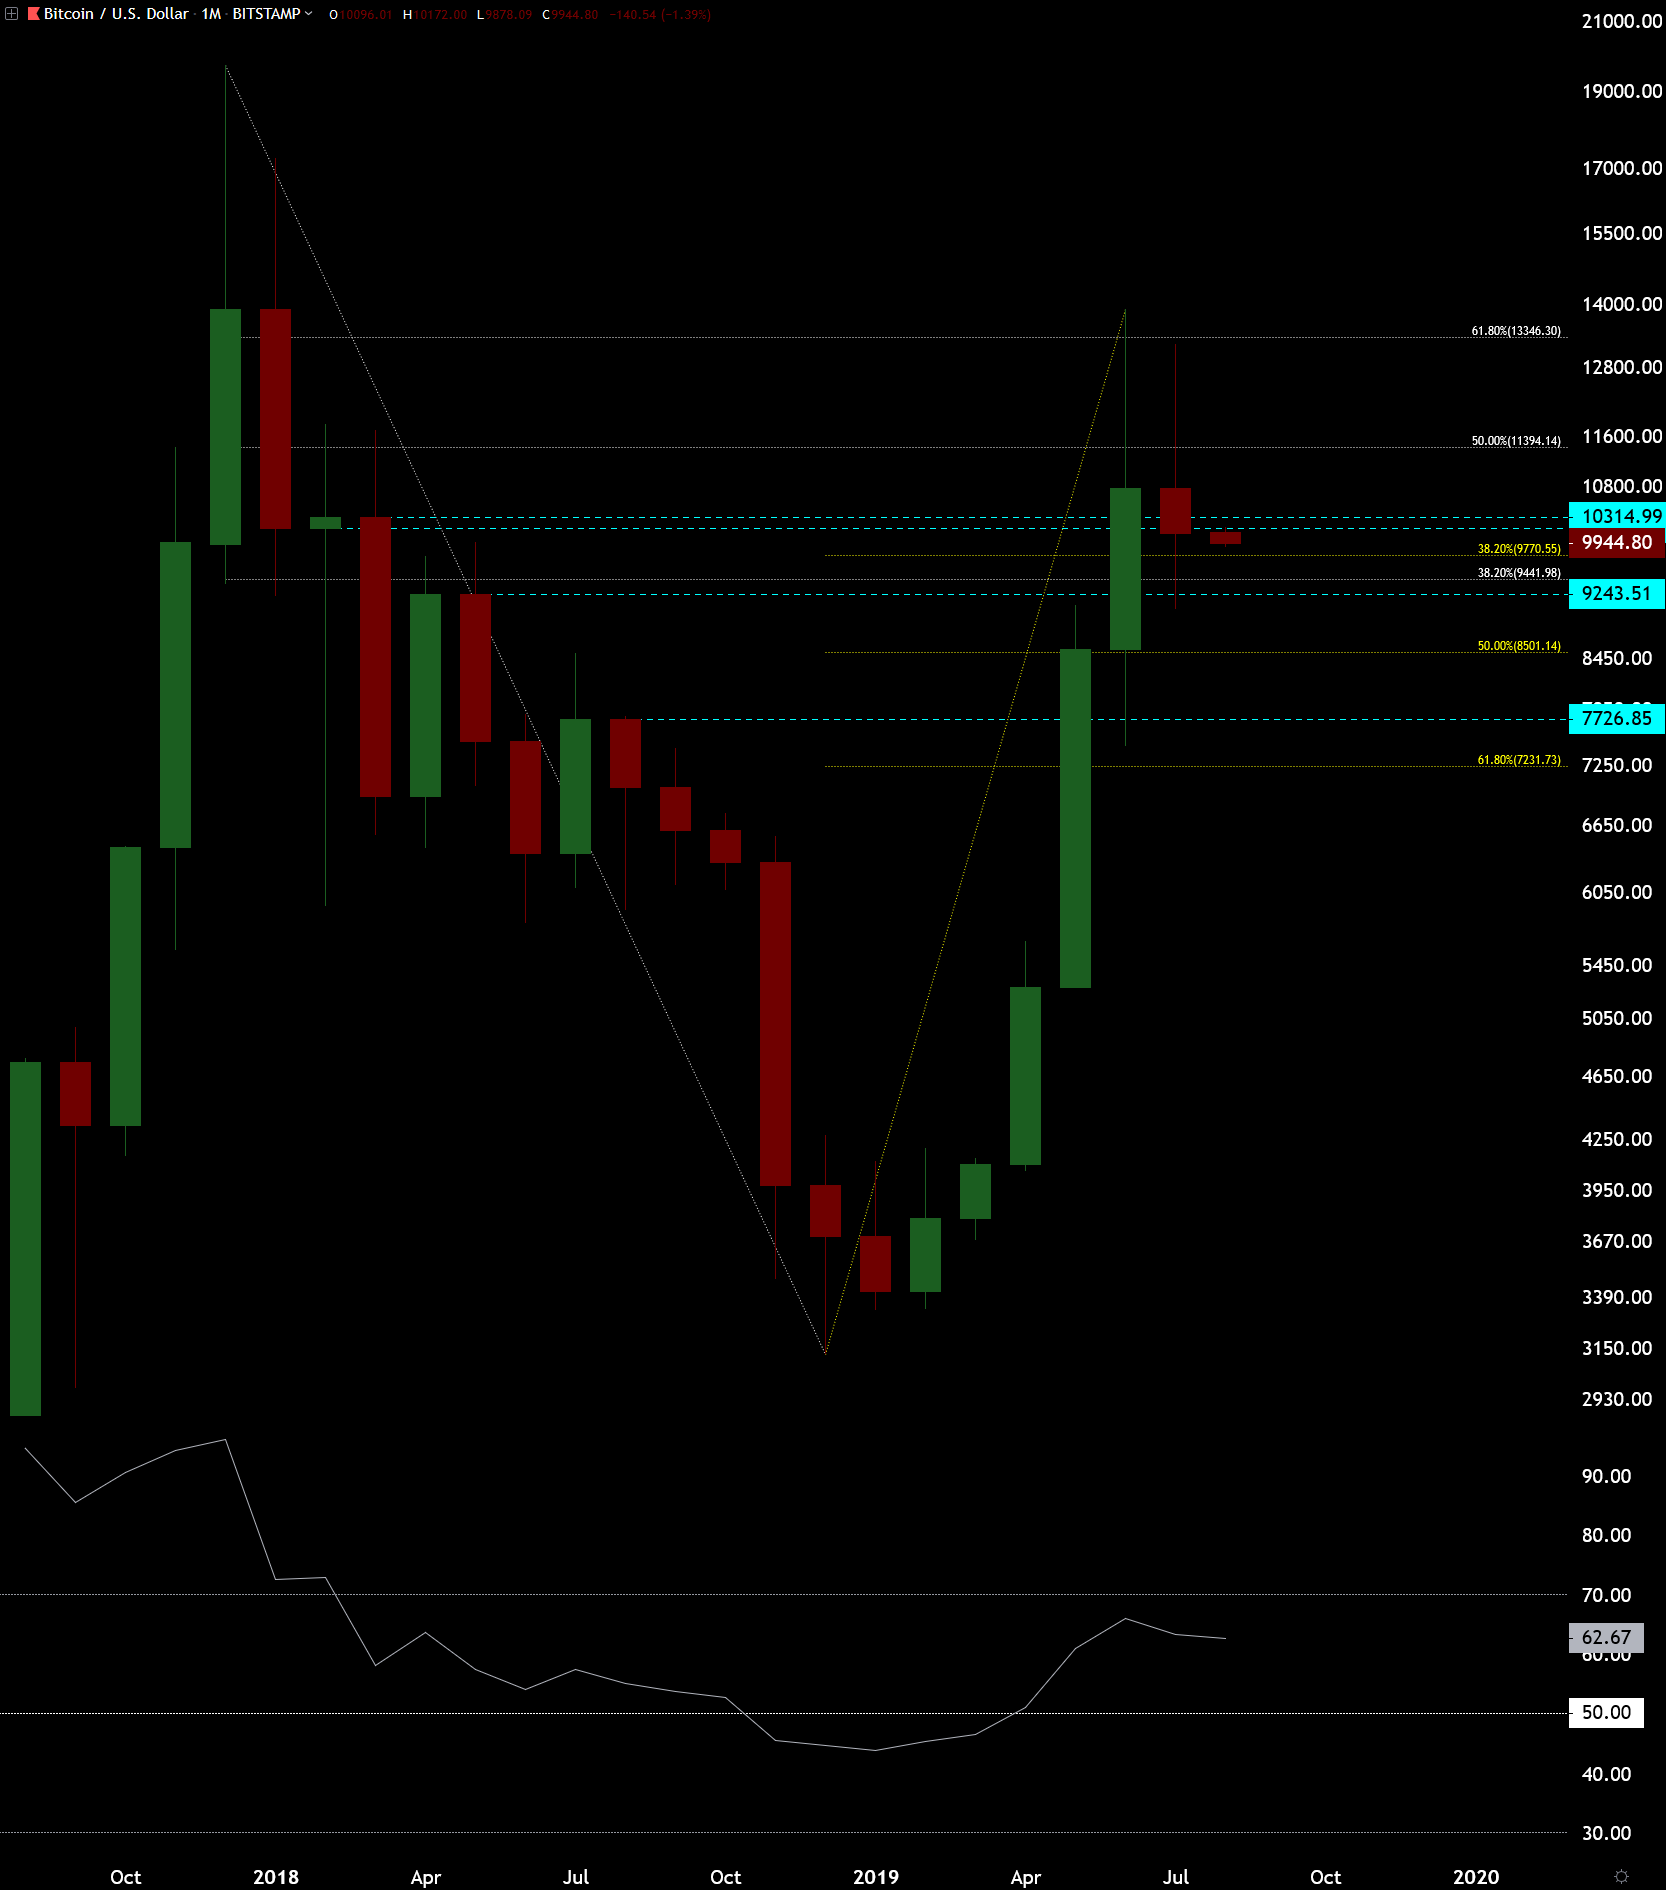
Monthly candle closed red with a big up wick. The green top candle has a big up wick as well. Wicks reach the white 62% fibonacci bear market retrace. RSI (relative strength index) at the bottom of the chart, turned down.
There are also few important monthly opens drawn on the chart with teal color. Monthly closed below the S/R (support/resistance) area formed by two of these monthly opens right above us.
These wicks are signs of rejection from the bear market 62% fibonacci level. The red monthly close here is a confirmation of this rejection on a monthly scale. Red close turns the RSI down also which is another confirmation, especially when the RSI hit 70 level at the 13880 top.
Recap:
- 2 big up wicks on top hitting 62% bear market fibonacci
- Red candle close below S/R area
- RSI turned down from 70
These events open the possibility for a longer correction. If this months candle is green engulfing, meaning the close of this month would be higher than the last months open then that will turn the picture bullish, but now correction continuation seems to be the most likely outcome.
The yellow 50% fibonacci level is the obvious target, especially since the green top candles open is almost at the same price level at 8500 dollars. Decent panic sell-off would take the price for a short time to 7726 dollars or even to the yellow 62% fibonacci at 7231 dollars, but these are more riskier targets in my opinion.
Now, if we want to look for faster signals for this to turn bullish again we have to look at the weekly chart.
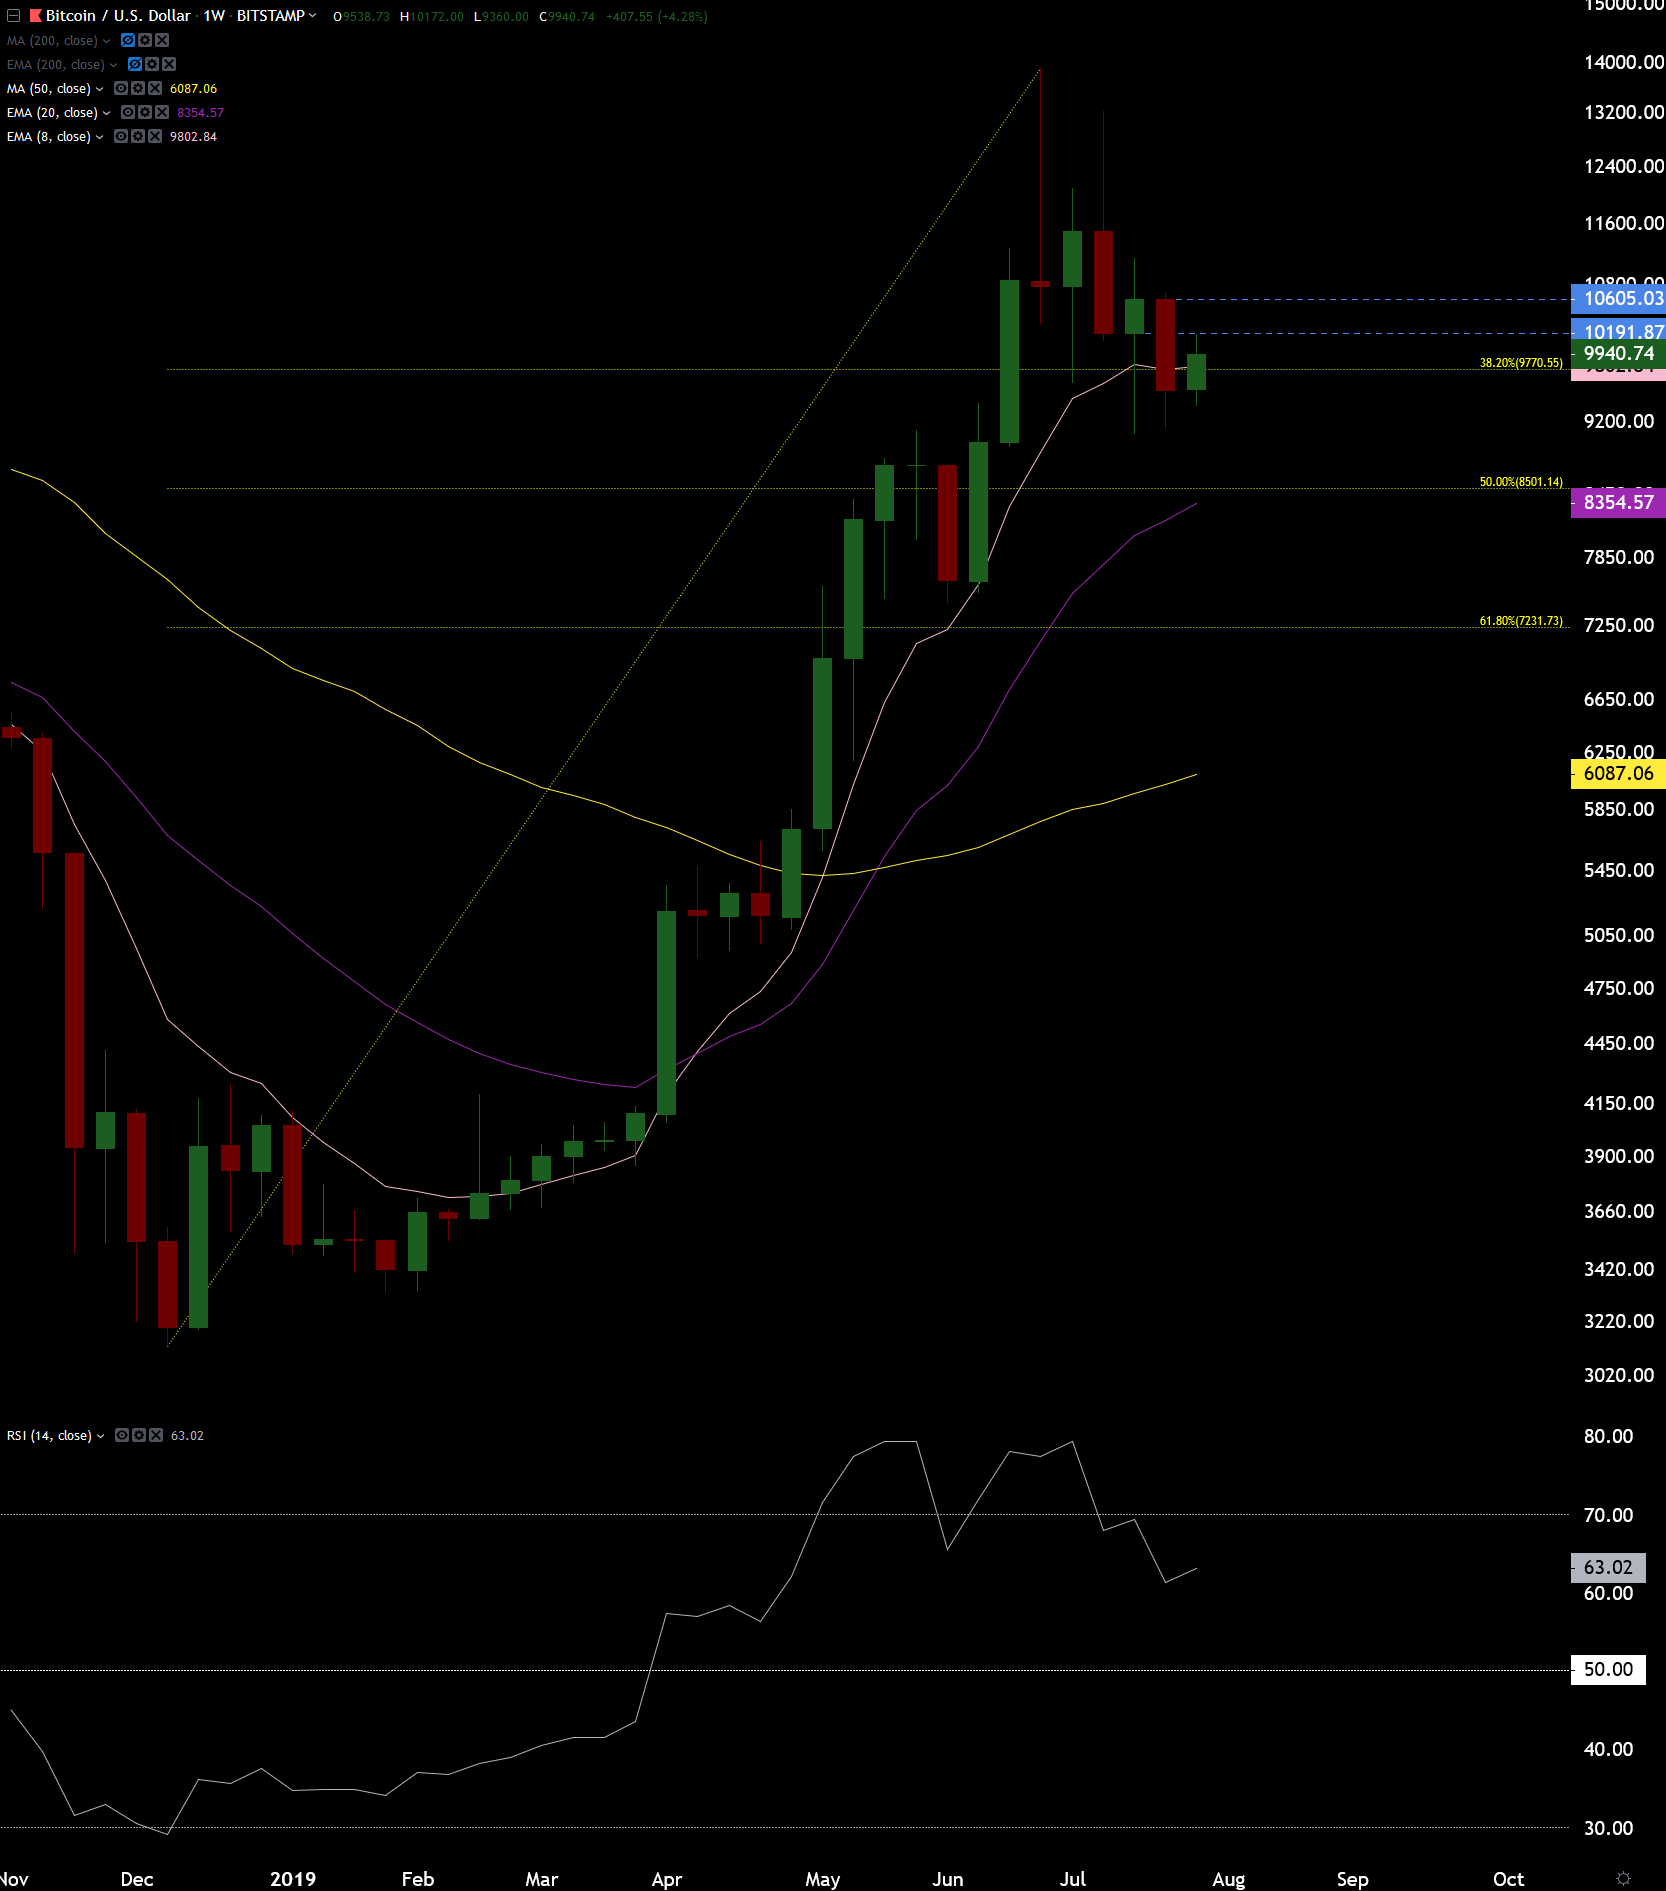
In the weekly chart the previous candle closed as red engulfing as the close is below the previous green ones open. RSI turned down from 70 level. Red candle also closed below the pink EMA (exponential moving average) from 8 weeks.
Now we have short-term resistance above us drawn with blue lines (lines are drawn from weekly opens). For this to turn bullish on weekly chart we would need green engulfing, close over the blue line at 10605 dollars. Any other kind of close and I would think that the correction continuation is the most likely route.
Purple EMA from 20 weeks is almost at the same level with the yellow 50% fibonacci and next week probably very close to it. This target lines up well with the monthly chart.
The bigger trend is up, from the 3122 dollar bear market bottom. If we would have gotten red engulfing candle on monthly now then I would be worried but now everything looks good for this to be the new bull market for bitcoin market.