


We got a new monthly candle open yesterday. Let’s start from it and then work our way to shorter time frames.
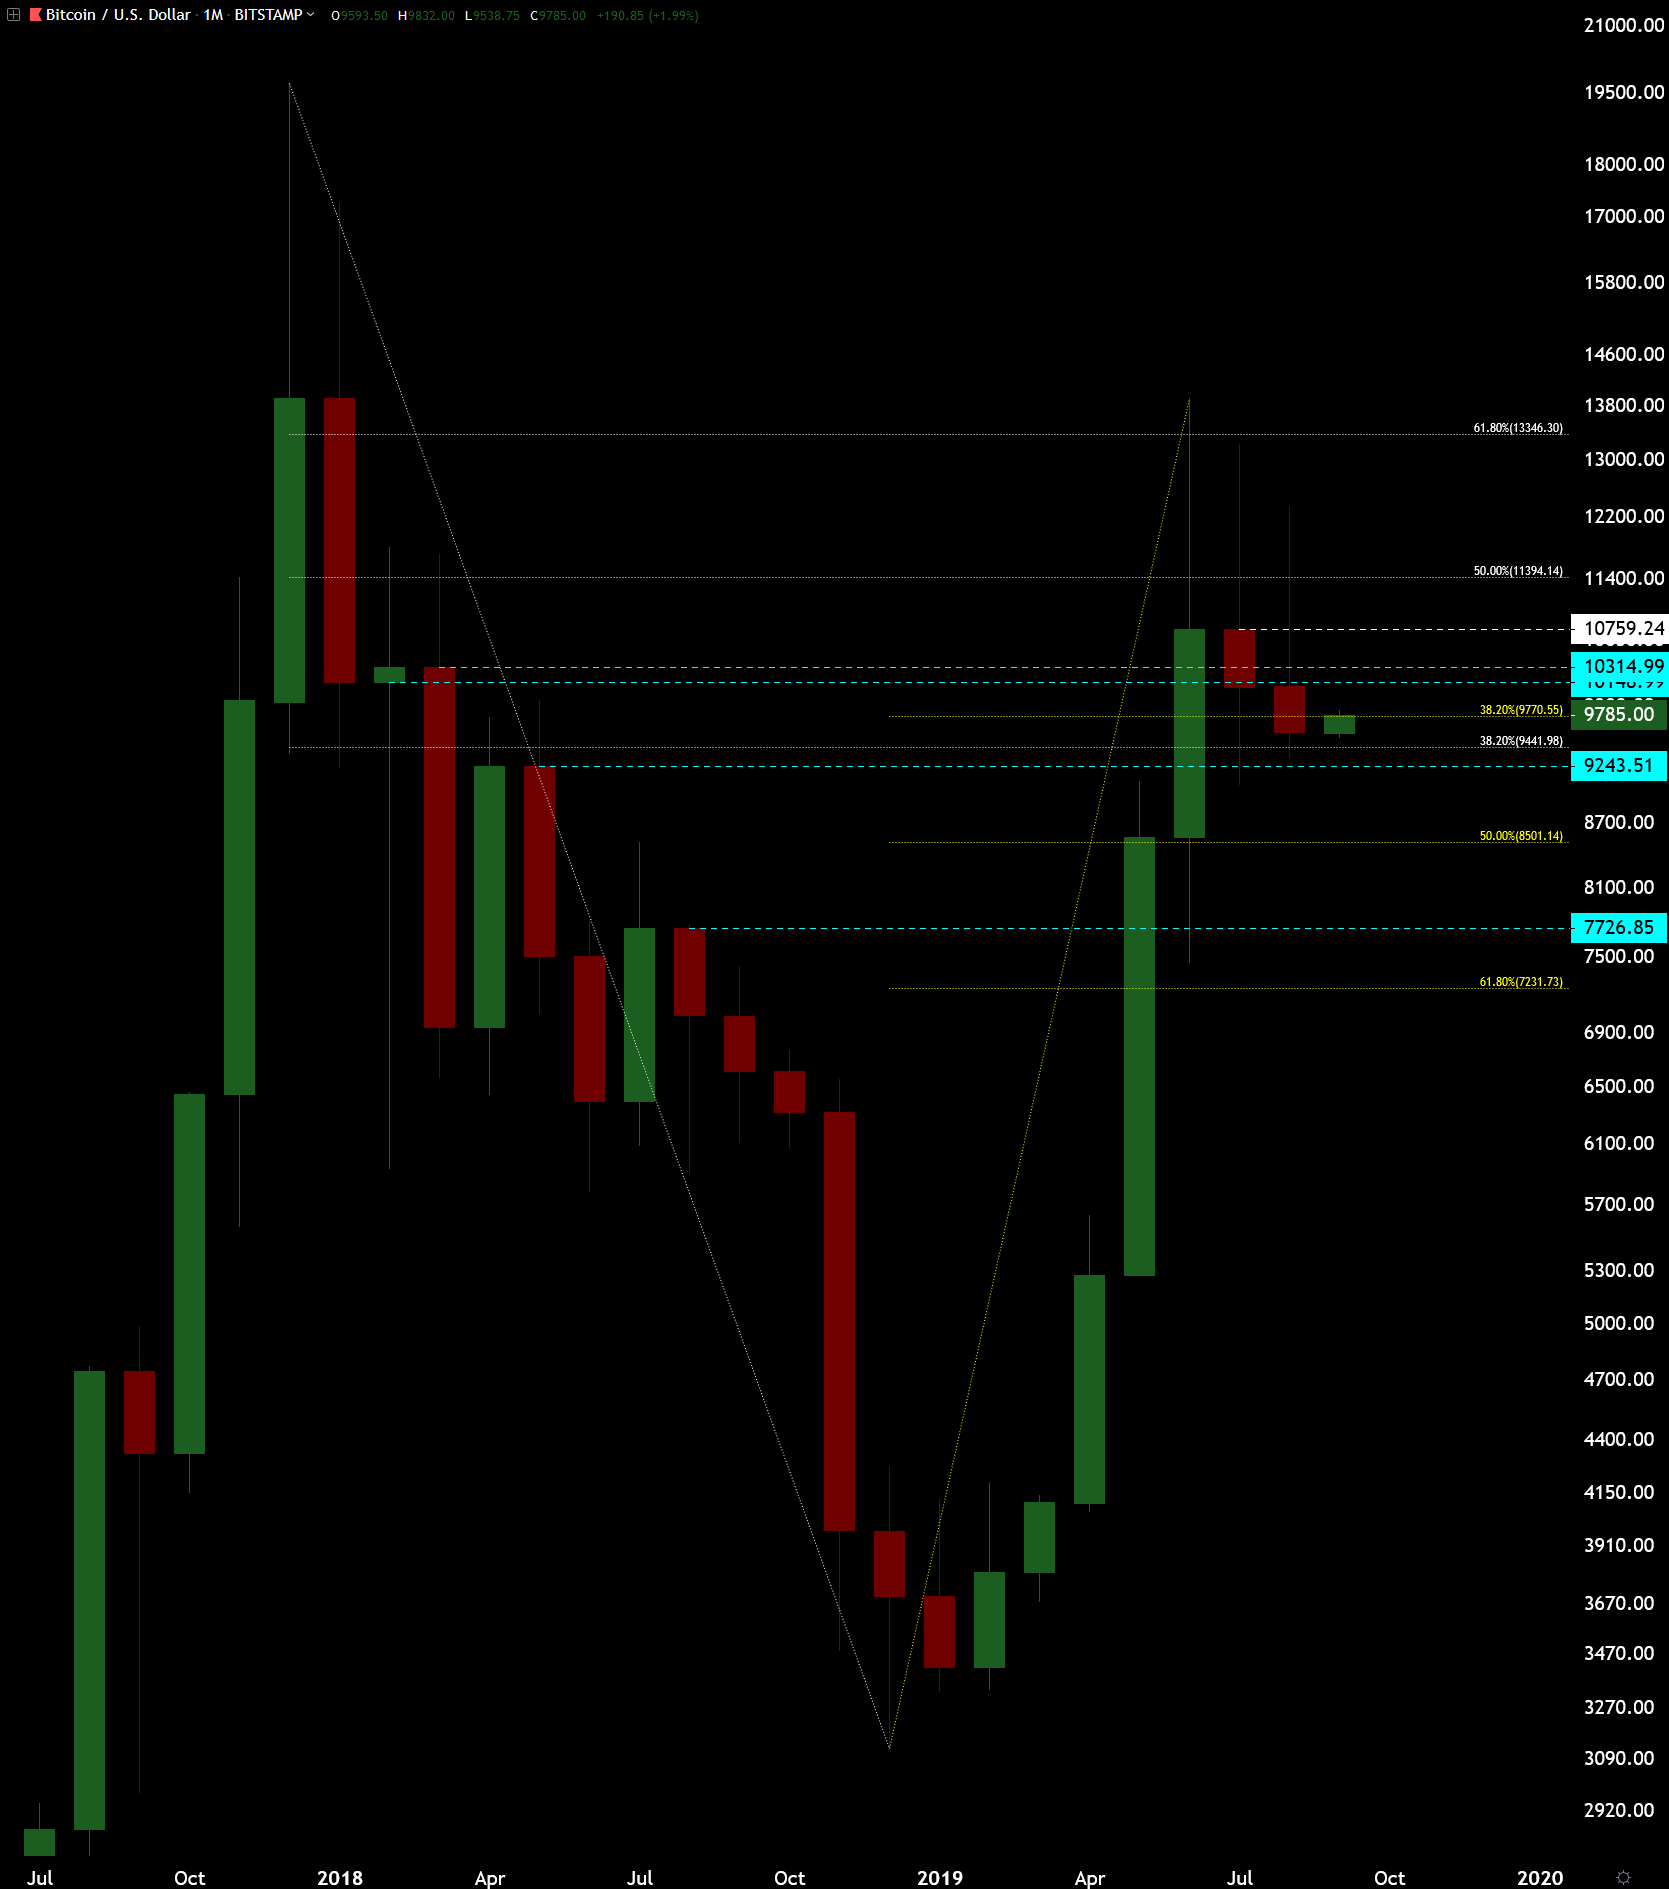
On previous analysis I wrote that I would like to see a close/open above the monthly open marked by the white line on the chart to turn the monthly chart bullish. This did not happen. By bullish I mean that the trend up could continue.
The red candle bodies are way smaller than the green ones leading to the top so it does look like a correction rather than a bull market killer. Top wicks are big though and these top wicks are the main reason why I think that the continuation of the correction is more likely than to go up straight from here.
Some of you may wonder how monthly wicks can possibly mean so much. Let me explain a bit about the reasoning behind this. I think that enough of the money in the bitcoin market follow these monthly charts, pay attention to these kind of wicks and most importantly sell bitcoins, if they see these.
But these wicks are not the only thing here to pay attention to.

First we try to find a good S/R (support/resistance), then we follow how price acts in relation to it. We have as S/R the 62% fibonacci retracement from the whole bear market here on the chart. The price moved fast from the $3k bottom to the resistance and then we had a clear reaction from the resistance.
The faster and bigger the movement in relation to the S/R is the more chance there is for the S/R to stop the movement (at least for a bit). Now we are seeing fast movement to the S/R and clear reaction from the S/R.
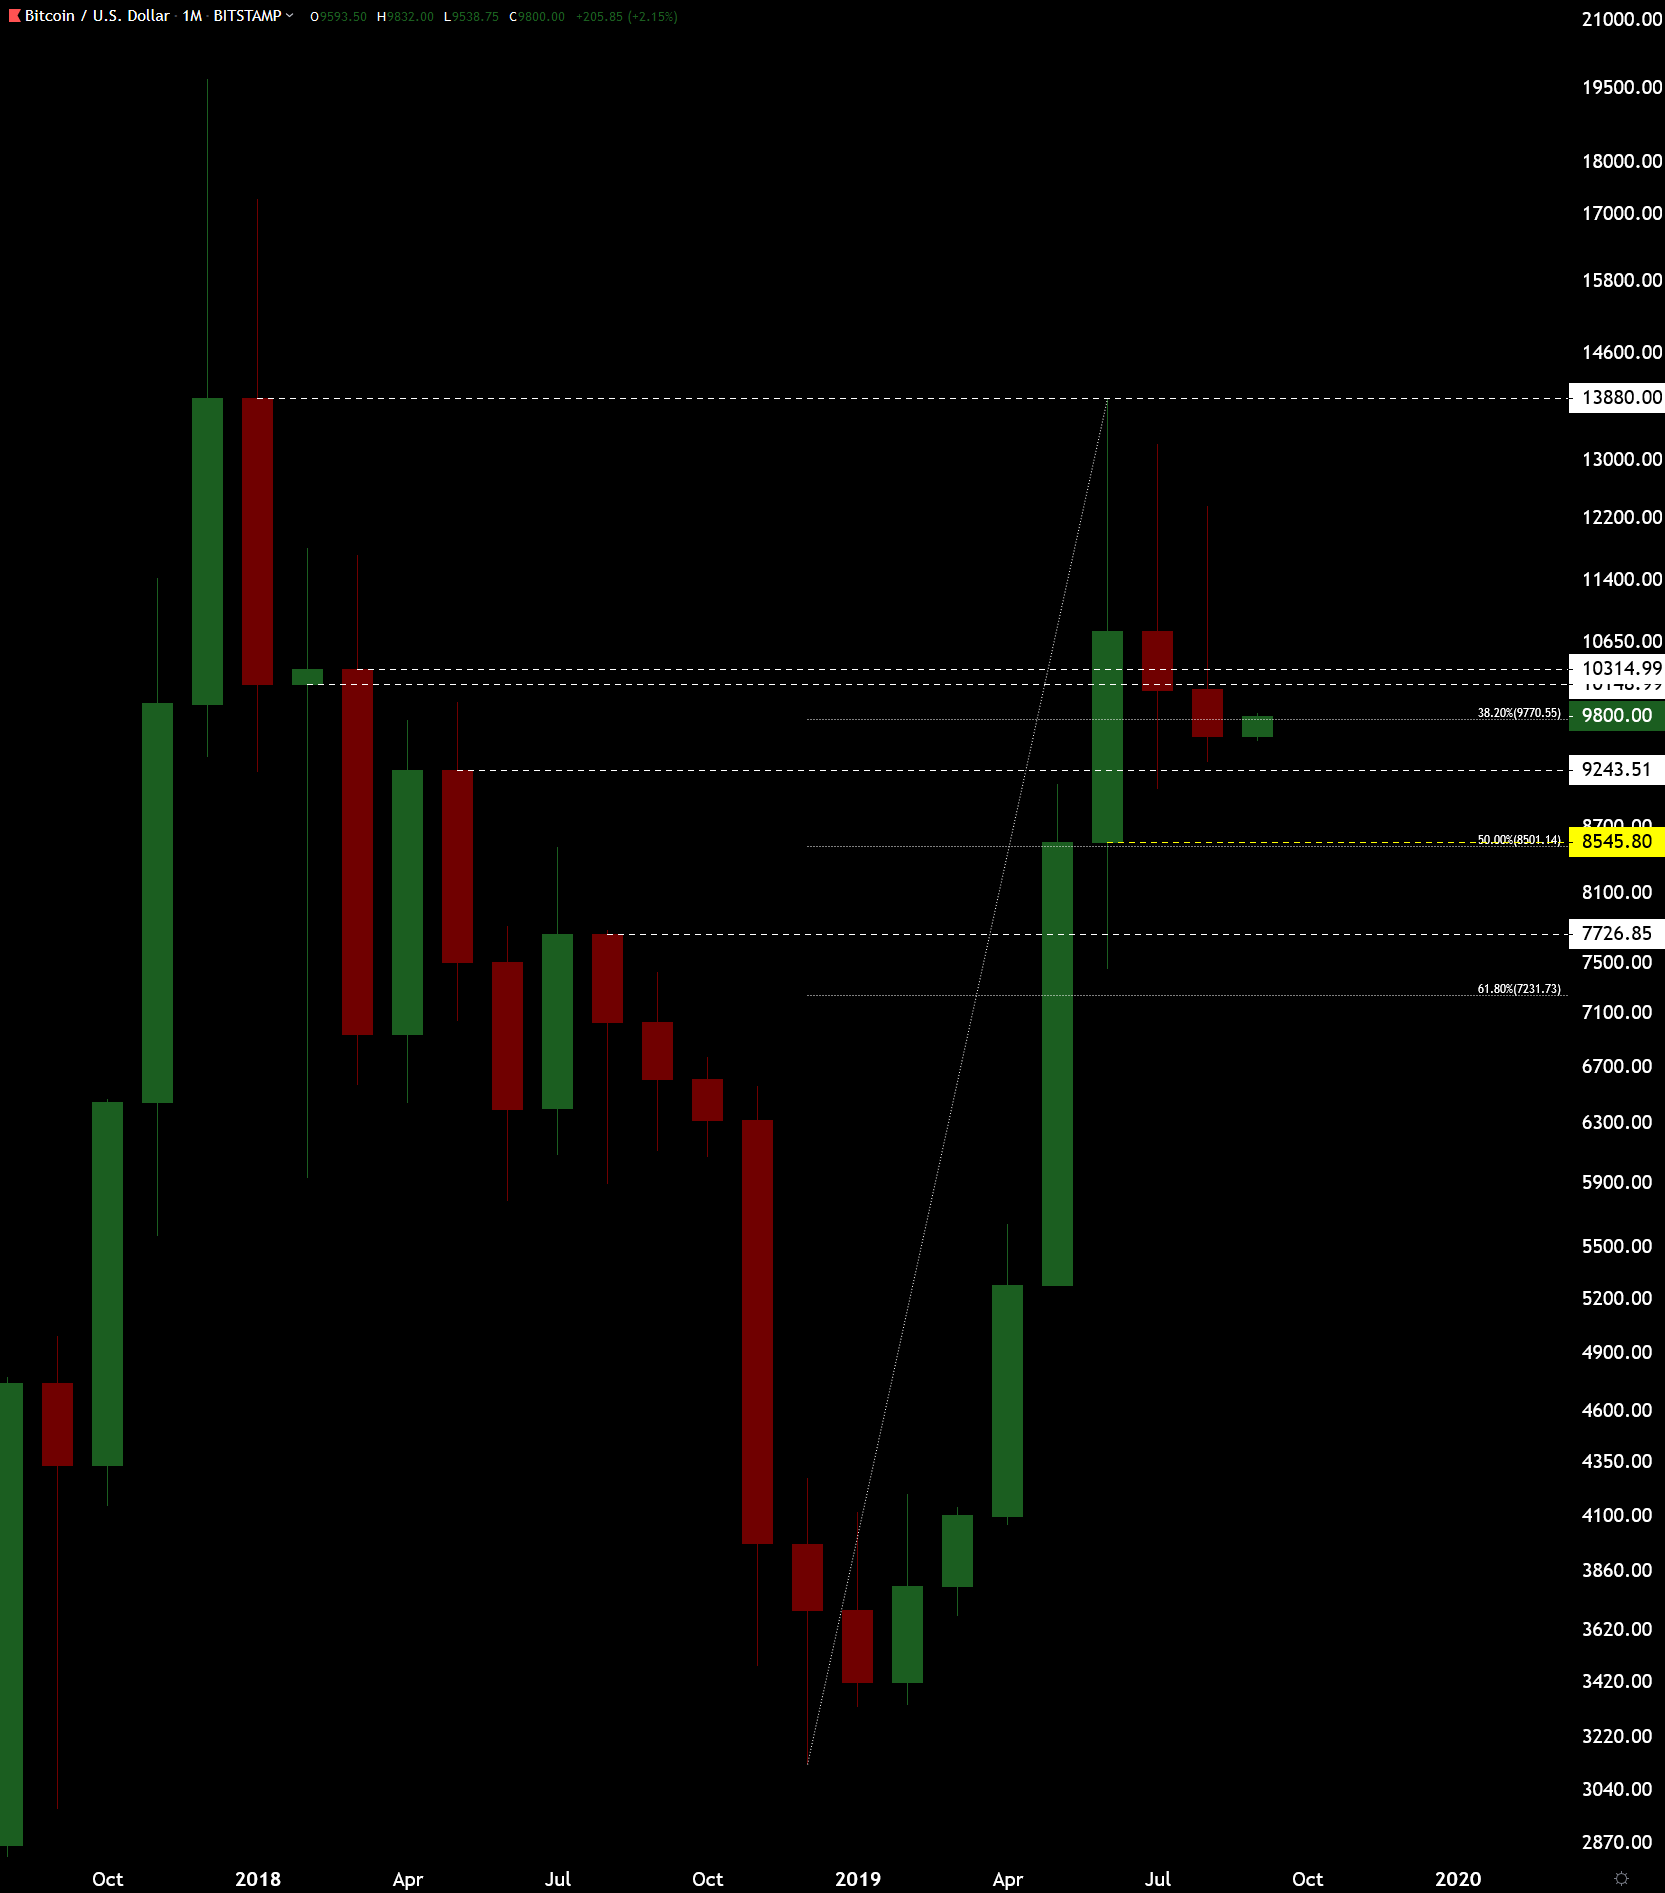
Now let’s see next which S/R might be stopping the price to go down. In my opinion the open marked with the yellow line, the top candles open which is at the same level with the 50% fibonacci retracement of this rise from $3k.
This is the best candidate for the S/R for the time being.
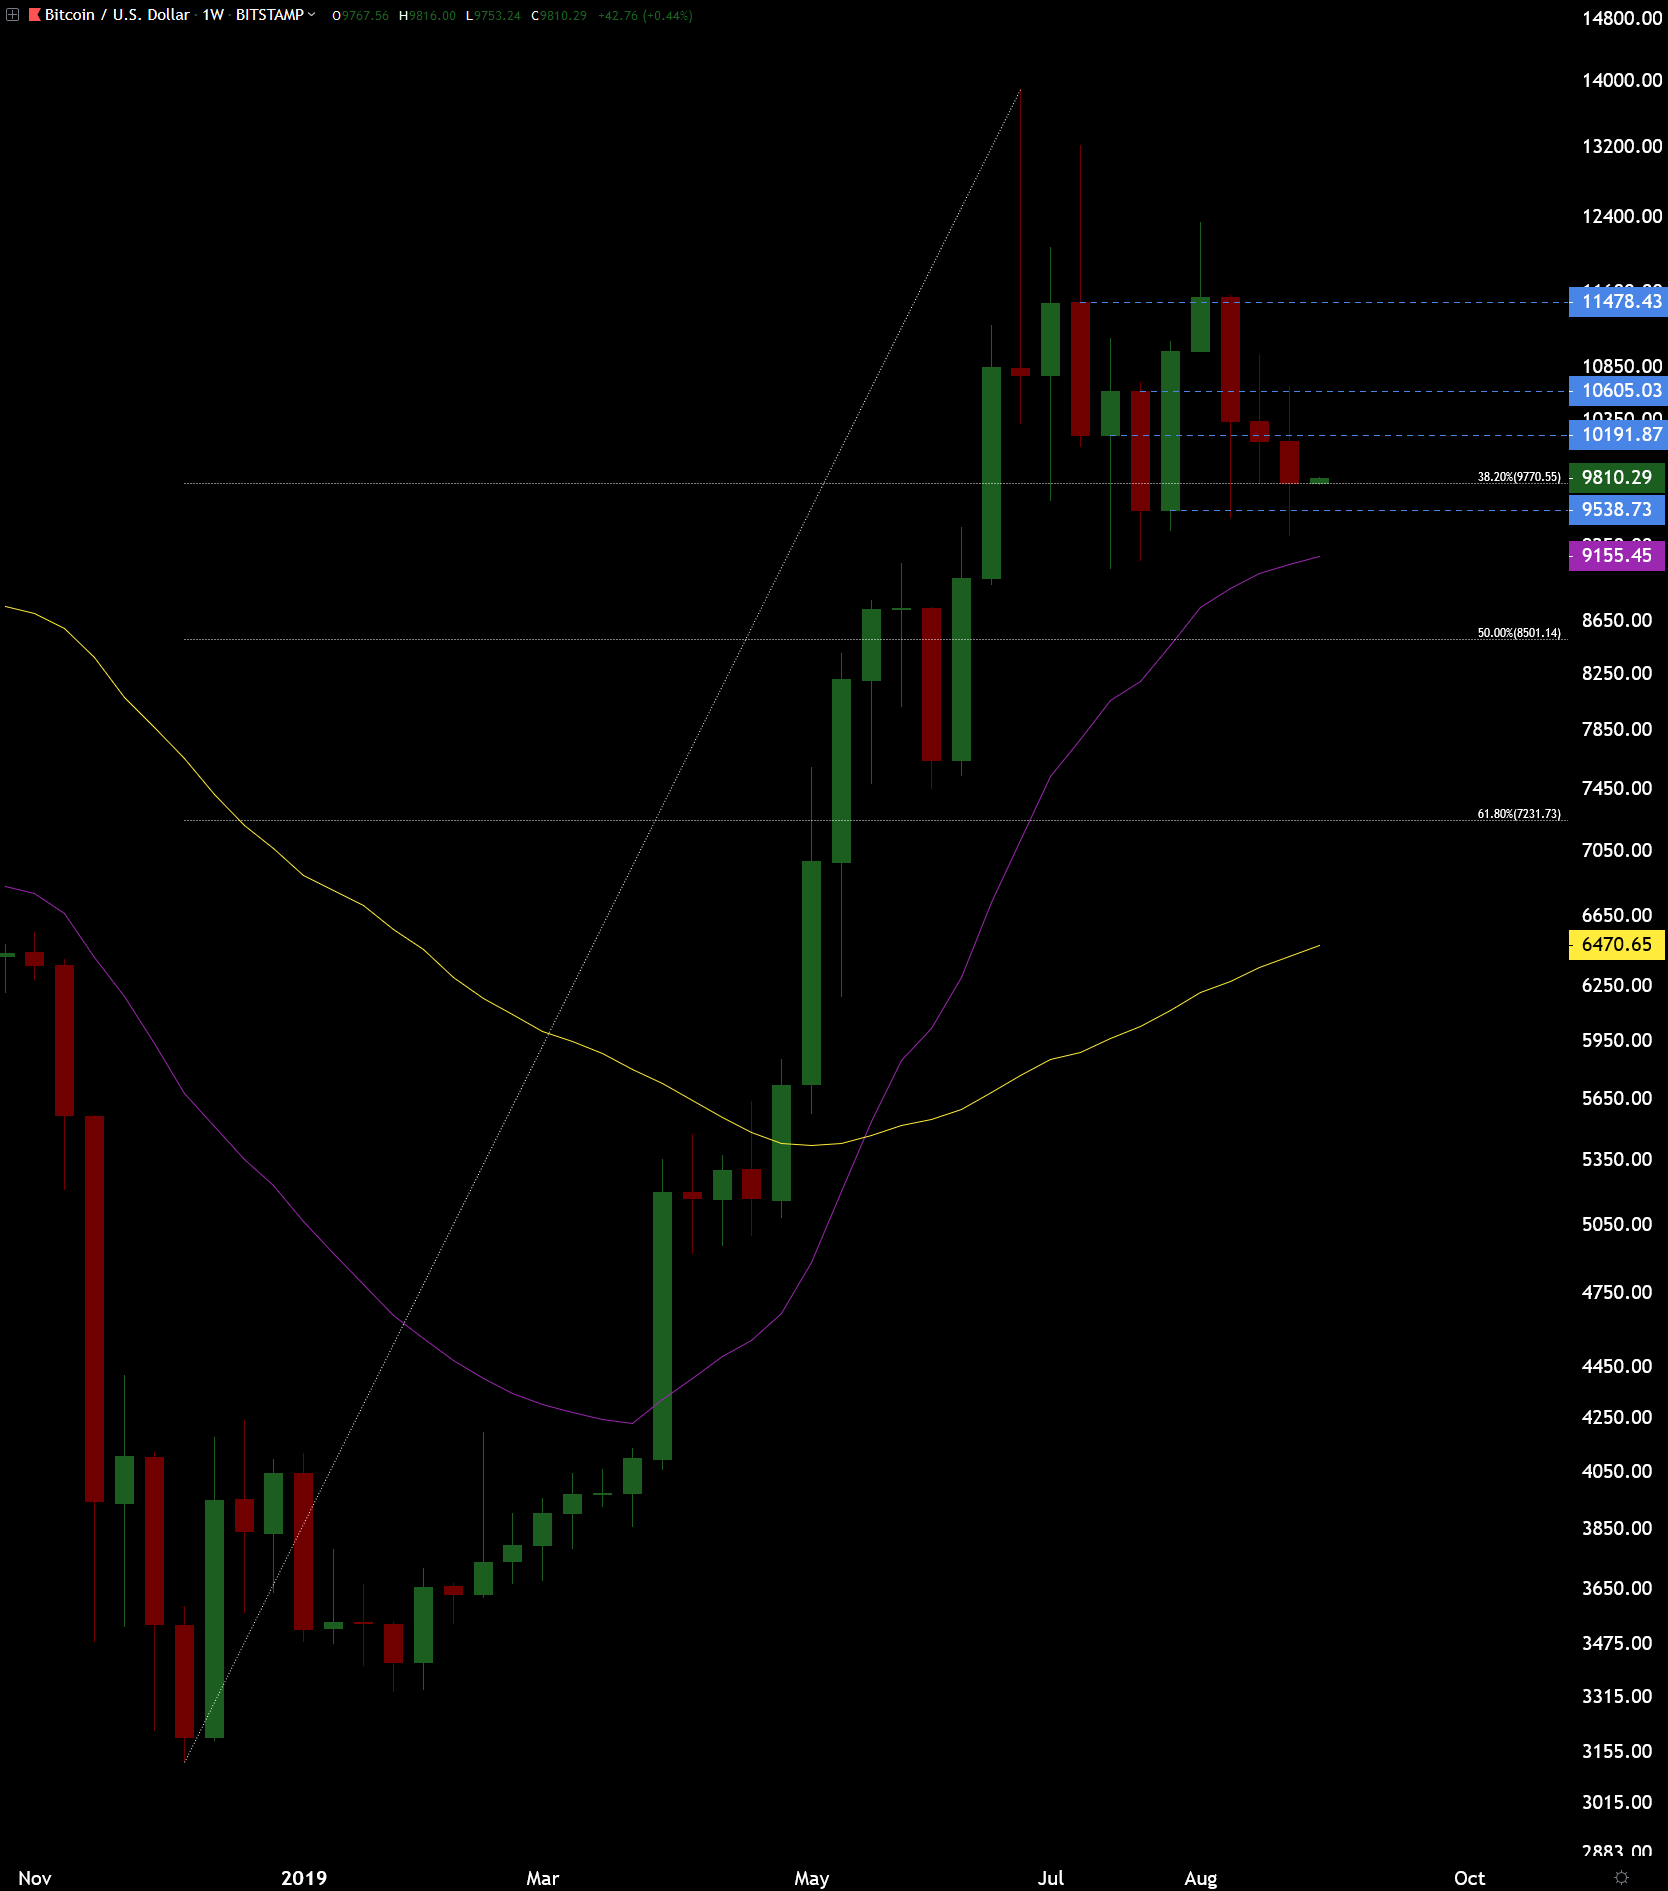
If we want to look for faster signals which might change our mind then it’s good to look at the weekly chart. Always be ready to change your mind when new information comes to light.
Purple is the EMA (exponential moving average) from 20 weeks and this EMA worked very well as support during the previous bull market from $200 to $20k. If we get a good reaction from this, nice wick and/or bullish engulfing weekly candle then maybe the correction is over and we are ready to go up again.
Of course it is possible that we won’t go any lower than this, if so then I would guess we see a triangle.
The rise from $3k has been different to the ones during last bull market, except the very last leg of the last bull market resembles this rise quite well, as you can see from the monthly charts. This makes me think with these monthly wicks that the EMA from 20 weeks might not work as well now as it might be too fast acting for this bull market.
The author has written over hundred bitcoin analyses in the span of five years and is very experienced in bitcoin investing.