The technical analysis of week 18 maps the latest technical and fundamental indicators. We take a deep dive into bitcoin’s channel model, heatmap, and general liquidity environment. In addition, we study the impact of the BRC-20 standard on the network and different cycle models.
Declining Liquidity, Threat, or Opportunity?
The moderate downward trend of the crypto market continues for the second week, weakening bitcoin by about one percent on a weekly basis. Last week’s TA assessed the possible spread of the May anomaly, i.e., the Sell in May phenomenon, to the crypto market. If the spot price continues to fall, the May effect can be seen happening now.
From a technical perspective, bitcoin has fallen from its March bullish main channel (pink) to a secondary channel (turquoise) that will be stress tested in the coming days. Moving from the main channel to the secondary channel, bitcoin forms a multi-month sideways movement (yellow), which would be a negative signal if liquidity continues to evaporate.
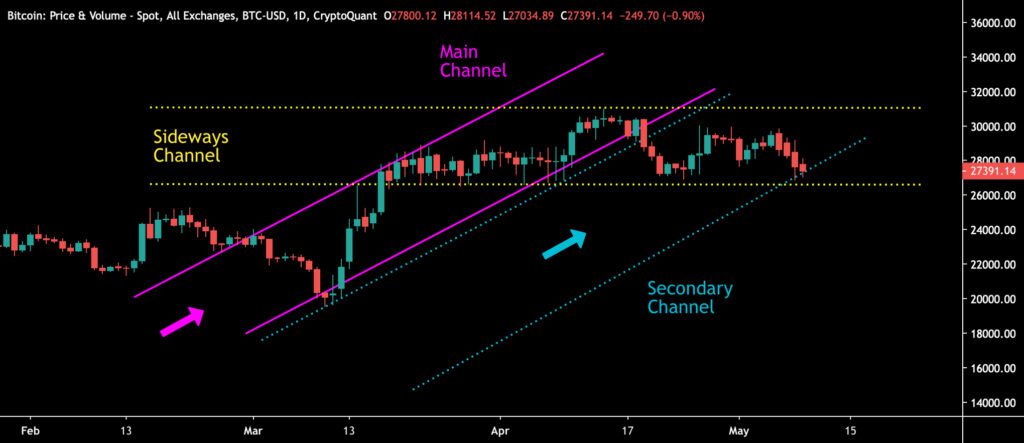
Sources: Timo Oinonen, CryptoQuant
The Material Indicators heat map says that bitcoin’s main resistance level is still at 30 000 dollars, although its strength has weakened. At the same time, the support level of $27 000, which previously looked weak, is slowly strengthening. The Cumulative Volume Delta (CVD) indicates a clear downward trend in liquidity, partly supporting the May anomaly.
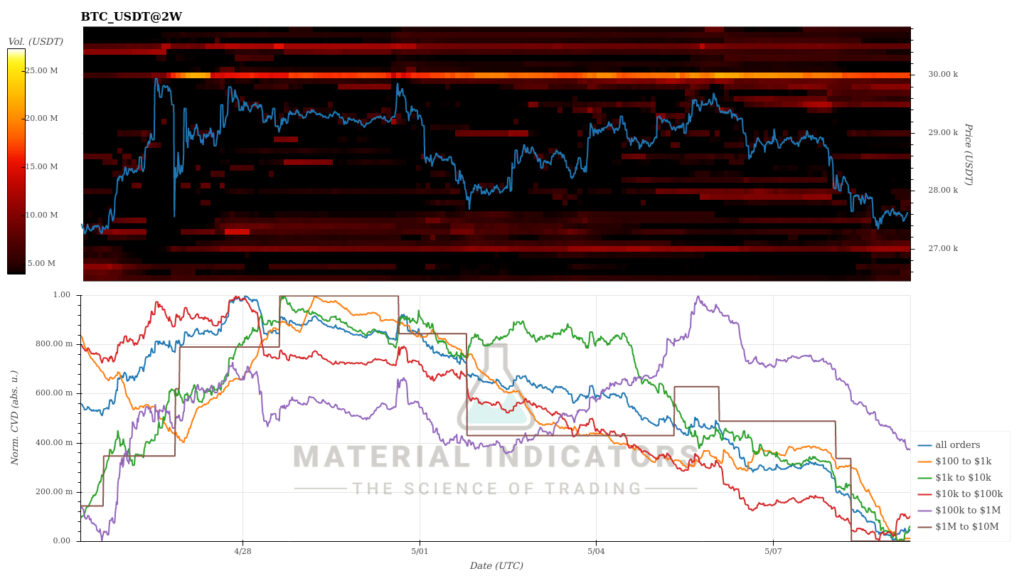
Source: Material Indicators
The liquidity situation is further weakened by the radical regulation policies of the United States, which this week hit the market maker company Jane Street Group and Jump Crypto. The Jane Street Group announced that it is scaling down its entire global crypto business, while Jump Crypto is scaling back its operations in the US only.
Although the news seems negative, there may also be a silver lining in the weakening of market-maker companies. As a general rule, reduced liquidity increases price volatility and may thus make the market more interesting to traders.
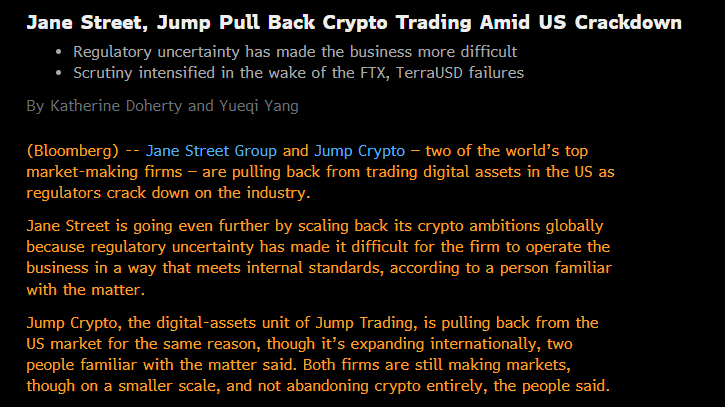
Source: Bloomberg
The potentially increasing volatility is also mirrored by the macro market’s VIX index, which according to the Variant Perception company, is about to rise within 50 days. In summary, the VIX index generates a forward projection of volatility. The higher the index number, the higher the risk experienced by the market.
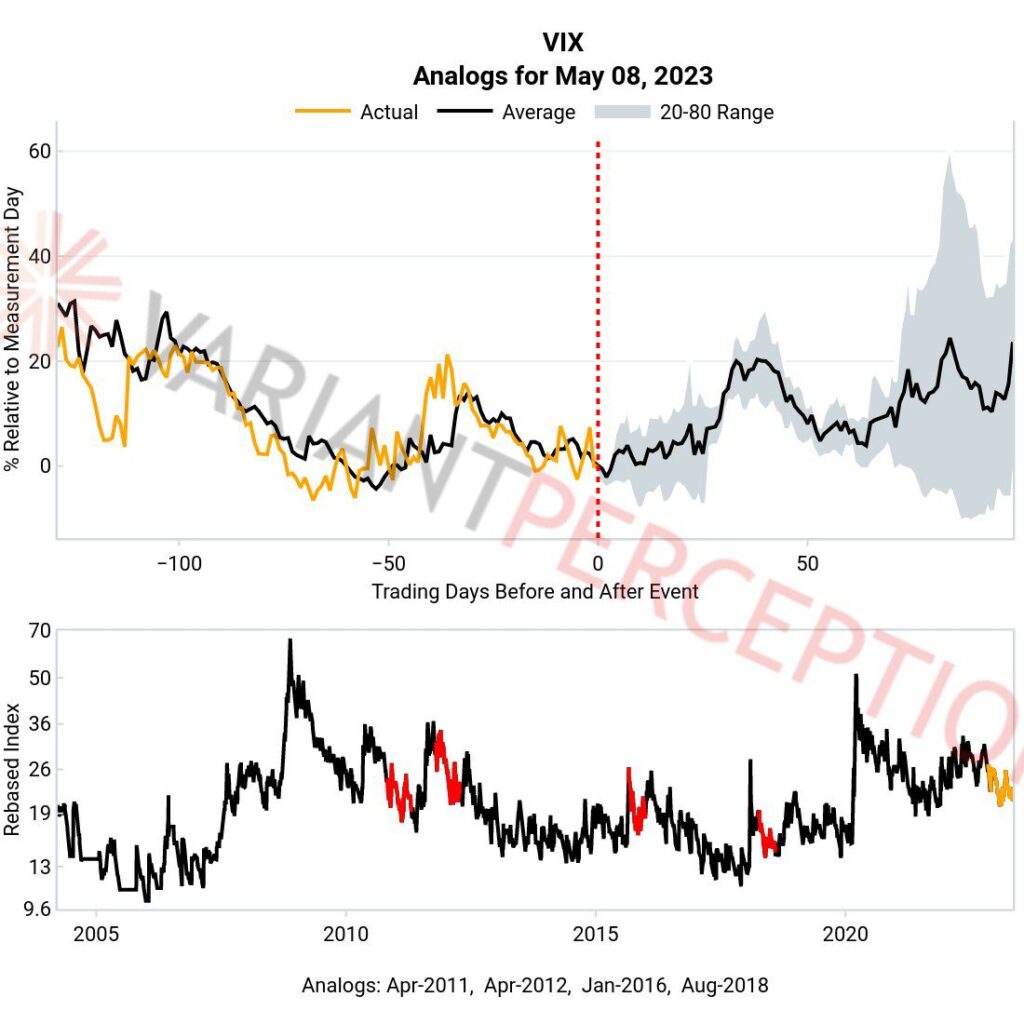
Source: Variant Perception
The week has been moderately negative for cryptocurrencies, with smaller tokens correlating with bitcoin. Even the field of higher beta tokens has not seen real volatility. The leading stock market index S&P 500, gained about one percent, while gold gained 1,5 percent as the risk profile of the banking sector increased.
7-Day Price Performance
Bitcoin (BTC): -1,4%
Ethereum (ETH): 0,5%
Litecoin (LTC): -8%
Aave (AAVE): -5,6%
Chainlink (LINK): -4,9%
Uniswap (UNI): -4,5%
Stellar (XLM): -3,9%
XRP: -7%
Get started with Bitcoin Litecoin Ethereum AAVE USDC Stellar Ripple
Join Coinmotion and buy your first cryptocurrencies within minutes!
S&P 500 Index: 0,9%
Gold: 1,5%
Is Bitcoin under a Speculative Attack?
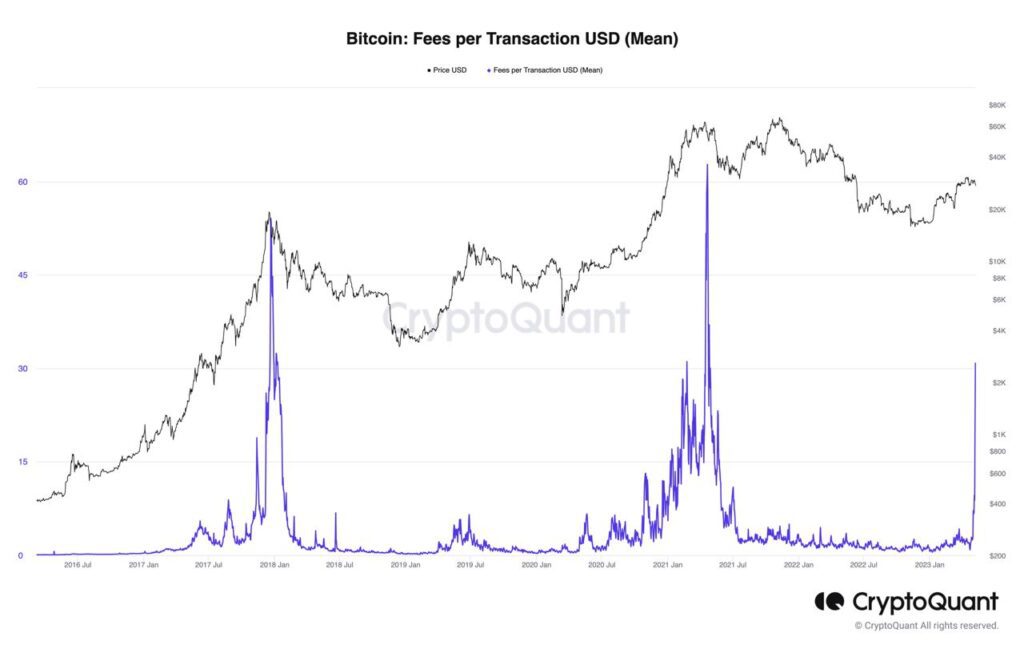
During the early days of May, the Bitcoin network experienced a huge stress test in the form of skyrocketing transaction fees and unconfirmed transactions. The network’s average transaction fee rose to nearly $30 within 24 hours, representing the highest fee level since the spring 2021 bull cycle.
The main underlying factor of the situation is the BRC-20 standard, based on the Ordinals protocol, which enables e.g., the creation of NFTs and various tokens on the Bitcoin blockchain. Unlike Ethereum’s well-known ERC-20 protocol, BRC-20 does not support smart contracts and can only be used with bitcoin-related wallets. The Ordinals protocol takes advantage of the Taproot upgrade released back in 2021.
Learn more: BRC20 tokens: How they differ from other cryptocurrencies
Read more: New Bitcoin NFTs spark discussion — What are Bitcoin Ordinals?
Source: CryptoQuant
The popularity of the new BRC-20 standard has set speculators and investors on the move while causing severe congestion in the Bitcoin network, which in turn has raised transaction fees to unsustainable levels. Experts are currently divided on whether the situation is about organic growth, DDoS-style denial of service attack, or both?
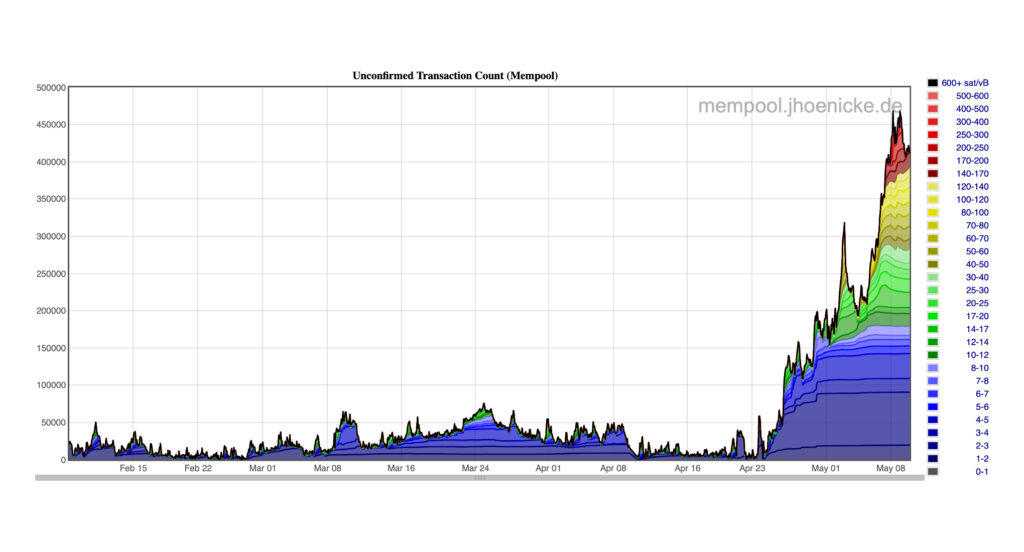
The Bitcoin network is currently showing signs of a deliberate and hostile blocking of activity, with over 450 000 (small) transactions in the queue. Many entities have paid substantial transaction fees to send these microtransactions, resulting in the fees exceeding the value of the transaction itself. At the same time, the transaction costs have become unreasonably high for the average user.
Source: Jochen Hoenicke
El Salvador can be considered as a case example of unreasonable transaction fees, as its citizens sending bitcoins have to pay fees worth tens of dollars, while the average salary in the country is a few hundred dollars. El Salvador previously marketed bitcoin as a cheaper alternative to traditional payment brokerage services.
Despite everything, Michael Saylor, known from the company MicroStrategy, took a calm approach to the recent stress test of the Bitcoin network. According to Saylor, Bitcoin will serve as a platform layer for various applications, and L2 scaling of the leading cryptocurrency will be successful with the help of the lightning network.
Executive Chairman of MicroStrategy, @saylor, on the impact of Ordinals on Bitcoin mining and the power of inscriptions.
— Leonidas.og (@LeonidasNFT) May 9, 2023
“What happened with Ordinals and NFTs is we crossed this chasm from what was a bearish scenario to a bullish scenario. If I was a miner I would be ecstatic.” pic.twitter.com/UDIGN5C08I
Transaction fees forced the leading exchange Binance to temporarily suspend bitcoin transfers. The exchange later announced that it’s investigating the wider use of Lightning as part of its platform business. The current situation of the Bitcoin network drives faster adoption of the Lightning Network in all user segments.
Coinbase Premium Index Reflects Emerging Demand
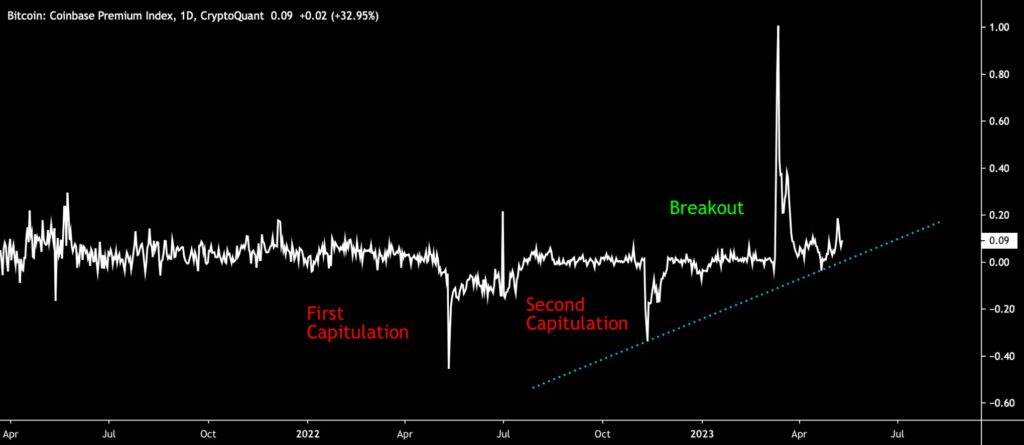
The Coinbase Premium Index shows how the market faced two capitulation moments (red) last year during the late spring and late year selling pressure. However, the premium index has recently found exceptional momentum, reaching a value of one (1) during the spring parabolic price curve.
As a whole, the Coinbase Premium Index has continued to grow according to its trendline (turquoise) from the bottom of November to the summer of 2023. The premium index reflects that US investors are now seeking protection by growing bitcoin exposure. The emerging mistrust of banks thus seems to correlate with Bitcoin’s rising popularity.
Sources: Timo Oinonen, CryptoQuant
Coinbase was one of the first publicly listed crypto exchanges in the world (ticker: COIN), and the company is also one of the most transparent players in the industry. These features attract American institutions and HNWI clients towards the company. The embedded chart uses the Coinbase Premium Index, which measures the percentage difference between the bitcoin price on Coinbase (USD pair) and Binance (USDT pair).
Pi Cycle Top Shows Bitcoin in Transition Phase
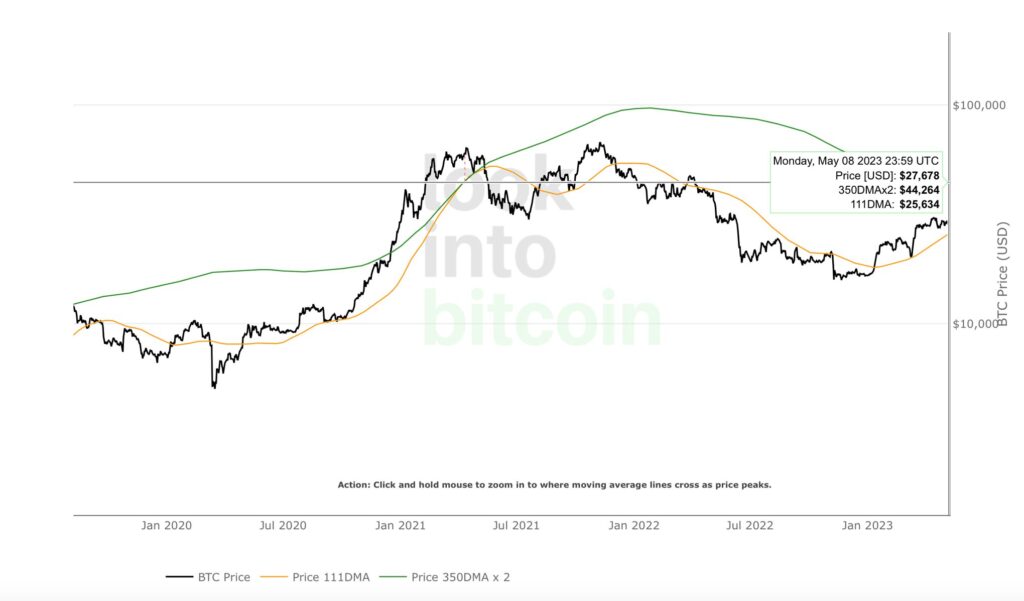
Despite the recent technical weakness, the direction of bitcoin’s broader perspective still looks good. The Pi Cycle Top indicator, developed by Philip Swift, consists of 111 (yellow) and 350 (green) day averages, which have accurately predicted the market cycle phases in recent years. In the Pi Cycle Top, the 350-day average is multiplied by two.
Bitcoin’s current market setting is particularly reminiscent of the 2019 cycle mid-point, where the price of bitcoin rose significantly towards the summer. In 2019, the 111 and 350-day average graphs converged but did not cross. If the year 2023 follows the main features of 2019, the price of bitcoin will rise towards the summer but may go sideways in the rest of the year.
Source: LookIntoBitcoin
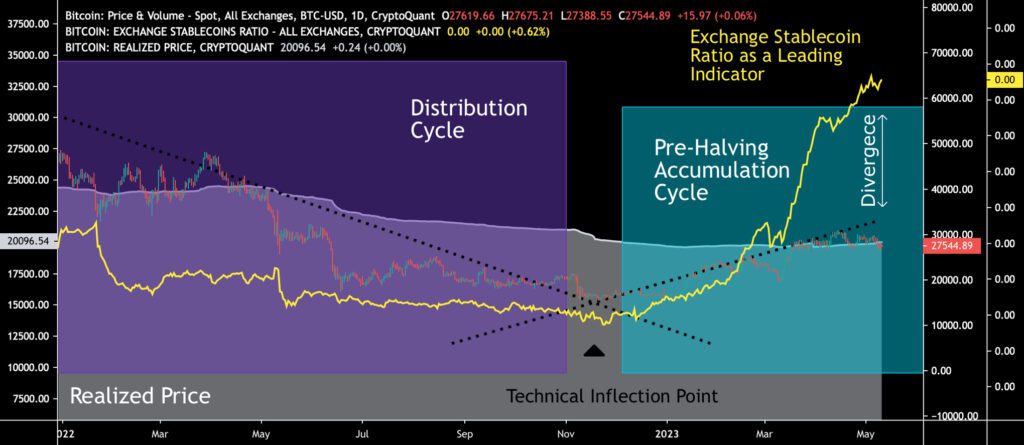
At the turn of the year, bitcoin passed its technical turning point, where the multi-year falling and rising trendlines met. In addition to the technical turning point, bitcoin will be boosted by the approaching halving event of 2024, which is estimated to take place in 351 days.
The estimated date for bitcoin’s next halving event is April 27th, 2024, and it will increase the cryptocurrency’s scarcity by dropping the block reward from 6,25 to 3,125. Bitcoin’s halving event will be outpaced by its sister currency Litecoin, which has an estimated halving date of August 3rd, 2023.
Sources: Timo Oinonen, CryptoQuant
To visualize the market and the halving, the recent price development of bitcoin can be divided into two cycles: The distribution cycle (purple) and the pre-halving accumulation cycle (turquoise). The distribution cycle spans back to the bull market of 2021, and its endpoint is located in the same area as bitcoin’s technical turning point. In November 2022, bitcoin entered a new accumulation cycle where investors are trying to price in the upcoming event. Using previous halving events as a benchmark, a six-figure spot price level after the 2024 halving would be fully justified. This is a compelling season for accumulators.
What Are We Following Right Now?
The traditional US cryptocurrency exchange Bittrex has gone bankrupt. Bittrex’s golden age was during the 2017-2018 ICO epoch, when it was a popular token platform. In the spring of 2023, Bittrex got into the teeth of the US Securities and Exchange Commission SEC, as the exchange faced charges of selling unlicensed securities.
Bittrex went bankrupt in Delaware, less than a month after the Securities and Exchange Commission accused the crypto platform of flouting securities rules https://t.co/IasyBO7T4p
— Bloomberg Crypto (@crypto) May 8, 2023
Michael Saylor, known for his company MicroStrategy, clarifies his views on Bitcoin, the Lightning Network, artificial intelligence, and information security.
Interesting panel on institutional Bitcoin moderated by MicroStrategy’s Phong Lee. How should companies prioritize digital assets as part of their roadmap, and how to create an institutional Bitcoin strategy?
Get started with Bitcoin Litecoin Ethereum AAVE USDC Stellar Ripple
Join Coinmotion and buy your first cryptocurrencies within minutes!
The views, thoughts, and opinions expressed in the text belong to the author and not necessarily to the author’s employer, organization, committee, or other group or individual.
