

The technical analysis of week 19 examines the market from a technical and fundamental perspective. We map, e.g., bitcoin’s triple bottom model, heat map, and V-shaped recovery. In addition, we will find out why bitcoin’s correction is clearly technical and how long-term investors are clearly above their break-even point.
Bitcoin Continues its Consolidation Phase
The crypto market’s two-week price drop has turned into a sideways momentum while the leading cryptocurrency, bitcoin, tries to hold on to its $27 000 level. In the market, there are clear indications of waning liquidity in the short term as cryptocurrencies follow the May phenomenon.
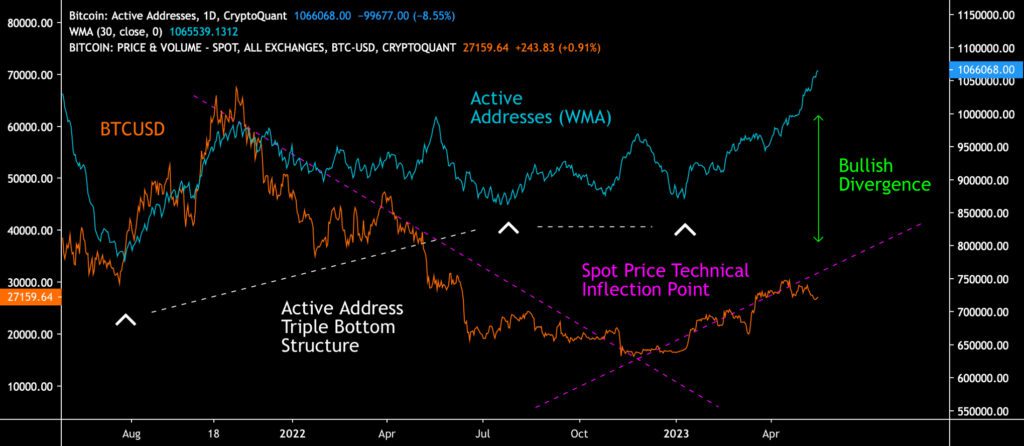
Despite the technical weakness, bitcoin is still holding on to its early-year strength, fueled by the technical inflection point (pink). Bitcoin is also supported by the growing number of active addresses (turquoise), creating a clear divergence (green) to the spot price (orange).
The triple bottom structure of active addresses presented in the TA of week 9 is clearly coming to fruition. Blockchain data shows how the number of active addresses (30-day weighted moving average) generated three individual price bottoms in 2018-2019 and how the current 2021-2023 cycle is creating a similar structure (white).
Sources: Timo Oinonen, CryptoQuant
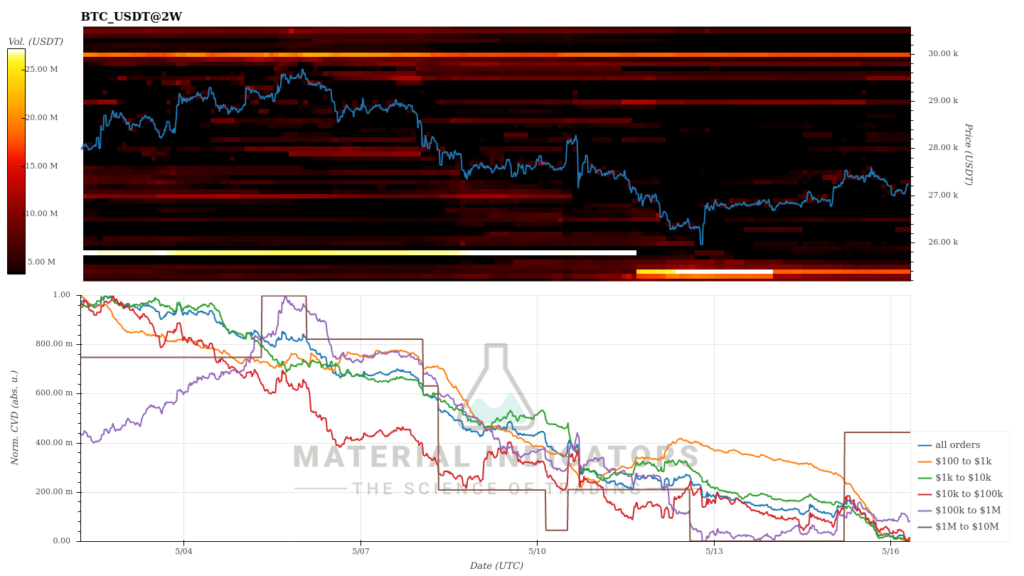
The Material Indicators’ heat map says that bitcoin’s main resistance level is still at $30 000, although the strength of the resistance level has gradually weakened. At the same time, the $25 400 support level, which looked very weak before, is slowly strengthening. The cumulative volume delta (CVD) indicates a clear downward trend in liquidity, partly supporting the May anomaly.
Source: Material Indicators
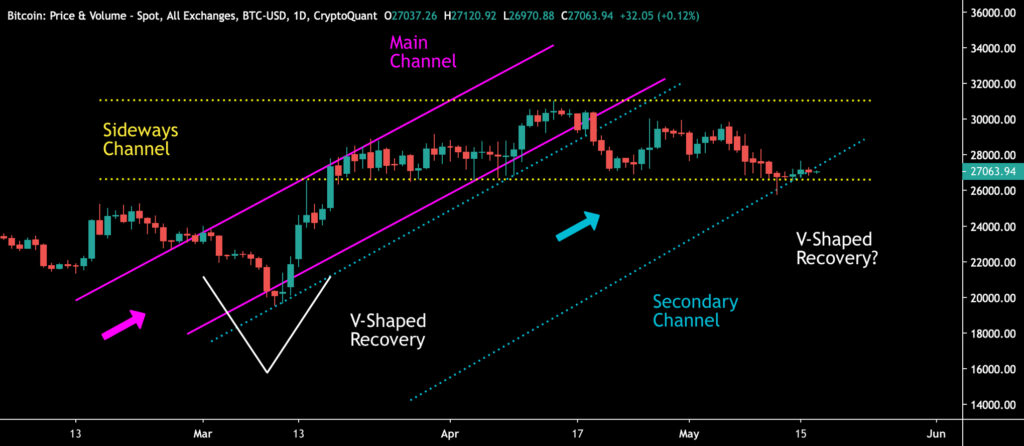
Bitcoin has dropped from its March bullish main channel (pink) to a secondary channel (turquoise) that has been stress tested for several days. For now, the spot price seems to be following the turquoise channel. At the same time, bitcoin has formed a multi-month sideways channel (yellow).
At the beginning of March, a V-shaped recovery (white) was seen, and it can be assumed to happen again. The May-June V-recovery calls for a further weakening of the spot price, but the silver lining of the setup is the short squeeze potential.
Sources: Timo Oinonen, CryptoQuant
The crypto market is now progressing in an almost sideways movement, although decreasing liquidity brings clear downward pressure to the field. Bitcoin and Ethereum weakened by a few percent, while Litecoin, which is preparing for its halving event, gained almost 15%. The halving in 77 days will increase the scarcity of the Litecoin network by splitting its block reward from 12,5 to 6,26.
The XRP token of Ripple Labs, which is in a legal battle with the US Securities and Exchange Commission SEC, has strengthened by four percent in a week against major cryptocurrencies. The positive trend can be interpreted as describing the success factor of Ripple Labs against the SEC. The main macro market index S&P 500, and gold weakened only slightly during the week, mirroring the May phenomenon.
7-Day Price Performance
Why the Recent Liquidity-Driven Correction is Technical, not Fundamental
The recent spot price correction of bitcoin has caught many traders off guard, as the drawdown has correlated with a sudden drop in liquidity. Despite the recent weakness, BTCUSD has still climbed 64 percent year-to-date.
In my opinion, the recent correction is definitely a technical one, as Bitcoin’s on-chain fundamentals remain promising. In this article, we’ll go through several factors supporting my thesis.
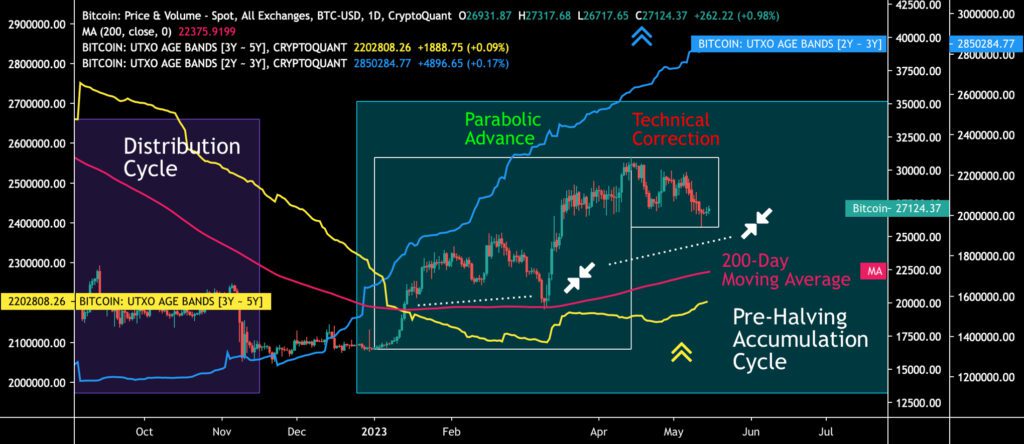
First of all, bitcoin’s 200-day moving average (red, 200DMA) acts as a support line for the asset. Bitcoin decisively crossed the 200-day moving average in January, and the 200DMA acted as a crucial support in March’s V-shaped recovery (white). With the current spot-related weakness, I expect BTCUSD to be deflected from the 200DMA surface again (white).
In the broader picture, bitcoin’s market behavior can be segmented into accumulation (turquoise) and distribution (purple) phases, which together form a multi-year series of cycles. Institutional money has traditionally favored accumulation cycles, while retail investors have been active in distribution cycles. Bitcoin’s history is also defined by halving events, which are always preceded by a pre-halving accumulation cycle (turquoise).
Praeterea, bitcoin’s older UTXO waves 2Y-3Y (blue) and 3Y-5Y (yellow) both support the spot price. The 2Y-3Y wave already started its accumulation path in 2022 after a long epoch of stagnation.
The 3Y-5Y UTXO wave radically shifted its trajectory in early 2023, pointing upwards and mirroring accumulation in this cohort. Both UTXO waves represent long-time horizon investors and so-called “smart money”.
In summary, bitcoin is supported by multiple on-chain and fundamental tailwinds, despite the recent technical correction. Bitcoin’s 2024 halving is only 348 days away, gradually rising investor’s expectations. The leading cryptocurrency sits firmly in its pre-halving accumulation cycle, don’t miss out!
Sources: Timo Oinonen, CryptoQuant
Long-Term Investors Well Above the Break-Even Level
According to Kaiko’s blockchain data, bitcoin’s intraday volatility is clearly increasing. The swing slowed considerably after the selling pressure in November until the market’s liquidity increased again in the spring. While volatility increased bitcoin in February-March, later in the spring, its effect on the cryptocurrency has been negative. Despite the volatility, SOPR data shows long-term investors are the most above break-even in six months.
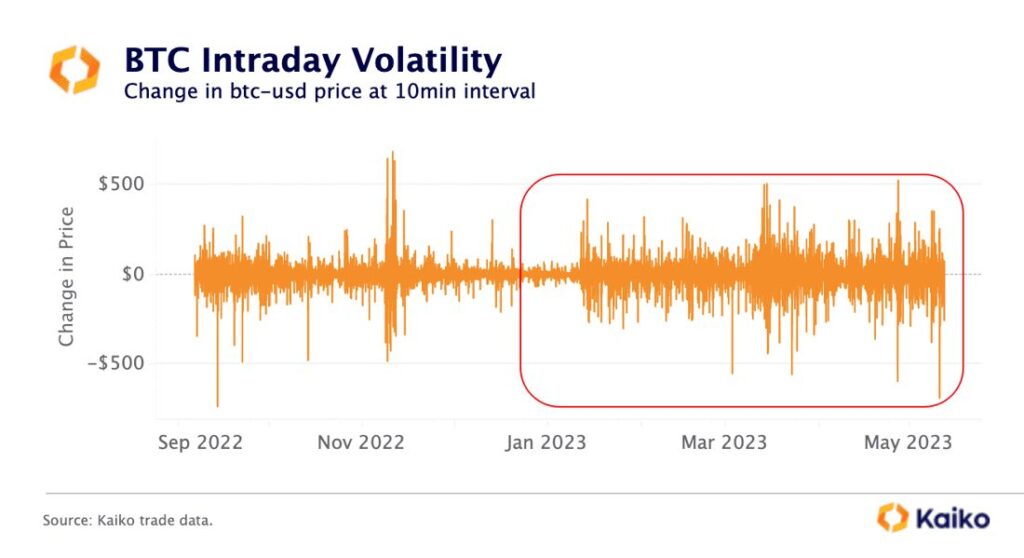
Source: Kaiko
The SOPR indicator was originally developed by Renato Shirakashi, and it’s calculated by dividing the realized value of bitcoin (USD) by the value of the original bitcoin transaction. Or in simplified terms, the selling price is divided by the purchase price. The SOPR indicator can be interpreted with the following logic:
SOPR > 1 = Seller in profit
SOPR < 1 = Seller at a loss
The SOPR data shows how during last year’s deep bear cycle, the STH-SOPR value of short-term investors dropped to a low of 0,91. After the turn of the year, short-term investors clearly climbed above the break-even point (red, 1), with the STH-SOPR reading peaking at 1,08. However, after the rise in February-March, the profitability of short-term investors has clearly decreased.
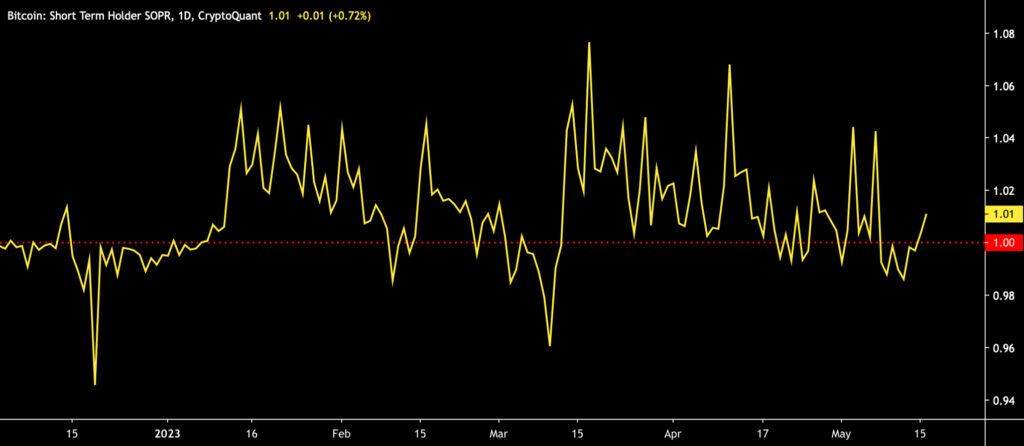
Sources: Timo Oinonen, CryptoQuant
In contrast to the short-term investors, the profitability of the long-term investors (LTH-SOPR) increased towards the summer, while in February-March, it was clearly below the break-even (red, 1). While still in mid-March, LTH-SOPR was clearly in the red, in April-May, the metric exceeded the level of 2,4.
The SOPR metric clearly reflects the impact of market uncertainty on investors and the superiority of the long-term strategy as volatility increases. Also in the light of my own subjective experience, the most profit in the bitcoin market has been made by long-term horizon holders, while speculative traders have a clearly heightened risk of losing their assets.
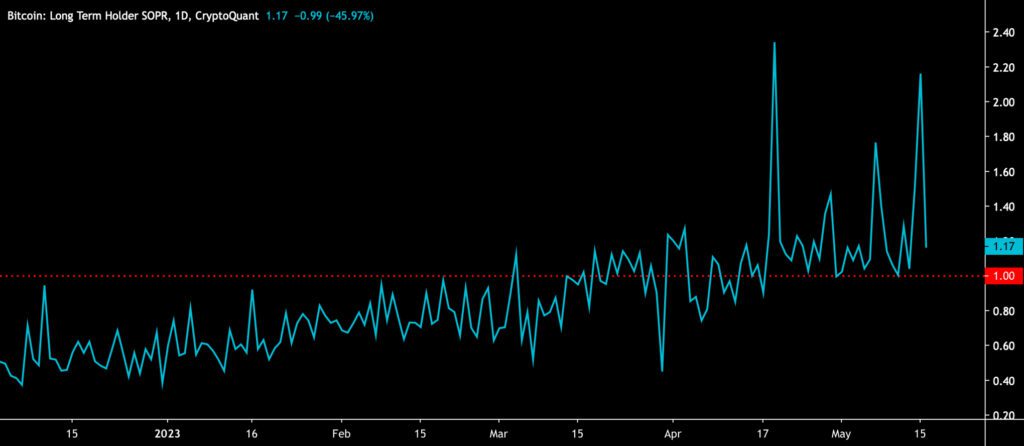
Sources: Timo Oinonen, CryptoQuant
UTXO Data Mirrors the Shifting Market Environment
When Satoshi Nakamoto created Bitcoin, he made a structure that required a significant amount of work (PoW). The Bitcoin blockchain is also transparent, allowing us to examine the active supply and UTXO data. The research firm Delphi Digital research company successfully predicted a market capitulation in early 2019 using the UTXO data. The current UTXO distribution resembles the situation in 2019, but the final capitulation may occur after the market cap falls below the delta cap level. Undercutting the delta cap would mean a further -30 percent price correction for bitcoin.
The retail cohort 1M-3M wave (turquoise) reflects the return of the trader segment’s interest, although the red 3M-6M shows clear selling pressure. The 2Y-3Y wave (blue), on the other hand, shows the return of interest from investors with a longer-term horizon, rising clearly in early 2023. The 2Y-3Y clearly sold off at the peak of November 2022 and left the field for almost a year. As a whole, the UTXO age distributions tell about the transition phase of the market, which is hoped to be clarified by the 2024 halving event at the latest.
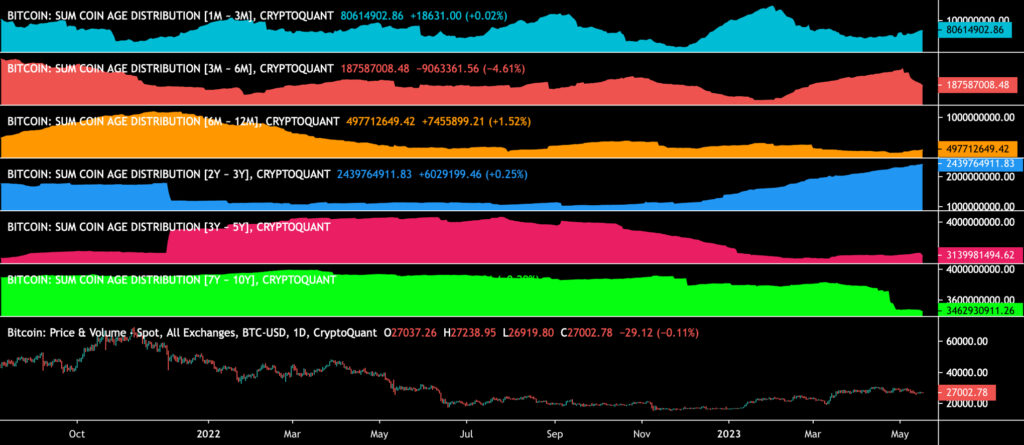
Sources: Timo Oinonen, CryptoQuant
1M-3M (turquoise): Moderate accumulation
3M-6M (red): Selling pressure
6M-12M (orange): No change
2Y-3Y (blue): Accumulation
3Y-5Y (pink): No change
7Y-10Y (green): Selling pressure
What Are We Following Right Now?
Macro strategist Patrick Perret-Green already warned last year that the deteriorating liquidity environment would cause serious problems for the economy. Now Perret-Green predicts that the banking crisis will continue.

According to Timothy Peterson, more than 10 percent of US households already own bitcoin.
Analyst Lyn Alden’a assessment on the bitcoin market and Lightning Network, particularly from an institutional perspective.


The views, thoughts, and opinions expressed in the text belong to the author and not necessarily to the author’s employer, organization, committee, or other group or individual.