

The technical analysis of week 9 maps uncertainties related to Silvergate Bank and their impact on the market. In addition, we delve into a set of technical and fundamental indicators, such as the realized price of bitcoin and the correlation of open interest with volatility. We also familiarize ourselves with a 2019-derived technical triple bottom model.
Silvergate Bank, Favored by Exchanges, Postpones its Annual Report
The price development of the crypto market has continued in a downward trend for the last seven days, with the leading cryptocurrency, bitcoin weakening by -5,4 percent. The market of digital assets has mainly been weighed down by uncertainties related to Silvergate Bank. The share price of Silvergate (ticker: SI), which is popular with cryptocurrency exchanges, has fallen by -69 percent since the beginning of the year and by 95 percent within 12 months.
Silvergate announced last Wednesday (1st of March) that it is postponing the submission of the 10-K report to the US Securities and Exchange Commission SEC. At the same time, the bank announced the need for an additional audit, which is done at the special request of the auditors. After the announcement, the company’s share price turned down sharply, and a number of blockchain industry firms (Bitstamp, Cboe Digital Markets, Circle, Coinbase, Crypto.com, Galaxy Digital, Gemini, LedgerX, and Paxos) announced that they were withdrawing from co-operation with Silvergate. So far, only the Kraken exchange seems to have confidence in Silvergate’s state of affairs.
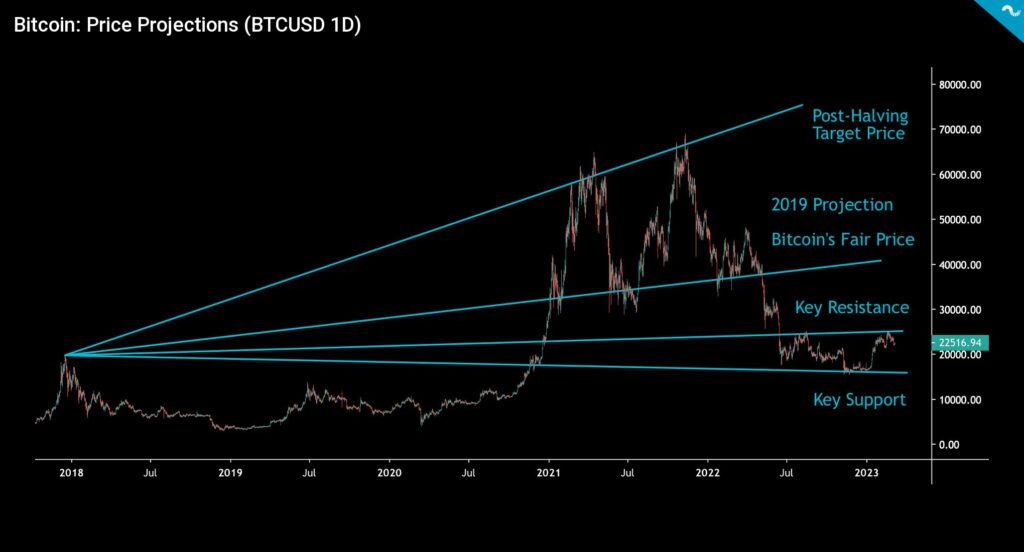
On a technical level, bitcoin broke out of its previous ascending channel but still oscillated between $22 000 and $25 000. Trader and analyst Tone Vays said he sticks with his 40 percent bitcoin allocation until the spot price makes a clear breakthrough. Using the 2017-2018 cycle peak as an anchor point, we can draw several technical projections for bitcoin. The $19 000 level at the end of 2017 continues to act as a confluence zone to which the price of bitcoin seems to be drifting. $19K also serves as a support zone for the spot price, which has a resistance zone of $25K. The 2019-based price projection, presented in a previous TA, would allow bitcoin to rise as high as $46 092, which also closely correlates with bitcoin’s current “fair price.”
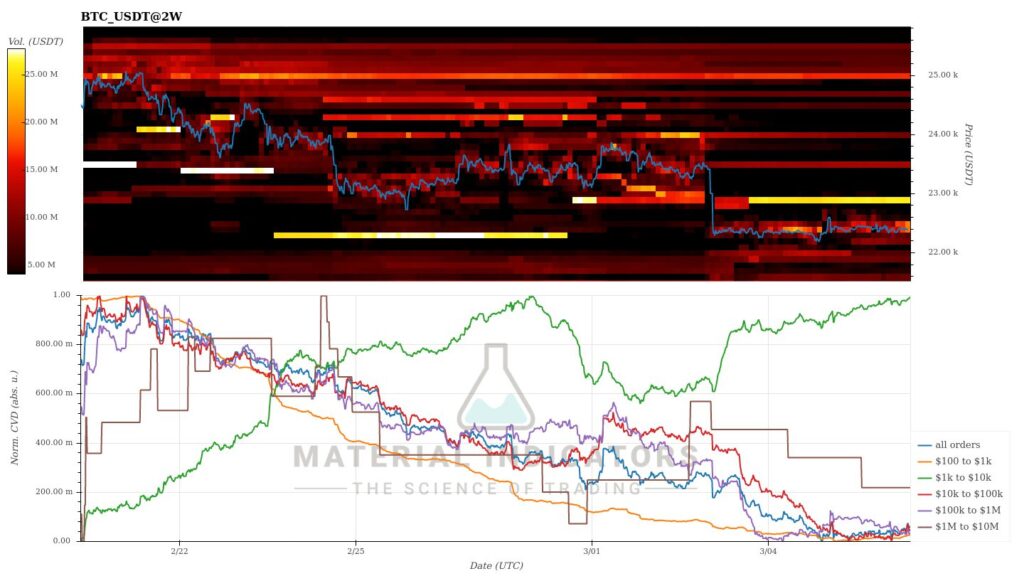
According to the Material Indicators heatmap, the main support area for bitcoin’s spot price is at $22 800, which bitcoin broke amid last week’s selling pressure. The volume strength of the support area is 25 million dollars. If the spot continues to go down, support will have to be sought from the lower $19-20K confluence zone. Even if the price of bitcoin continues to slide down, it will at the same time gather momentum for a new upward movement.
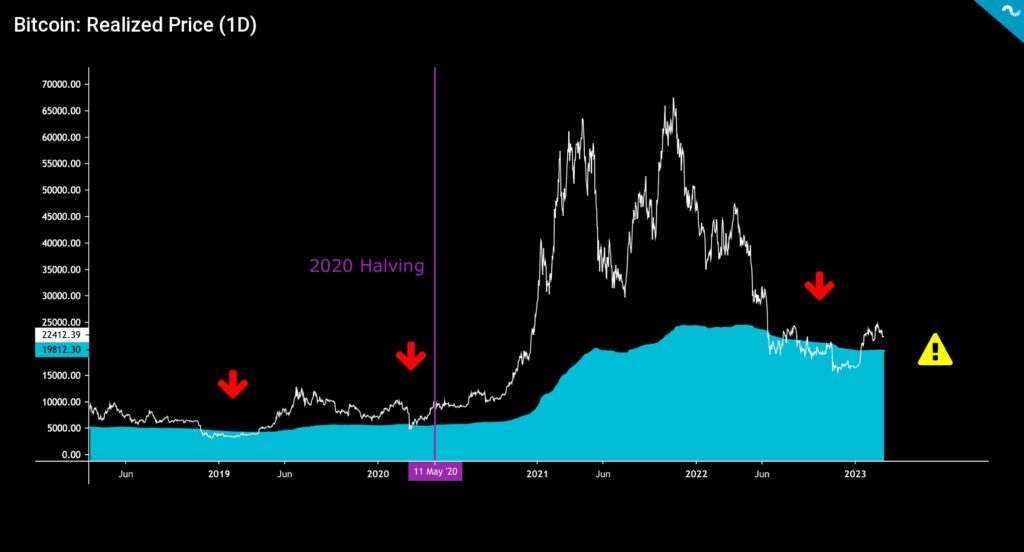
After a long bear cycle, the spot price of bitcoin has managed to stay above the realized price (turquoise) for a total of 53 days. The realized price now forms a critical zone for bitcoin. The realized price is an important indicator because it represents the average price of all bitcoin purchases.
At the same time, the realized price shows that average bitcoin buyers are making a profit on their investments. Additionally, historical data shows that the number of long-term bitcoin holders (LTH-SOPR) has increased when the spot price is above the realized price. Correspondingly, the number of short-term holders (STH-SOPR) has increased while the spot price is below the realized price.
Although the crypto market has continued to be down since last week, the declines in spot prices have still been relatively moderate. Bitcoin and Ethereum were down -5 percent on either side of the seven-day time window, highly correlated with each other. Surprisingly, the weekly performance of the higher beta Uniswap shows a round zero. The S&P 500 index is moderately positive and gold has strengthened by 1,3 percent from last week. The market mood is also confused by conflicting inflation data and the expectation of future interest rate decisions. Asian central banks counter Western central banks with their stimulus line.
7-Day Price Performance
Open Interest Going Negative
Bitcoin’s open interest (OI) has fallen to its most negative level this year, reflecting traders building short positions. However, the shorts can be interpreted as retail-oriented and bet heavily on a sharp market decline. Historically, the growing number of short positions in the retail segment has led to short-squeeze situations. If the FUD generated by Silvergate case decreases, the market may unexpectedly pop up, leaving many short positions in a trap.
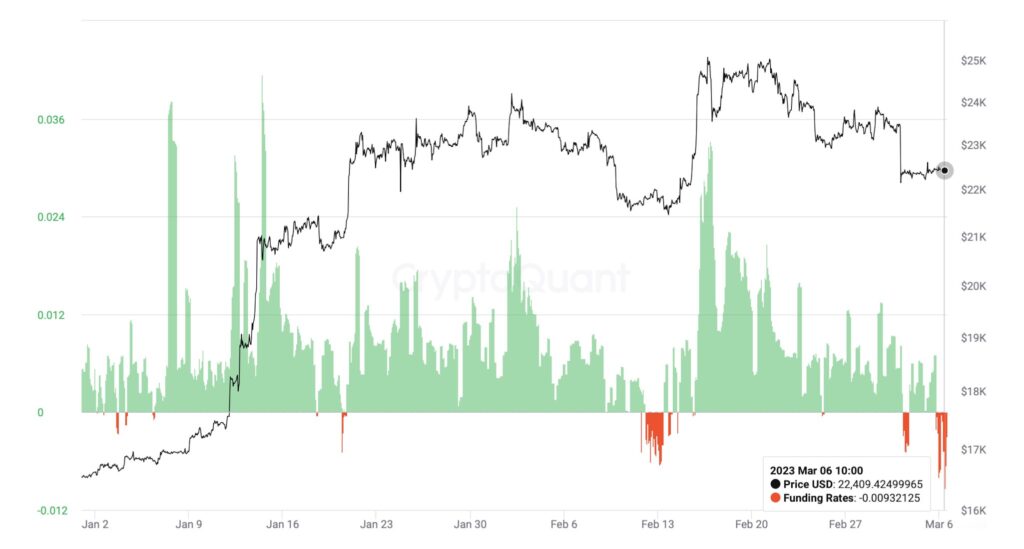
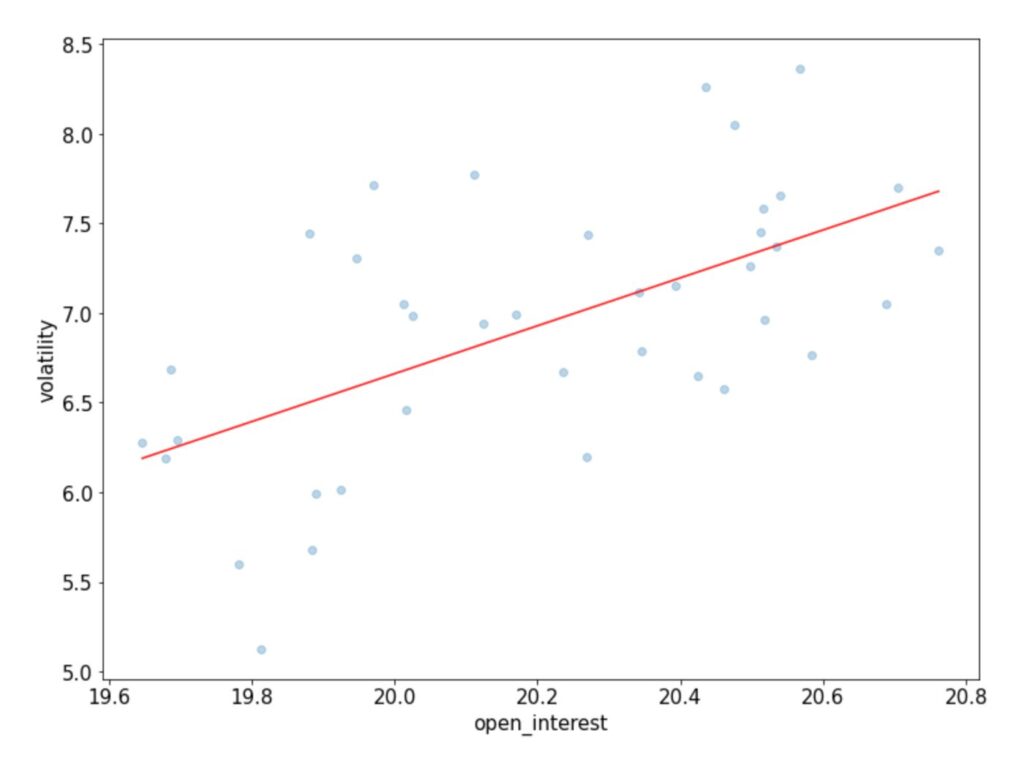
An increase in open interest is usually seen as reflecting rising liquidity. At the same time, growing OI means rising volatility and market attention, which supports the current price trend. The decreasing number of open interest, on the other hand, means exiting liquidity, and it can lead to long squeeze situations. CryptoQuant’s statistical analysis shows how bitcoin’s open interest (independent variable) has been positively correlated with volatility (response variable).
Will Bitcoin Repeat the Triple Bottom Structure?
After the brutally negative cycle of 2022, bitcoin has strengthened significantly during the first quarter (Q1) of 2023. Bitcoin’s spot price is still up 35 percent year to date (YTD), and the price action oscillates inside an ascending channel. Back in 2019, bitcoin’s spot price climbed from $3808 to $10 570 between January and July, representing a 178 percent increase. In the 2023 context, a 178 percent increase between January 1st and July 1st would effectively mean bitcoin surging from $16 607 to $46 092.
After the spot price projection, let’s use the 2018-2019 cycle for another model. Bitcoin’s on-chain active address data (30-day weighted moving average, 30WMA) generated three (3) individual bottoms (turquoise, left) as part of the 2018-2019 reversal process. The 2021-2023 cycle shows a similar structure (turquoise, right) as active addresses reached three individual lows as well.
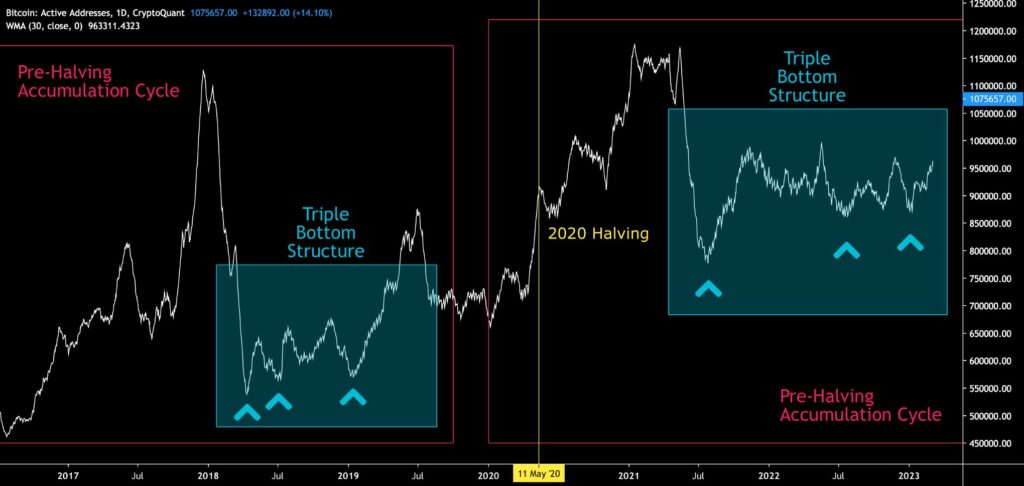
Praeterea, we can observe how the amount of active addresses already started to wane during the summer of 2021, effectively acting as a leading indicator to the spot price. Therefore the early 2021 price cycle was the de facto top, supported by fundamentals, while the November 2021 peak can be considered as “secondary”.
As a summary, if bitcoin follows the triple bottom structure of the last major cycle, we’re about to see incremental price increases across 2023. Bitcoin’s current “fair price” is at $43 598, closely aligned with our last price projection of $46 092. Bitcoin is now in a pre-halving accumulation cycle (red), looking towards 2024.
14 Days to FOMC
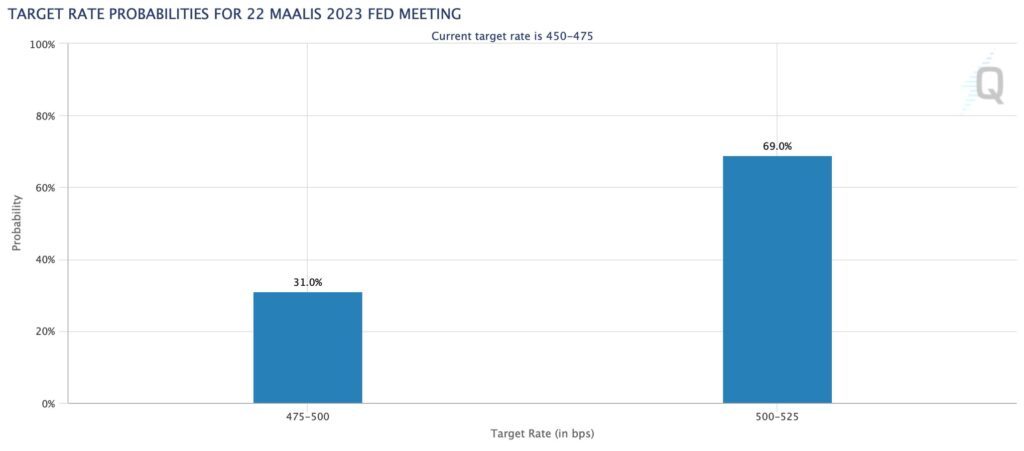
The central bank Fed’s FOMC meeting will be held again on March 23, i.e., in about two weeks. The market is now closely following the central banks’ liquidity situation and interest rate policy, as well as the inflation data that mainly guides them. Although inflation in the United States has been said to have subsided, core inflation in the euro area remains high. Regional differentiation can also be seen in the policies of the central banks, with the western ones pursuing a stricter policy, while the central banks of Asia have been favoring stimulus.
According to CME’s data, 69 percent of investors believe the Fed will end up raising interest rates by 50 basis points, while 31 percent of investors believe a 25 basis point increase is likely. The Fed’s rate hike line is clearly calming down, as previous rate hikes have been up to 75 basis points. The central bank still has the incentive to hold on to the increased interest rate as long as the inflation risk persists. The return of the zero interest rate cycle will therefore remain a dream for now.
Some US analysts, such as Luke Gromen, have long speculated that the Fed will turn its monetary policy from quantitative tightening to easing. However, the change of QT to the QE is just a projection for the time being. What is clear is that a sudden return to the QE line and an increase in liquidity would immediately strengthen the position of high-beta risk asset classes.
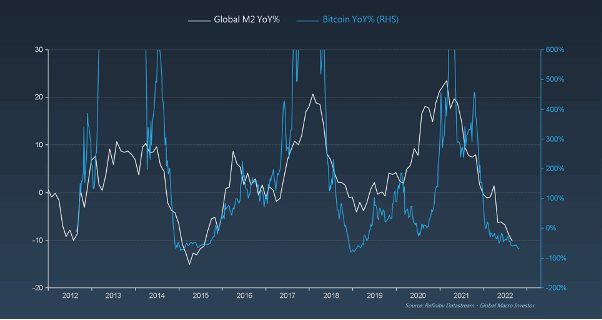
Investment strategist Raoul Pal previously analyzed cryptocurrencies and macro market prospects. Pal estimated that the central bank Fed is turning its hawkish monetary policy towards a dovish line in 2023. Pal sees the spot price of bitcoin as highly correlated with the M2 monetary aggregate (i.e., money supply). Bitcoin’s cyclical price development has historically risen as the money supply expands and fallen as it becomes scarcer.
What Are We Following Right Now?
Glassnode’s weekly report sees several blockchain indicators providing headwinds for bitcoin. Bitcoin’s fundamentals are still good, but the market is cautious on a psychological level. Glassnode also sees market-wide profit-taking and the realization of exit options.

Natalie Brunell and Jesse Myers discuss bitcoin’s theoretical path to the target price of $10 million per unit.

Macro gurus Alfonso Peccatiello and Andreas Steno Larsen explore the growing inflation risk.

Stay in the loop of the latest crypto events
- Aave launches native stablecoin GHO
- Technical Analysis: Bitcoin Trying to Break the $25K Key Resistance Level
- New Bitcoin NFTs spark discussion — What are Bitcoin Ordinals?
- The 2019 Scenario Indicates Bitcoin Reaching $46K
- Bitcoin marketplace LocalBitcoins is closing — here’s how to transfer funds to Coinmotion
- Bitcoin Resilient Amid the FUD Week
- EUROe stablecoin — First EU-regulated stablecoin launched in Finland | Interview with Juha Viitala
- Technical Analysis: Bitcoin in a New Market Cycle
- How did Norway become the largest Bitcoin mining hub in Europe?

The views, thoughts, and opinions expressed in the text belong to the author and not necessarily to the author’s employer, organization, committee, or other group or individual.