

The technical analysis of week 8 goes through bitcoin’s technical indicators and key resistance levels. In addition, we examine the correlation of bitcoin with the stock market and gold. Furthermore, we will go through why the realized price and the derived indicators show that the market bottom has been found.
Bitcoin as the Leading Indicator of the Crypto Market
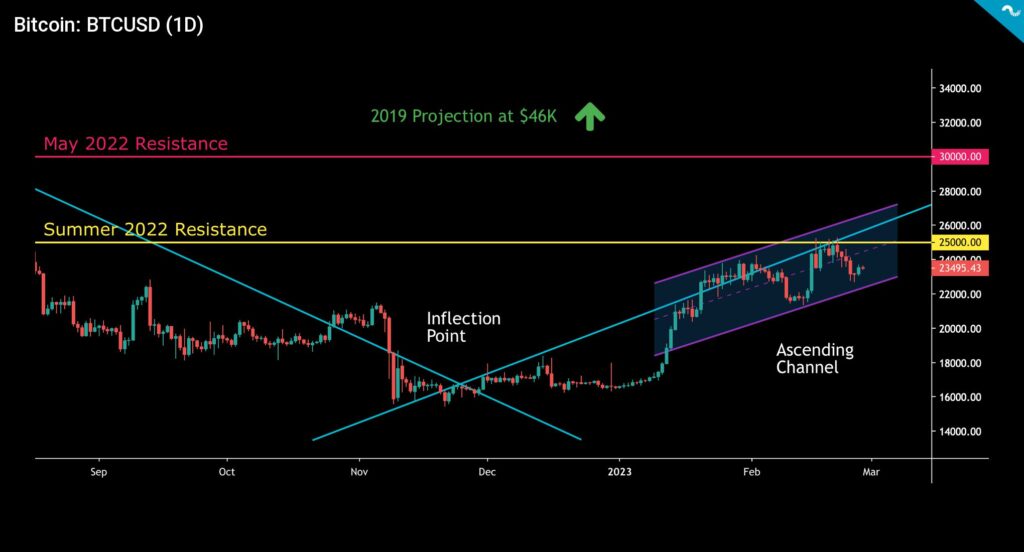
The price development of the crypto market has been subdued over the past seven days, with the leading cryptocurrency, bitcoin, still remaining in an ascending technical channel (purple). Bitcoin’s current spot price of $23K oscillates in a channel between $22K and $25K, aiming to break out of its resistance zone extending to the summer of 2022 (yellow). When Bitcoin manages to break through the yellow resistance zone, the next resistance will be at $30 000 (red). The 2019-based price projection presented in last week’s TA would seem to allow bitcoin to rise as high as $46 092.
On a technical level, bitcoin is supported by the inflection point of the descending and ascending trend lines (turquoise), which mirrors a major market reversal. In addition, the improvement in the global liquidity situation supports high-beta asset classes such as cryptocurrencies. According to Andreas Steno Larsen, the central banks of Asia are clearly on the recovery line and are injecting new money into the market. The Asian central banks are a huge contrast to the western central banks, which still practice quantitative tightening.
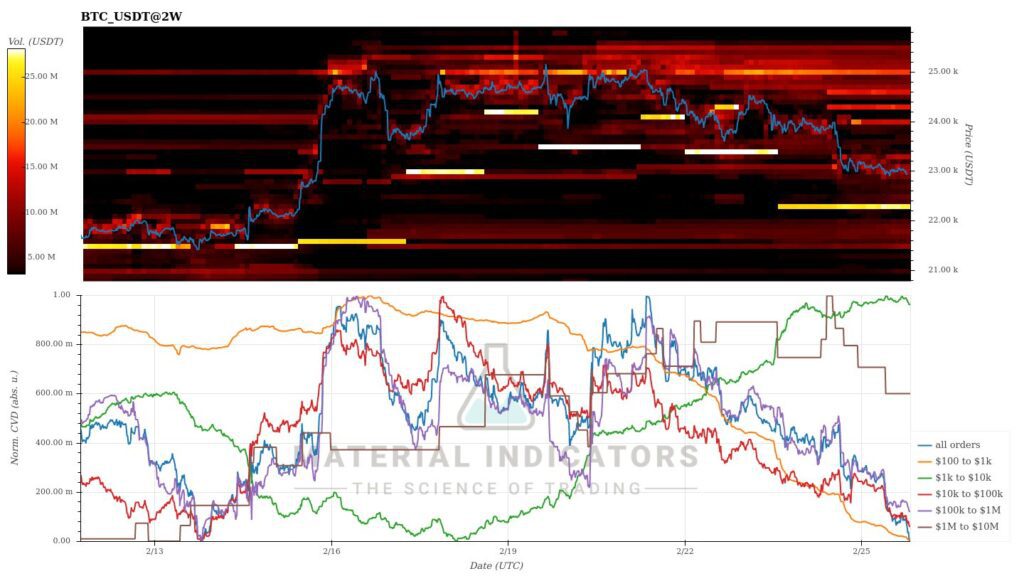
According to the Material Indicators heat map, the main support area for the spot price of bitcoin is at $22 200. The volume strength of the support area is 25 million dollars. If the $22,2K support area fragments, the next important confluence area is at the $20 000 level.
The sluggish price development of cryptocurrencies has mainly focused on altcoins, of which the Finnish-based decentralized loan platform Aave weakened by -14 percent. Other high-beta tokens also took a proportionally larger hit compared to high-cap tokens. The leading cryptocurrency, bitcoin still acts as a proxy for other currencies, and its correlation with Ethereum is remarkably high. Both the S&P 500 and gold both fell modestly over the seven-day window.
7-Day Price Performance
Bitcoin’s Correlation with the Stock Market and Gold in a Downtrend
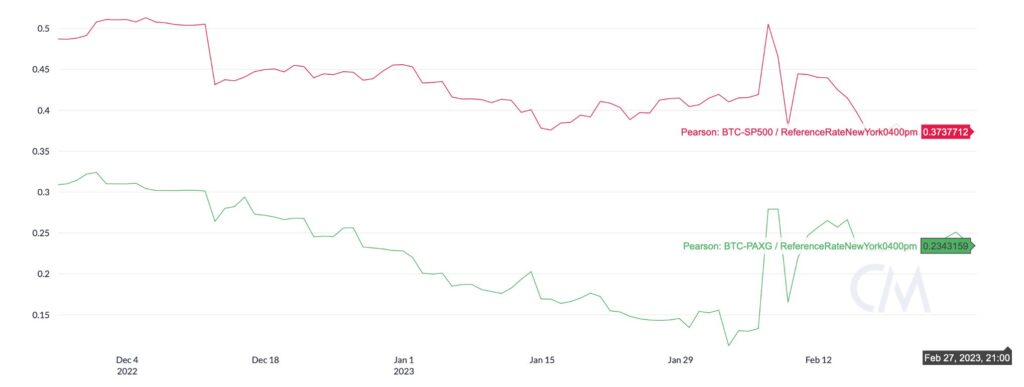
The leading cryptocurrency, bitcoin, was long considered an “uncorrelated” asset class with a non-existent dependence on other asset classes. This thesis was indeed true during the initial phase of cryptocurrency until 2020 when the correlation with the stock market rose radically. In the “Saylor cycle” of 2020, Bitcoin began to follow the trend of the stock market as it became mainstream. The increased correlation can also be considered a result of the maturing market and the extraordinary quantitative easing period during the COVID.
In the summer and fall of 2022, the 90-day Pearson correlation (red) between bitcoin and the stock market rose to extraordinary numbers, escalating to a peak of 0,64 in September. Since then, the correlation has been in a long downward trend, falling from over 0,5 at the end of the year to the current level of 0,37. Several well-known analysts are now waiting for the Fed’s pivot move, which would undoubtedly bring new momentum to the market. As the stock market possibly continues to strengthen, the correlation to bitcoin will remain strong, although a sovereign breakout of high-beta asset classes is always a possible scenario. Stock market correlation can be seen as protecting bitcoin yet providing an option to exit in bullish cycles.
The correlation between bitcoin and gold (green) follows the development curve between bitcoin and the stock market. The 90-day Pearson correlation between bitcoin and gold reached a peak of 0,52 in late 2022, from which it has slowly weakened towards spring. From November to the end of February, the correlation dropped by a whopping -56%. The scarcity characteristics of gold and bitcoin are close to each other, and bitcoin can be considered a high-beta version of gold. However, the development of gold has not been very favorable in recent years, and Michael Saylor has reminded us that bitcoin has risen by 86 percent since August 2020, while gold has weakened by -5% in the same timeline.
The Realized Price Indicators Look Promising
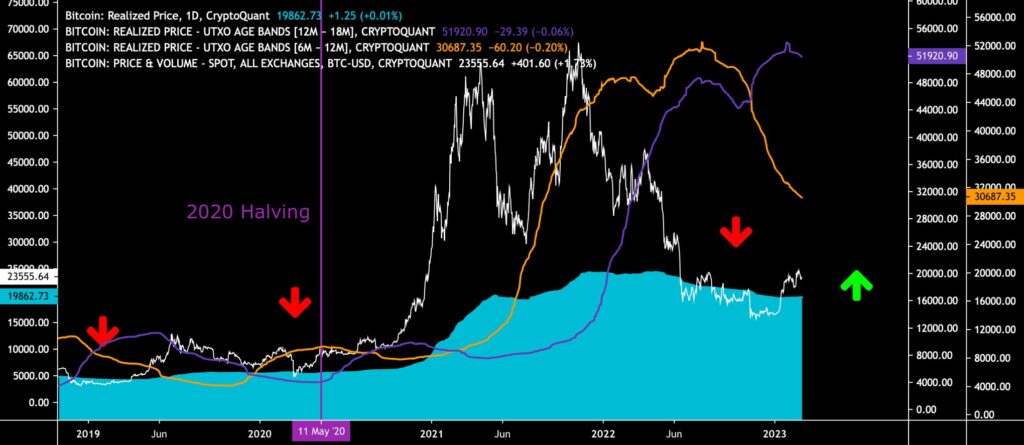
Since mid-January, bitcoin has remained above the realized price (turquoise) for a total of 45 days, and the market does not indicate a return below the line. The realized price is an important indicator because it represents the average price of all bitcoin purchases. At the same time, the realized price shows that average bitcoin buyers are making a profit on their investments.
Blockchain data shows how the 6M-12M (orange) and 12M-18M (purple) waves of the realized price crossed at the end of 2022. The crossing points of these two waves were also seen in the bear cycles of 2015 and 2019 when they indicated the reached market bottom. Compared to previous cycles, the current macro environment could still mean an extended sideways move for bitcoin.
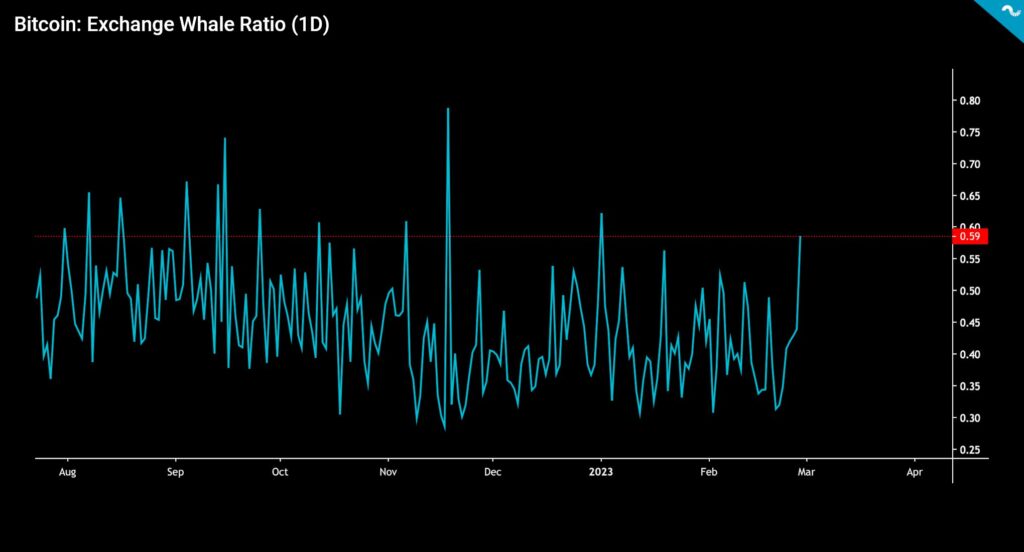
Whale Activity Rising
Whales generally refer to individuals or institutions that hold at least a thousand bitcoin units. The activities of whales are closely monitored, and whales operating on the Bitfinex exchange, in particular, have received special attention. CryptoQuant offers an indicator suitable for interpreting whale movements called the exchange whale ratio. The ratio divides the sum of the ten largest daily bitcoin transactions by the exchange’s inflow.
The stock market’s whale ratio rose to 0,59 at the end of February, the second-highest whale activity this year. Immediately after the turn of the year, the whale ratio climbed to 0,62. So what does the increase in the ratio indicate? Whales are good at anticipating market movements, and they protect their positions better than the retail segment. The last time the ratio was this high, the spot price of bitcoin climbed by 50 percent. If the 46 092 price projection presented in the last TA is correct, the whales may now be in accumulation mode.
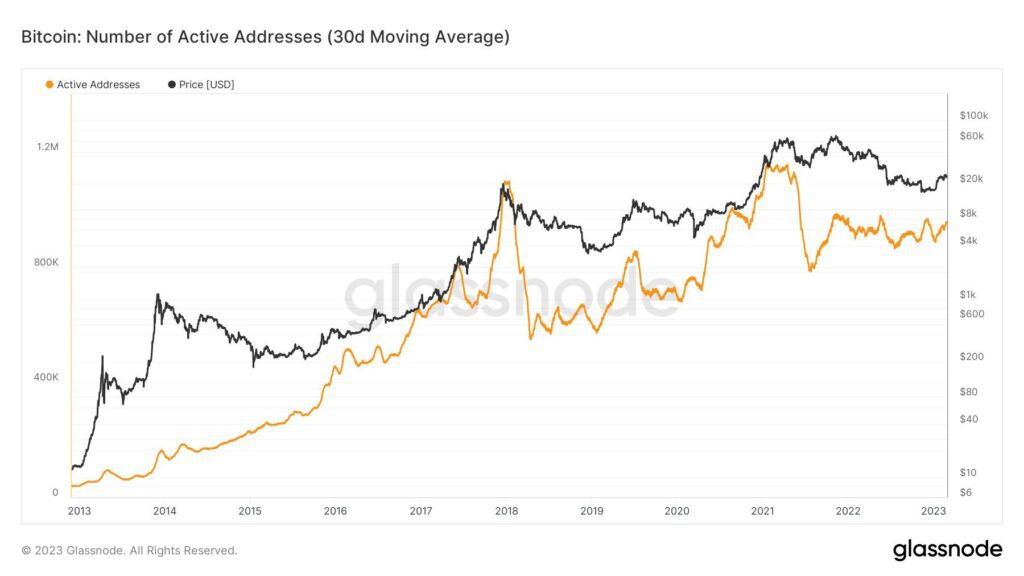
The Number of Active Addresses is Recovering
The number of active Bitcoin addresses reflects the market’s transaction volume. The increase in the number of active addresses has historically been a leading indicator and heralded an increase in spot prices. Similarly, the decrease in the number of active addresses has been correlated with bear markets. At the beginning of the year, the number of active addresses is recovering again to the level of the end of 2021.
Active addresses can be considered a leading indicator for the spot price of bitcoin, so they should be monitored closely. The recovery of the spot market will still require macro-level market changes. Nonetheless, the current technical structure of active addresses resembles the bear cycle of 2018-2019, after which bitcoin quickly recovered towards the summer 2019 bull cycle.
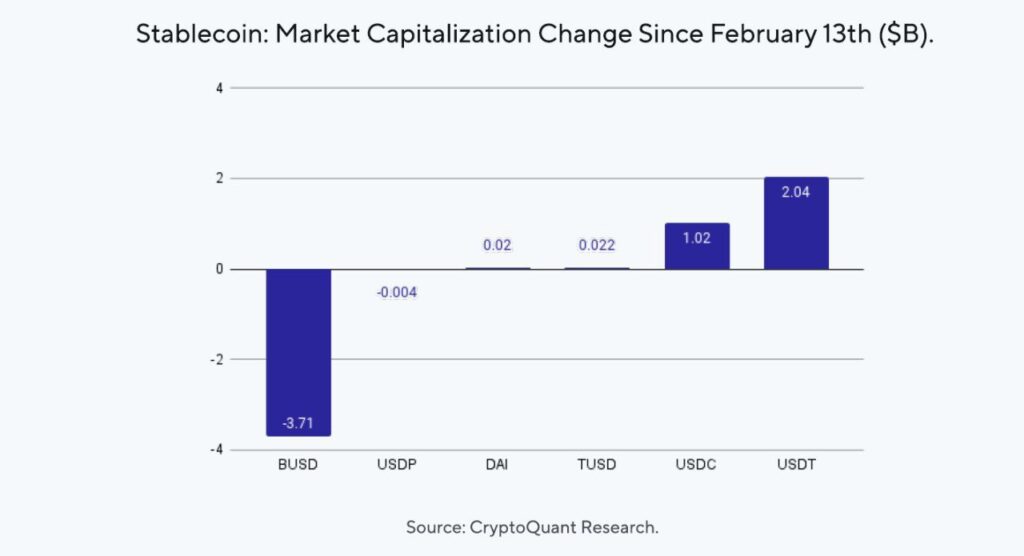
Binance BUSD and the Future of the Stablecoin Market
On Monday, February 13th, the US Securities and Exchange Commission SEC attacked the fintech company Paxos with exceptionally harsh words. Along with other stablecoins, Paxos has created a stablecoin called Binance Coin (BUSD) with the Binance exchange, which tracks the value of the dollar 1:1. According to Paxos, BUSD is 100% covered by cash reserves or government bonds (T-bill). Experts estimate that co-operation with the unregulated Binance was a suitable attack vector for the US Securities and Exchange Commission, which commented that Binance USD is an illegal security.
The actions of the SEC caused a clear panic movement in the market, and blockchain data reveals how huge amounts of BUSD currency were transferred to the Binance platform for conversion. Binance tried to calm the market by promising to replace the use of BUSD directly with other stablecoins. According to the latest data, the market value of Binance USD has decreased by -3,71 billion dollars in ten days, while the market value of USD Coin (USDC) has increased by about one billion and Tether (USDT) by about two billion dollars. Particularly the USD Coin, which is regulated in the US, will have a strong position in the stablecoin competition over long time horizon.
What Are We Following Right Now?
Wei Zhou, the founder of the largest crypto exchange in the Philippines, explains why Southeast Asia is one of the hottest digital asset markets right now.

Is the era of globalization over? Harald Malmgren and Nicholas Glinsman discuss politics, geopolitics and possible trade and investment restrictions on China.

According to on-chain researchers, the BNS exchange was apparently hacked in February 2022, but an attempt was made to cover up the incident.
Stay in the loop of the latest crypto events
- New Bitcoin NFTs spark discussion — What are Bitcoin Ordinals?
- The 2019 Scenario Indicates Bitcoin Reaching $46K
- Bitcoin marketplace LocalBitcoins is closing — here’s how to transfer funds to Coinmotion
- Bitcoin Resilient Amid the FUD Week
- EUROe stablecoin — First EU-regulated stablecoin launched in Finland | Interview with Juha Viitala
- Technical Analysis: Bitcoin in a New Market Cycle
- How did Norway become the largest Bitcoin mining hub in Europe?
- The Calm Before The Storm
- Top 10 cryptocurrencies by market cap
- Ripple v. SEC update & crypto lender Genesis goes bankrupt

The views, thoughts, and opinions expressed in the text belong to the author and not necessarily to the author’s employer, organization, committee, or other group or individual.