
Week 4’s technical analysis reviews recent events in the crypto market, focusing on, but not limited to, technical indicators. Bitcoin has tended to form weekend rallies in January, and its price structure is supported by the spot price crossing of the 50 and 200-day moving averages and their intersection. In addition to bitcoin, other high-beta risk asset classes are now on the rise. The leading cryptocurrency has managed to stay above its realized price, reducing the correlation with the stock market at the same time.
The crypto market once again reached a new weekend rally, after which we saw a moderate correction at the beginning of the week. Despite the turbulent market, the leading cryptocurrency, bitcoin, has risen by 37 percent during 2023. This week coincides with the interest rate decisions of three different central banks, which proceed in the following order:
Wednesday 1.2: FOMC, Fed’s interest rate decision
Thursday 2.2: Bank of England’s (BoE) interest rate decision
Thursday 2.2: European Central Bank’s (ECB) interest rate decision
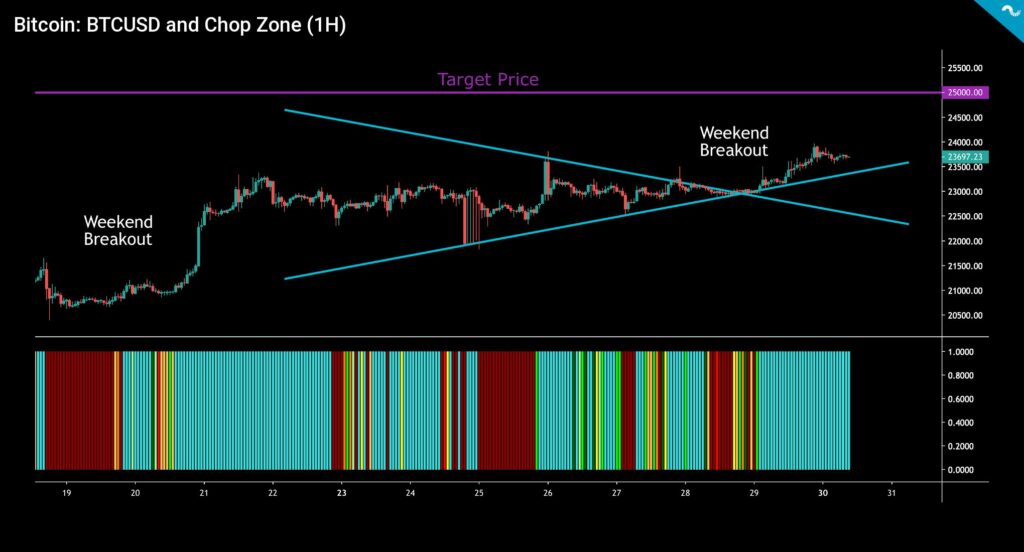
In January 2023, bitcoin developed a tendency to rise during weekends (weekend breakout). At the same time, the spot price has managed to break out of its January technical wedge (turquoise), and the chop zone indicator gives room for future price jumps. The short-term target price for Bitcoin is $25 000 (purple), and the longer-term target price can be set at $40 000.
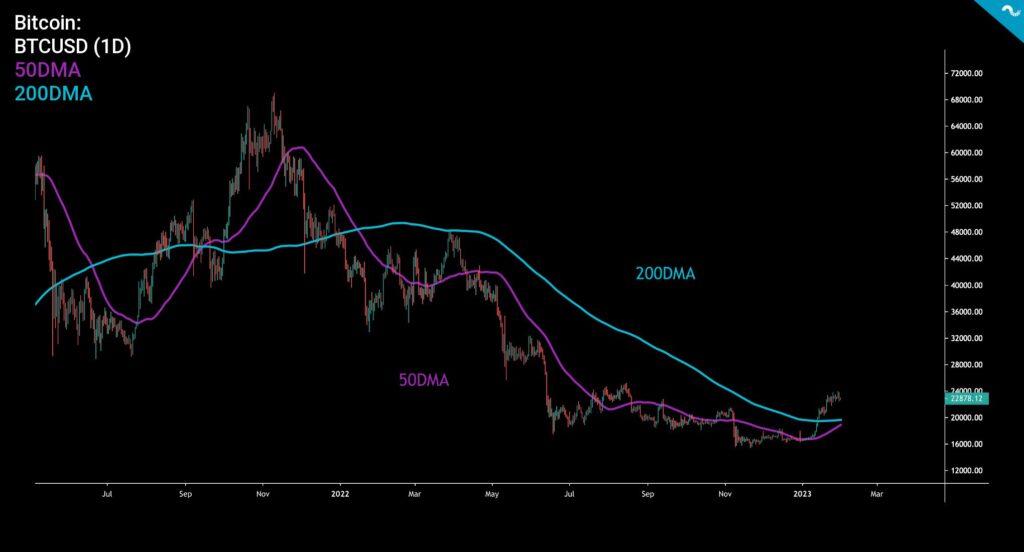
Beyond the technical wedge, bitcoin’s 50 (purple) and 200 (turquoise) day moving averages form a promising setup. First, the spot price of bitcoin has risen above both moving averages during January, which in itself is a positive signal. In addition, the 50-day moving average is crossing the 200-day moving average, forming a golden cross setup.
A death cross means a situation where the 50-day moving average (50DMA) falls below the 200-day moving average (200DMA), while a golden cross is the opposite of this setup: a golden cross means a 200-day average above the 50-day average. The Death cross is naturally a negative indicator, while the golden cross is a positive one.
↑ Golden cross: 50DMA moves above 200DMA
↓ Death cross: 50DMA moves below 200DMA
Bitcoin is generally considered to be an indicator of global liquidity, and the current rise of the spot price indicates an improvement in the liquidity situation. Even though the central bank Fed has not yet actually changed its interest rate line, the market estimates the rate to be close to the peak and is already starting to price in the shift. Raoul Pal previously estimated that the central bank Fed is turning its hawkish monetary policy towards a dovish line. Quantitative tightening (QT) would therefore be replaced by quantitative easing (QE). Pal sees the spot price of bitcoin as highly correlated with the M2 monetary aggregate (i.e., money supply).
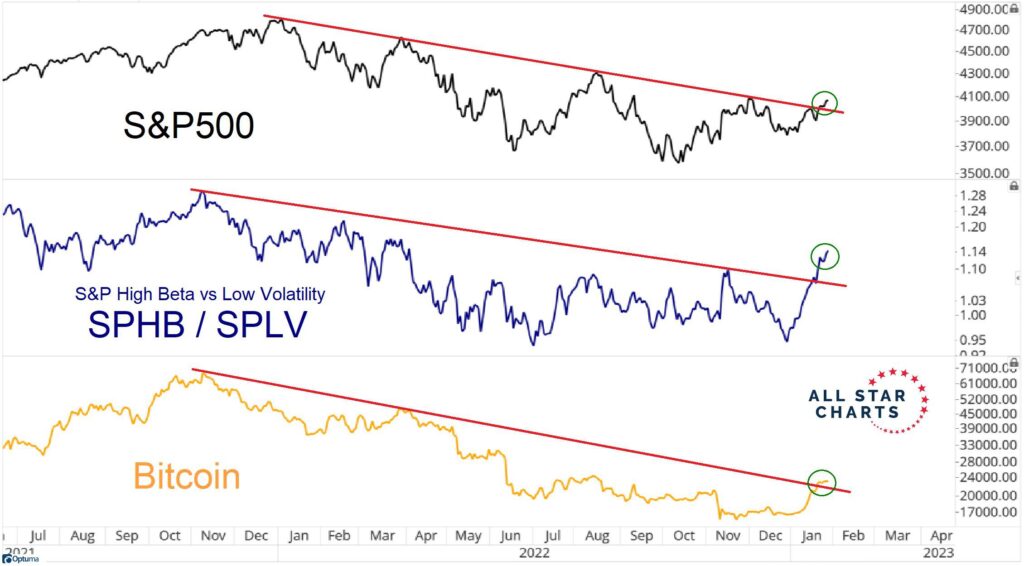
Bitcoin’s cyclical price development has risen as the amount of money has expanded and fallen as the supply has become scarcer. If central bank policy returns to the stimulus line, the expanding supply will find its way into high-beta assets such as bitcoin. Bitcoin’s price increase (orange) has been correlated with the S&P 500 index and especially with high-beta stocks (blue). Clear signs of recovery can be seen in the macro environment, e.g., in the forms of weakening inflation, the opening of China, and the decrease of the dollar index.
After the wild upswing weeks in January, the crypto market is now facing a breather, during which the prices mostly move sideways. The leading cryptocurrency Bitcoin has weakened by a modest -0,4 percent and Ethereum by -3,5 percent in the week’s time window. In Coinmotion’s répertoire, only Litecoin has reached positive weekly growth, rising almost 5 percent. Litecoin will be boosted by its upcoming halving event next summer, which investors are already pricing in. At the same time, the stock index S&P 500 and gold have mostly moved sideways.
Seven-Day Price Performance
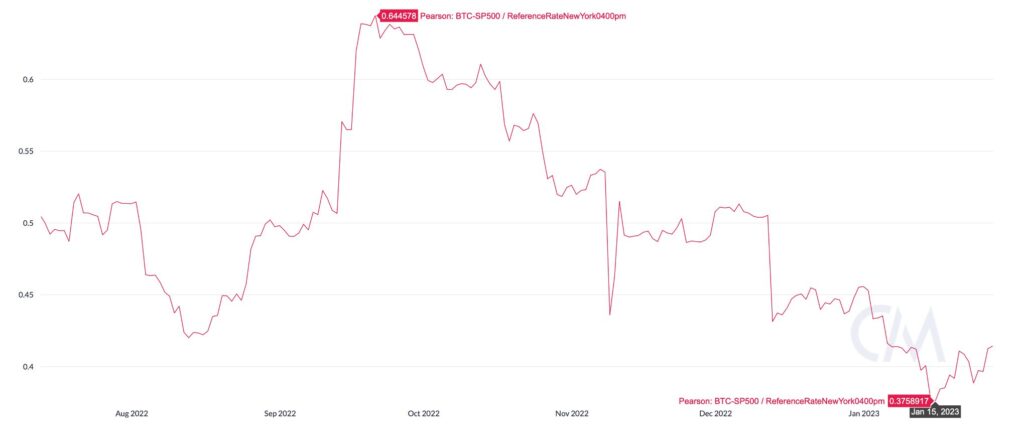
Bitcoin’s Correlation to S&P in Deep Decline
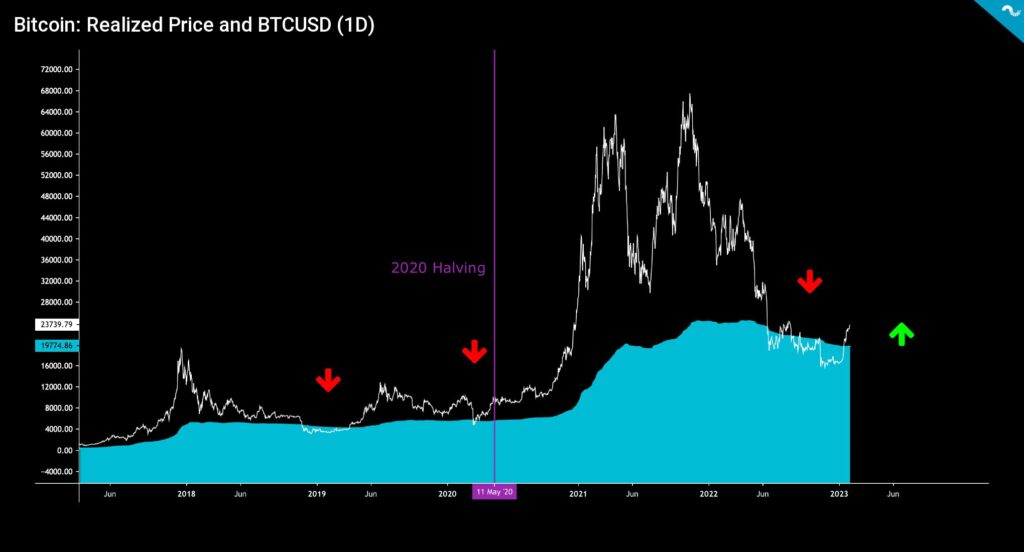
Uplifted by the weekend rallies, bitcoin (white) has now remained above the realized price (turquoise) for two weeks already. The realized price is an important indicator because it represents the average price of all bitcoin purchases. At the same time, the realized price illustrates that the average bitcoin buyers are now making a profit on their investments. In 2022, the spot price of bitcoin fell below the realized price from June until well into the end of the year. If we do not consider local increases above the realized price, the spot was oversold for six months.
From the realized price point of view, the 2022 bear cycle exceeded the 2018-2019 bear market in length, where the spot price fell below the realized price for 133 days. The realized price served as a resistance level for the spot price for a long time, but now it has become a support level again.
Data from Coin Metrics shows how the correlation between bitcoin and the stock market is still in a downward trend. At the beginning of the fourth quarter of 2022, the 90-day Pearson correlation between the leading cryptocurrency and the S&P 500 index was at 0,64, but it weakened to 0,38 by mid-January. The correlation has thus weakened by -41 percent in a short time, which is a significant change.
The essential question is, do we want bitcoin to break away from the correlation of the stock market at all? Several well-known analysts are now waiting for the Fed’s pivot move, which would undoubtedly bring new momentum to the market. As the stock market possibly continues to strengthen, the correlation to bitcoin will remain strong, although a sovereign breakout of high-beta asset classes is always a possible scenario. Stock market correlation can be seen as protecting bitcoin yet providing an option to exit in bullish cycles.
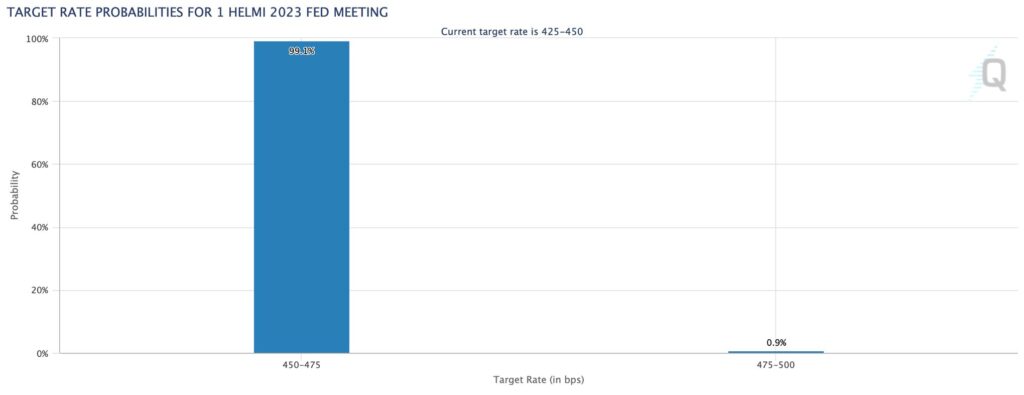
Focus on Wednesday’s FOMC
The Fed will hold its first FOMC meeting of 2023 on Wednesday, and investors will once again try to price in the future interest rate line. According to CME data, the market is rarely unanimous about the outcome of the meeting, with 99 of the investors believing that the interest rate hike will remain at 25 basis points. Correspondingly, only one percent of investors believe in a 50 basis point interest rate hike. In the background lies the rare possibility of a zero basis point hike, which the market has not priced in.
The Fed’s monetary policy unexpectedly tightened last year when the central bank tried to counteract the rapidly worsening inflation situation. Since then, the Fed’s rhetoric has eased, and the direction may be from quantitative tightening (QT) to quantitative easing (QE). Among others, experts Nikolaos Panigirtzoglou (JPMorgan) and Luke Gromen have estimated that the Fed will return to the QE sooner than expected.
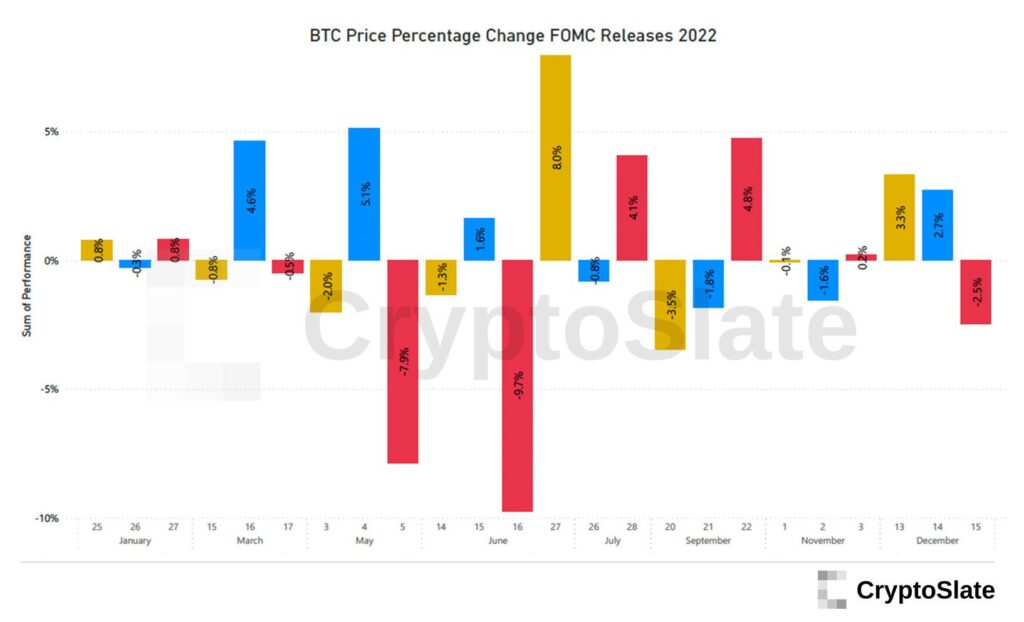
The 2022 data collected by CryptoSlate shows how the FOMC meetings were negatively weighted for bitcoin, although some exceptions were also seen. The biggest FOMC drop of 2022 was seen on June 16th, when the price of bitcoin weakened by -9,7 percent. However, after the following June FOMC meeting, bitcoin saw an 8% increase. When studying the chart, it is good to remember that 2022 was dominated by a deep bear cycle.
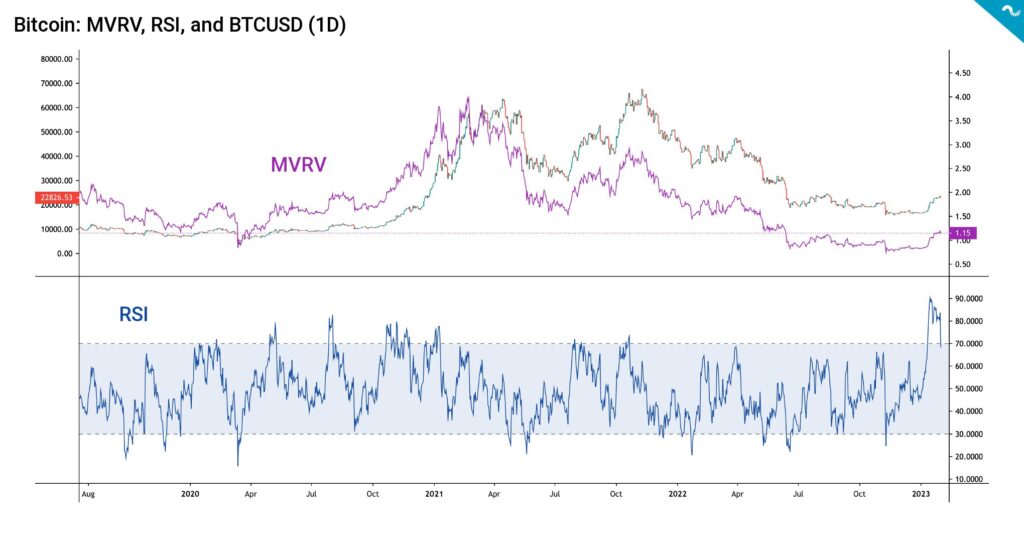
MVRV Indicator Hits A Seven Month High
The MVRV indicator, which compares bitcoin’s market capitalization and realized capitalization, reached a level of 1,15 this week, which is the highest reading since June 2022. MVRV almost invariably stayed below one from the summer 2022 to the end of the year, reflecting bitcoin’s deep undervaluation. Experts consider MVRV zones of below one as accumulation areas.
The MVRV indicator is calculated by dividing the market capitalization of bitcoin by the realized capitalization and was developed by David Puell and Murad Mahmudov in 2018. The Puell Multiple, which is also involved in technical analyses, is named after David Puell. Bitcoin is considered overvalued when MVRV exceeds 3,7, and correspondingly, MVRV indicates bitcoin undervaluation when it falls below 1.
What Are We Following Right Now?
Natalie Brunell and analyst Lyn Alden discuss macroeconomics, liquidity, monetary policy and, of course, Bitcoin.

Alfonso Peccatiello and Andreas Steno Larsen evaluate the rise of liquidity. Does the rally in risk stocks indicate the return of quantitative easing (QE)?

The demand for Bitcoin has grown enormously in Nigeria, and in the P2P market the unit price has in places doubled compared to the general market price.
Stay in the loop of the latest crypto events
- Top 10 cryptocurrencies by market cap
- Technical Analysis: Will The FOMO Rally Continue?
- Ripple v. SEC update & crypto lender Genesis goes bankrupt
- Inflation is slowing & the crypto market is rising
- Technical Analysis: The Positive Momentum Continues
- NFT market value increased by 11,000 percent in 2020-2022
- Bitcoin’s Price Predictions for 2023
- Accepting crypto donations for your charity or non-profit organization

The views, thoughts, and opinions expressed in the text belong to the author and not necessarily to the author’s employer, organization, committee, or other group or individual.