

The technical analysis of week 3 evaluates the sustainability of the recent rally from a technical point of view. We also analyze bitcoin’s fair value and early-year performance compared to other asset classes. Additionally, we examine Bitcoin’s blockchain data and the halving cycle schedule.
Bitcoin About to Paint The Third Green Weekly Candle
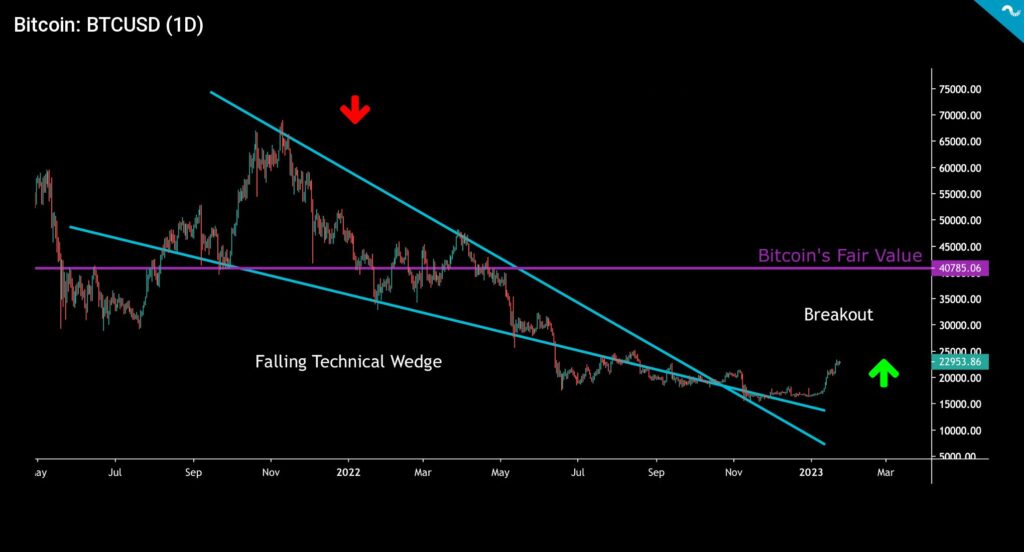
The crypto market continues to gather more upward momentum, with bitcoin already drawing the third green weekly candle of January. The leading cryptocurrency is currently up 38,31 percent year-to-date (YTD). Bitcoin recently broke its technical falling wedge structure (turquoise) that lasted more than a year, with the top end located at the November 2021 price peak. At the same time, the strengthening of the crypto market has increased the combined market capitalization of digital asset classes to more than a trillion dollars.
In addition to bitcoin, momentum has given rise to many speculative tokens. The fresh and somewhat controversial smart contract platform Aptos (APT) has strengthened by more than 63 percent in seven days. Aptos is not listed on Coinmotion’s platform; however, it can be purchased via our OTC service.
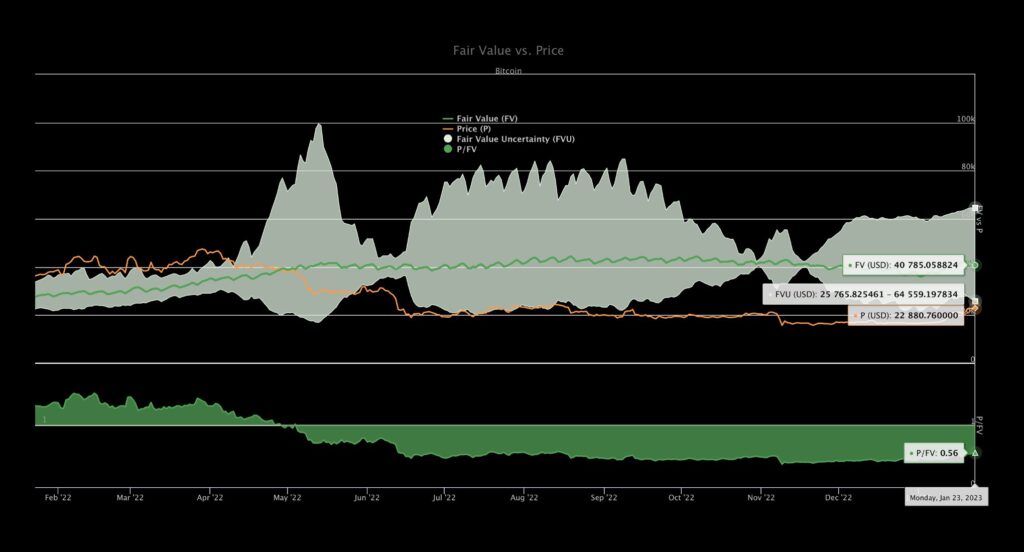
According to the CoinFairValue page, the calculated fair price of bitcoin is $40 785,06, which is 77,68 percent higher than the current price.
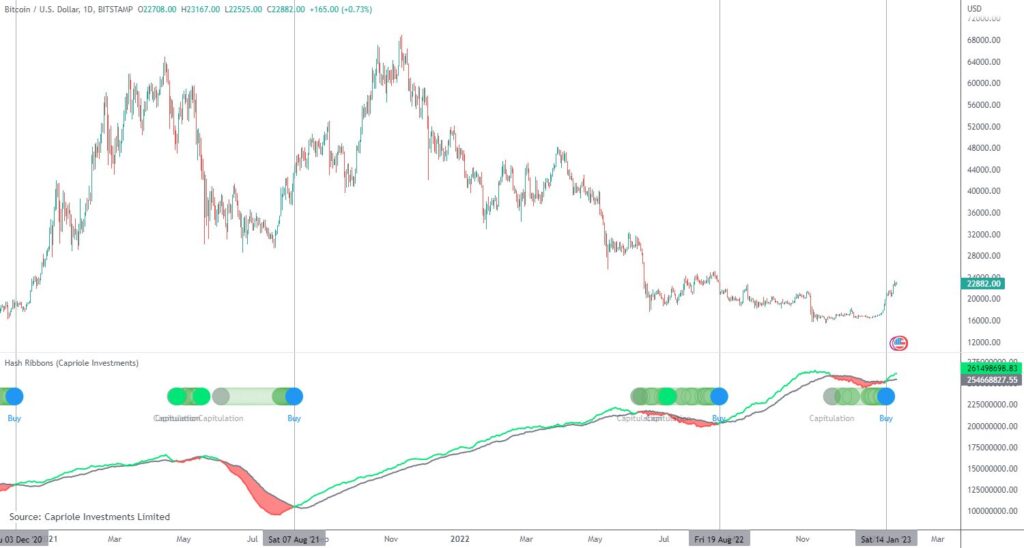
According to Charles Edwards, founder of Capriole Investments, bitcoin’s hash bands are meeting again, triggering a clear buy signal (blue). Edwards has previously estimated that miners have reached their capitulation point, reducing selling pressure considerably.
Last December, Edwards estimates that inflation reached its peak and the market environment will, therefore, gradually ease. According to him, the inflection point of the market will surprise investors. Bitcoin and other high-beta risk assets have faced an exceptionally challenging macro environment over the past year. However, many experts expect the central bank Fed again to turn its interest rate policy in a dovish direction.
The crypto market is still on the upswing, but the momentum has slowed since last week. Bitcoin is now up 8 percent over a seven-day time window after accumulating a 23,5% gain last week. The rise in Ethereum’s spot price has subsided to 2,4%, compared to the previous week’s reading of 19,4%. Decentralized loan platform Aave has risen 5,5 percent in seven days, strengthening by 38,5 percent in two weeks. Many speculative tokens, such as the previously mentioned Aptos, have offered notable returns to those seeking higher-risk exposure.
7-Day Price Performance
Bitcoin Has Been The Hottest Asset of Early 2023
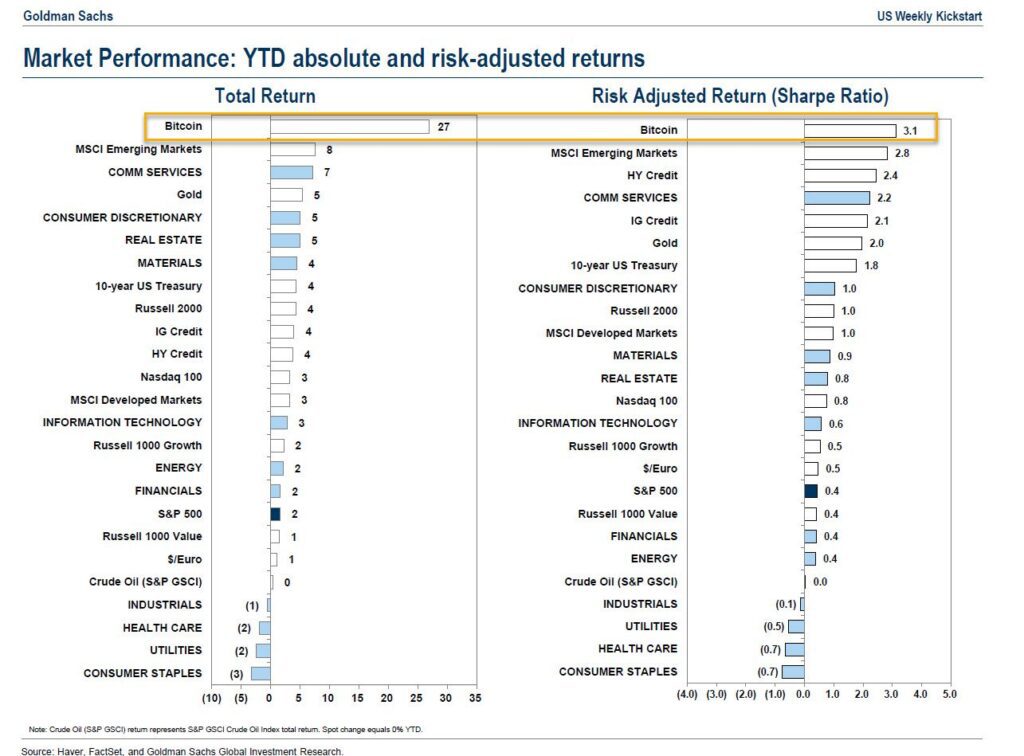
In its latest report, the investment bank Goldman Sachs evaluates the performance of different asset classes in early 2023. The company puts bitcoin on the pedestal as the most successful asset, which had strengthened by 27 percent at the time of the report’s publication. Bitcoin’s Sharpe ratio has also been in a class of its own, rising to 3,1. Additionally, emerging markets (MSCI Emerging Markets) were also successful at the beginning of the year, gaining 8 percent. Gold, which mirrors the scarcity characteristics of Bitcoin, has risen five percent since the turn of the year.
The relatively weak early-year performance of the stock indices Nasdaq 100 (3%) and S&P 500 (2%) is noteworthy. There was a clear convergence between Bitcoin and technology stocks last year, which the leading cryptocurrency is now trying to break away from. The increasing divergence to the stock market is mirrored by the weakening 90-day Pearson correlation between bitcoin and the S&P 500 index, which fell to 0,38 on January 15. Such a low correlation to the stock market has not been seen since the spring of 2022.
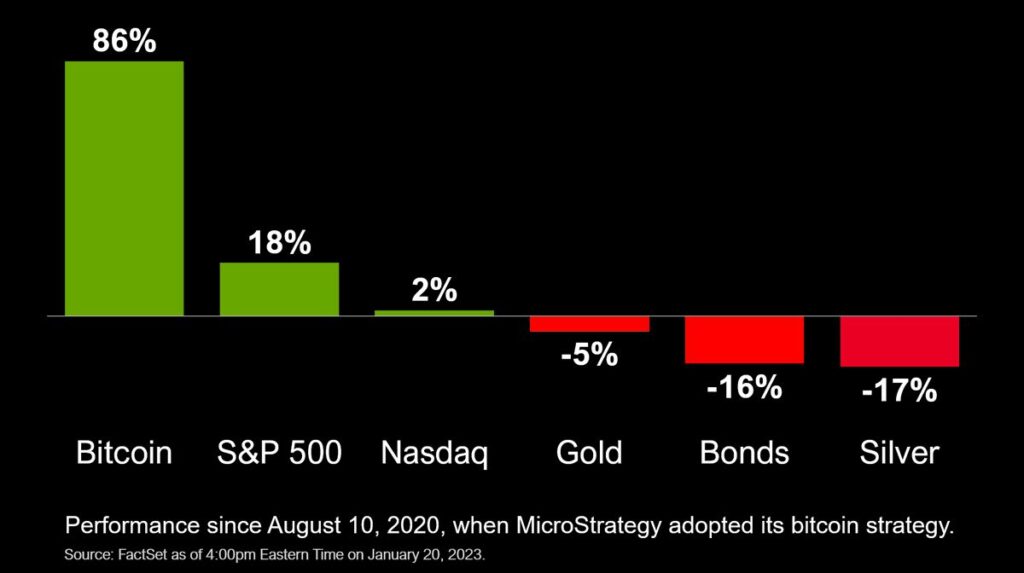
Michael Saylor, a Bitcoin influencer known for his company MicroStrategy, once again justified the profitability of his company’s Bitcoin thesis. According to Saylor, Bitcoin is up 86 percent since August 10, 2020, when MicroStrategy moved to replace its cash holdings with alternative asset classes. Saylor points out that in the same time window, the leading stock index S&P 500, has only increased by 18 percent and the Nasdaq 100 by two percent. Gold has weakened by -5% since the beginning of autumn 2020.
Fed’s FOMC Meeting Around The Corner Again
The Fed will hold its FOMC meeting again next week, on February 1st. The central bank has long been speculated to be changing its exceptionally hawkish interest rate policy, which has been criticized by both public and private actors. At the end of 2022, e.g., The United Nations (UN) and ARK Invest’s Cathie Wood criticized the speed and high level of the Fed’s rate hikes in late 2022.
Analyst Luke Gromen has long speculated that the Fed will be forced to move back towards a dovish monetary policy and quantitative easing. Gromen calls the upcoming turning point a “pivot”. In his latest comments, JPMorgan chief strategist Nikolaos Panigirtzoglou predicts a faster end to the QT cycle than estimated:
“In our baseline projection reserve scarcity should be more of an question for 2024 rather than this year. That said, the risk around this base case is that reverse repo balances prove more persistent in which case reserve scarcity could become an issue as soon as this year. In this risk scenario, the Fed might face trade-offs between reserve scarcity and unintended effects from pushing the overnight reverse repo balances lower through changes to the conditions of the facility, which could induce an early end to QT.”
– Nikolaos Panigirtzoglou
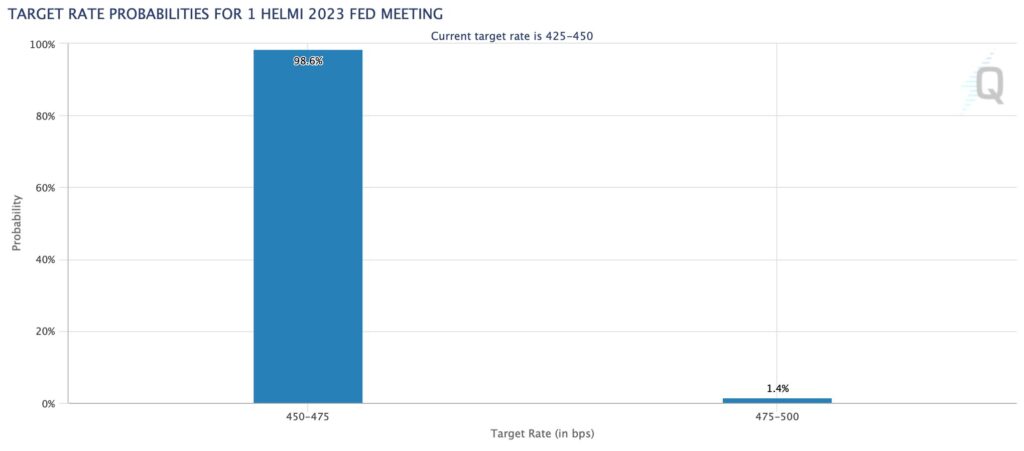
CME’s data indicates that the interest rate hike at the beginning of February will remain at 25 basis points with a probability of up to 98,6 percent. An increase of 25 basis points would definitely reflect the gradual easing of the interest rate policy. The real wild card is still the possible (but unlikely) 0 basis point increase in the background, which the market has not priced in.
On-Chain Data Supports Further Price Advances
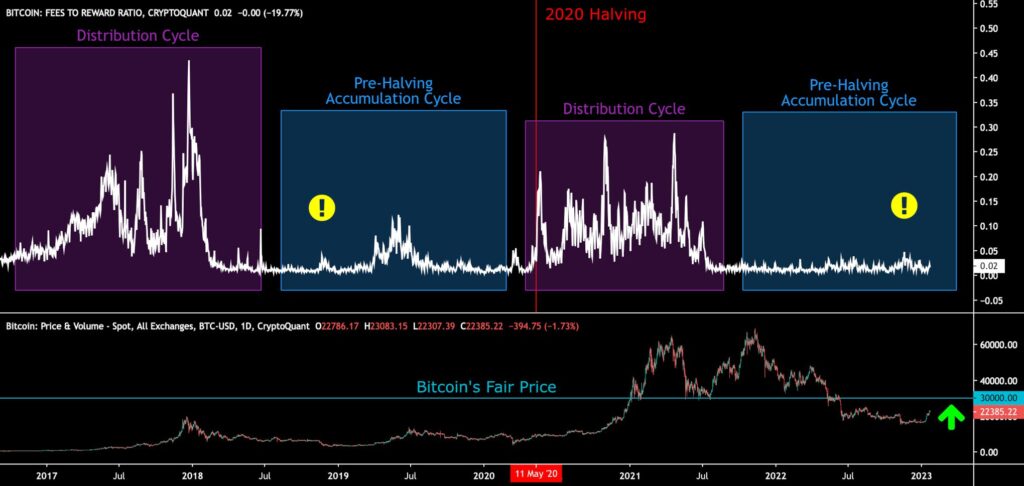
Bitcoin’s spot price has strengthened by 38 percent in early 2023, mirroring an exceptionally promising start for the year. The market behavior can be segmented into distribution (violet) and accumulation (blue) phases, which form a sequence of cycles. Accumulation cycles have been favored by smart money (institutions), while distribution cycles have been characterized by retail demand. Bitcoin’s history is also dominated by halving events, which are preceded by pre-halving accumulation cycles (blue).
The shift from accumulation to distribution cycle can be forecasted by fees to reward on-chain data (white), which has a tendency to spike before each distribution cycle. The phenomenon recently occurred in 2019 and 2020. In the pre-halving accumulation cycle of 2019, the fees-to-reward ratio spiked before the summer relief rally (yellow), rising to 0,12. In 2020, the fees to reward ratio spiked again, first reaching 0,21 in May and later 0,29 in November. Now the fees to reward indicator seems to be moderately spiking again (yellow). The spiking of the indicator will further support bitcoin’s prospects.
The Next Halving Looms In The Horizon
As the previous chart shows, Bitcoin is clearly in an accumulation cycle, having passed the distribution cycle in the 2021 double-top structure. If the parabolic price development of the end of 2020 and the beginning of 2021 is ignored, Bitcoin is still in a linear uptrend from 2020. The market is already starting to price the future halving event into bitcoin’s price, forming a pre-halving accumulation cycle.
The estimated date for the halving event is March 28, 2024, so it is 428 days away at the time of writing. The selling pressure on Bitcoin is clearly weakening, and at the same time, there are a large number of unprotected short positions in the market. The price rally at the beginning of January caused a short-squeeze situation.
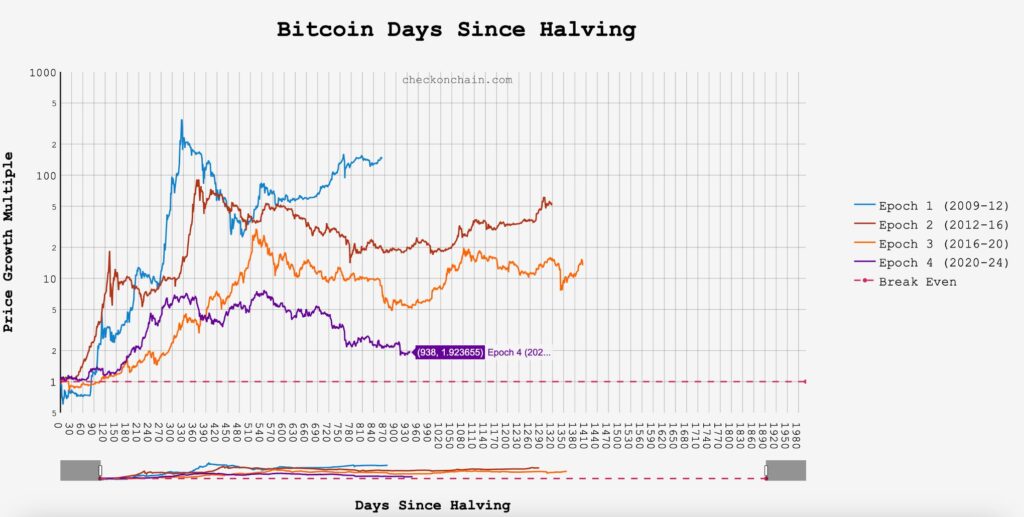
Bitcoin’s next halving will happen in block 840 000 and will reduce the block reward from 6,25 to 3,125. In the previous halving cycle, the spot price of bitcoin increased by 1263 percent between 2016 and 2020. If the same trend continues, bitcoin will reach the level of 100 000 euros in 2024. The chart on the _checkonchain page shows how bitcoin is about halfway through its current halving cycle (purple). In previous years, the recovery of the spot price started around this time.
What Are We Following Right Now?
Trader and analyst Gareth Soloway explains his views on the direction of the market, emphasizing the usual technical point of view.

Andreas Steno Larsen, Alfonso Peccatiello, and Steve Drobny discuss the state of the macro market and potentially rising volatility.

Glassnode’s in-depth blockchain analysis considers whether the recent price rally is a threat or an opportunity.

Stay in the loop of the latest crypto events
- Ripple v. SEC update & crypto lender Genesis goes bankrupt
- Inflation is slowing & the crypto market is rising
- Technical Analysis: The Positive Momentum Continues
- NFT market value increased by 11,000 percent in 2020-2022
- Bitcoin’s Price Predictions for 2023

The views, thoughts, and opinions expressed in the text belong to the author and not necessarily to the author’s employer, organization, committee, or other group or individual.