The technical analysis of week 2 maps the continuous positive momentum and feelings of euphoria in the market. Bitcoin’s spot price has risen above the realized price, and the market cap has passed the realized cap indicator. At the same time, UTXO data shows that smart money is in accumulation mode. Is the current relief rally sustainable?
Market in Euphoric Mood After The Relief Rally
The crypto market received a significant boost over the weekend when a wave of new liquidity sent the leading cryptocurrency, bitcoin soaring by tens of percent. Bitcoin is currently up nearly 24 percent over a seven-day window, while the DeFi token ether is up 19%. Many speculative tokens have strengthened in recent weeks, with Ethereum’s rival Avalanche (AVAX) surging nearly 40% after AWS collaboration news.
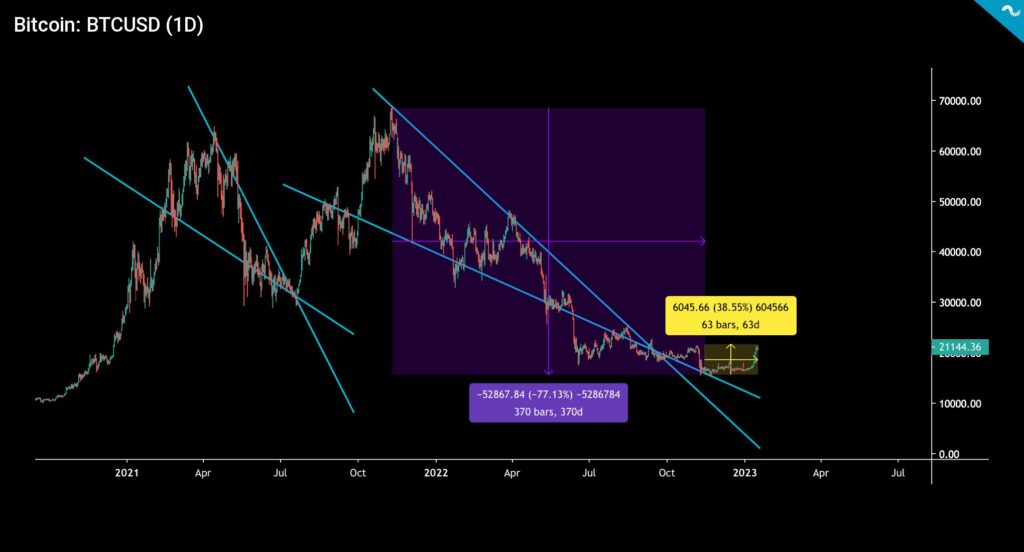
Many may consider the strengthening of the crypto market an anomaly or a relief rally, but the possibility of a real paradigm shift has definitely increased. After being in a bear cycle for over a year and falling -77 percent (purple), bitcoin has found 39 percent of positive momentum (yellow) in two months. The crypto market is also supported by macro factors that indicate decreasing inflation, the possible return of the quantitative easing, and further weakening of the dollar index.
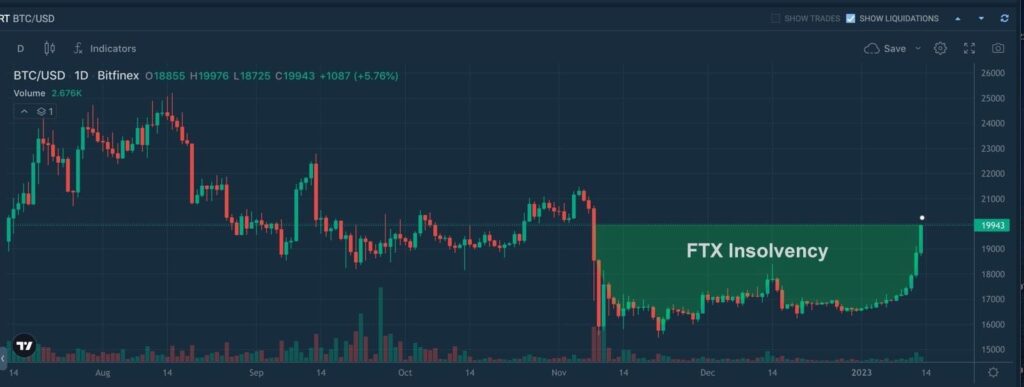
Adam Back’s chart shows that bitcoin’s drop to the $16K zone can be considered a temporary phenomenon generated by the FTX crisis. In Back’s words: “Below 20K was nonsense”. The famous analyst and trader Tone Vays believes that an extended bitcoin price rally is still possible. In the latest update, Vays increased his 20 percent bitcoin allocation to 40 percent.
The upward momentum of bitcoin and ethereum has also caught on with other cryptocurrencies. Aave, found in the repertoire of Coinmotion exchange, has risen a whopping 41,9 percent in a week. At the same time, Chainlink and Uniswap have strengthened by more than 10%. The leading stock index S&P 500 is up two percent from last week, and gold has strengthened by 1,8%.
Seven-Day Price Performance
Bitcoin (BTC): 23,5%
Ethereum (ETH): 19,4%
Litecoin (LTC): 7,3%
Aave (AAVE): 41,9%
Chainlink (LINK): 10,7%
Uniswap (UNI): 10,9%
Stellar (XLM): 10,3%
XRP: 11,2%
Get started with Bitcoin Litecoin Ethereum AAVE USDC Stellar Ripple
Join Coinmotion and buy your first cryptocurrencies within minutes!
S&P 500 Index: 2%
Gold: 1,8%
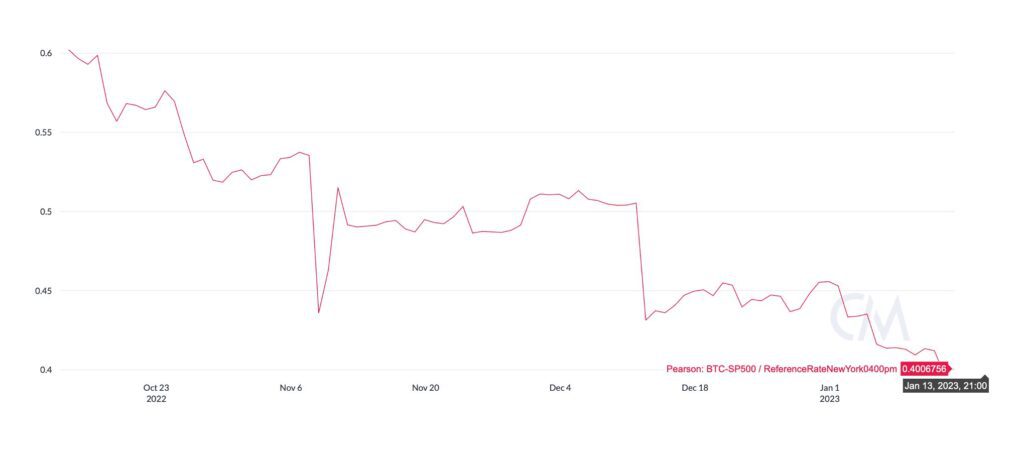
Data from Coin Metrics shows how the correlation between bitcoin and the stock market is still in a downward trend. At the beginning of the fourth quarter of 2022, the 90-day Pearson correlation between leading cryptocurrency and S&P 500 index was above 0,6, however, it has fallen below 0,4 in three months. The correlation has thus weakened by -33 percent in a short timeframe, which is a considerable change.
The essential question is do we actually want bitcoin to break away from the correlation of the stock market? Several well-known analysts are now waiting for the Fed’s pivot, which would undoubtedly bring new momentum to the market. As the stock market possibly continues to strengthen, the correlation to bitcoin will remain strong, although a sovereign breakout of high-beta asset classes is always a possible scenario. Stock market correlation can be seen as protecting bitcoin, yet providing an option to exit during bullish cycles.
Bitcoin’s Spot Price Rises Above The Realized Price
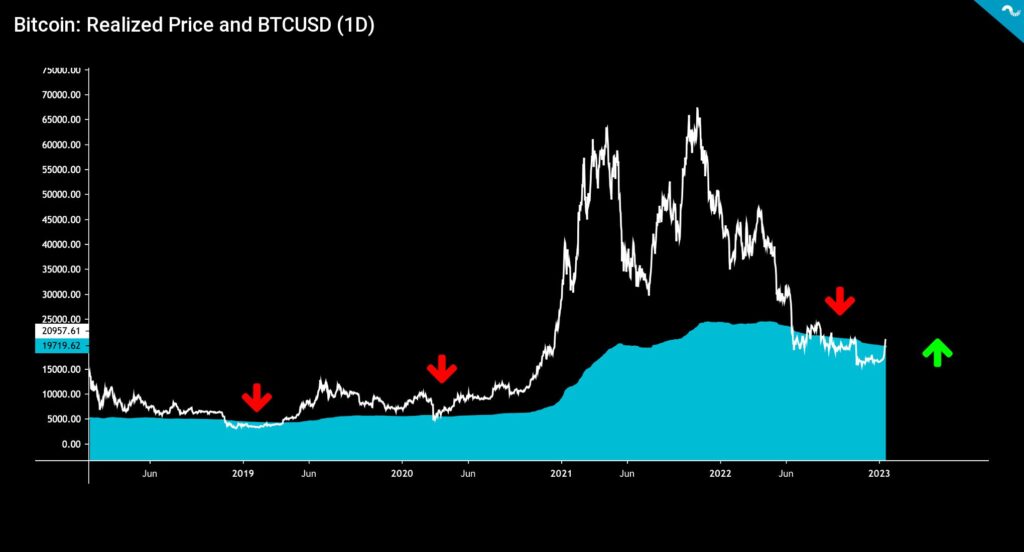
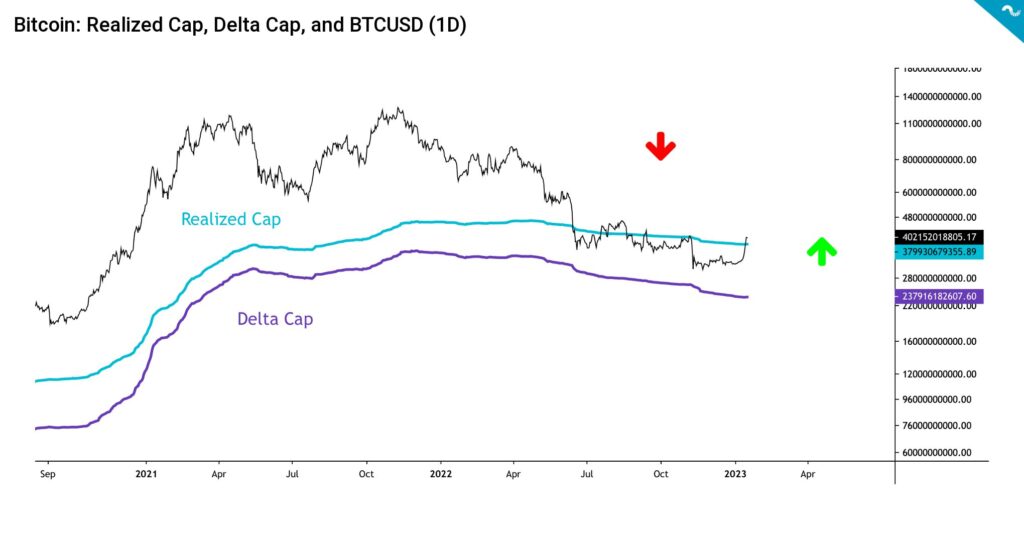
Upflited by the weekend bull cycle, bitcoin has been able to rise above the realized price (turquoise) again. The realized price is important because it represents the average price of all bitcoin purchases. At the same time, the realized price illustrates that the average bitcoin buyer is making a profit on his or her investments. The spot price of bitcoin depressed below the realized price from June to late 2022. If we do not consider local increases above the realized price, the spot was oversold for six months.
From the realized price point of view, the 2022 bear cycle exceeded the 2018-2019 bear market in length, where the spot price fell below the realized price for 133 days. The realized price served as a resistance level for the spot price for a long time, but now it is becoming a support level again.
In addition to the realized price, bitcoin’s market capitalization has managed to rise above the realized cap (turquoise). We previously thought that the final capitulation of the market would require a touch to the delta cap level (purple), but in the current setup, there is perhaps no need for that. The delta cap level can rather be considered a worst-case scenario support level.
A Massive Short Squeeze Disrupts The Derivatives Market
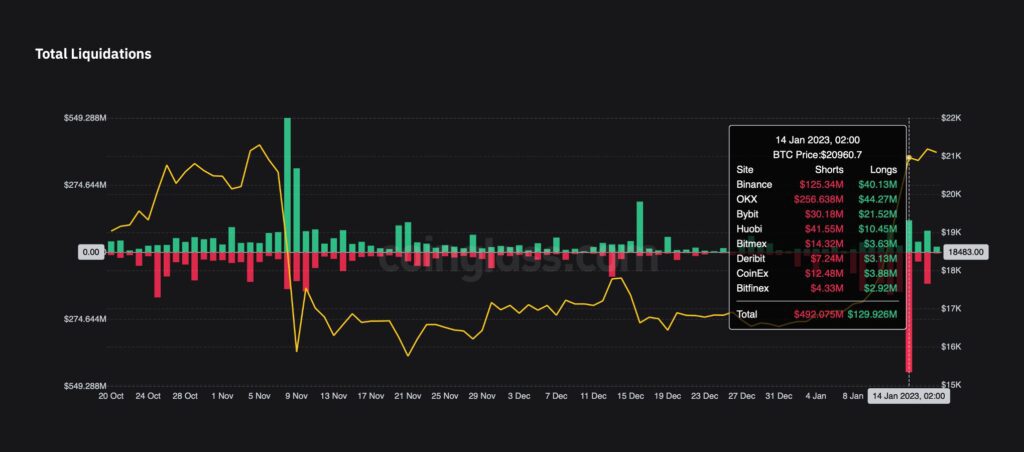
The 24 percent increase in the spot price of bitcoin in a seven-day time window triggered a massive short squeeze setup, where almost $500 million worth of unhedged short positions of the derivatives market were liquidated. Both the spot price increase and the short squeeze hit Asian trading hours. Shorters of altcoins, who had to watch the high-beta tokens rise by up to 100 percent in a day, were even more affected than bitcoin short sellers.
Smart Money in Accumulation Mode
When Satoshi Nakamoto created Bitcoin, he built a structure that requires a significant amount of work (PoW). The Bitcoin blockchain is transparent, which allows us to examine the active supply and unconfirmed transaction output, called UTXO. In the market bottom of early 2019, Delphi Digital successfully forecasted the market capitulation using UTXO data. The current UTXO distribution shows similar characteristics as in 2019.
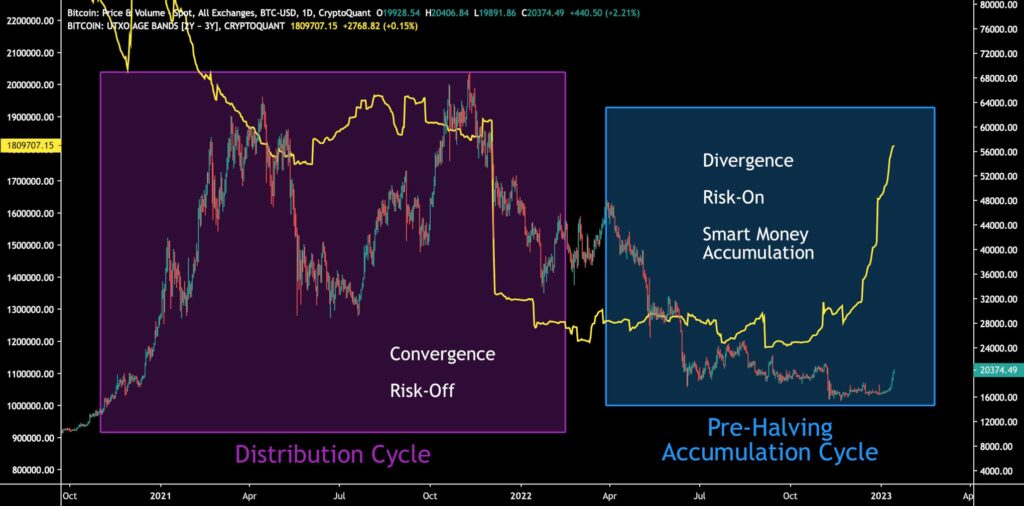
Now we’re paying particular attention to the 2Y-3Y UTXO wave (yellow), which has radically shifted its trajectory in late 2022 and early 2023. The 2Y-3Y represents long-time horizon investors and so-called “smart money”. In the spot market peak of 2021, the 2Y-3Y wave suddenly turned south, mirroring smart money de-risking and selling pressure. Throughout 2022, the 2Y-3Y closely converged with bitcoin’s spot price.
Right now, the 2Y-3Y wave is reaching new highs not seen since late 2021. The wave is significantly diverging from bitcoin’s spot price and simultaneously mirrors a risk-on move. The 2Y-3Y simultaneously acts as a leading indicator to the spot price. Smart money has started to accumulate, be prepared.
Hash Ribbons Indicate The Miner Capitulation to Be Over
The year 2022 was challenging for bitcoin investors, however, it was especially challenging for professional miners. The stock prices of publicly traded miners fell as much as -80 percent, while the cost of energy, rising interest rates, and inflation have eaten away profitability. Mining companies have had to dump bitcoins on the market at a bargain price to cover their running costs.
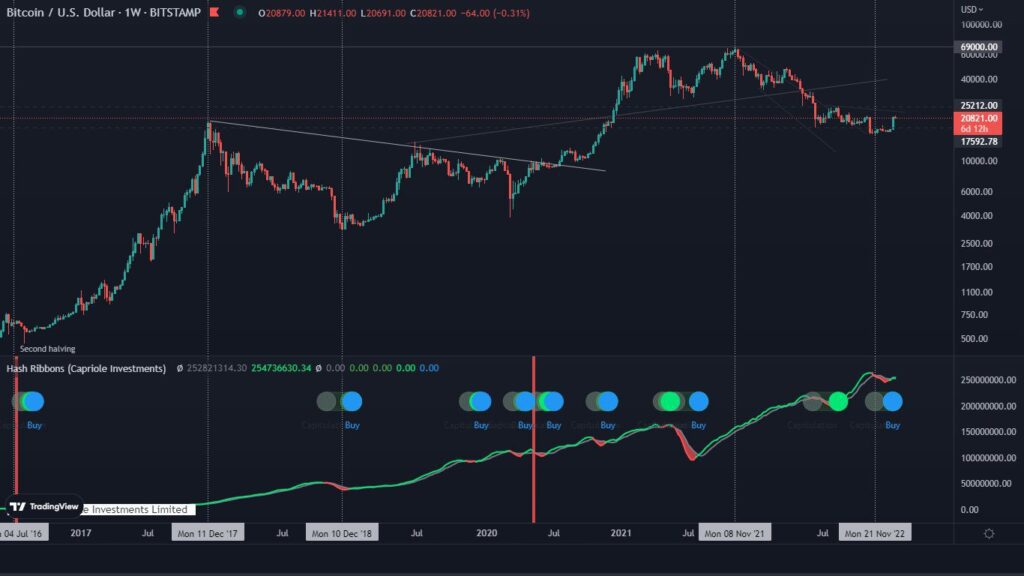
Despite all this, the miners’ capitulation seems to be over, and a turn for the better is on the horizon. According to Capriole Investments, bitcoin’s hash ribbons are again in the buy zone (blue). For context, bitcoin’s spot price rallied 250 percent from the bottom of the 2019 bear cycle as the hash ribbons reversed.
Professional miners still have a total of 1,8 million bitcoin units in their reserves, which is a significant amount. At the same time, the selling pressure from miners weakened considerably at the beginning of the year. If the spot price paradigm shift materializes, miners will have a greater incentive to hold their mined units. The difficulty level of bitcoin has risen to its highest level in its entire history, but that does not prevent the situation of miners from normalizing.

What Are We Following Right Now?
In a rather controversial shift of events, the former Three Arrows Capital founders have created a new fund. The new fund, called GTX, plans to focus on digital asset bankruptcy claims and is looking to raise 25 million dollars from investors.
3AC and Coinflex founders raising funds to invest in crypto bankruptcy claims. pic.twitter.com/6Rkjtg1nnv
— Tuur Demeester (@TuurDemeester) January 16, 2023
Gareth Soloway analyzes the state of the crypto market. Will Soloway’s bear scenario come true?
Will Clemente and Dylan LeClair discuss the bitcoin market outlook for 2023, liquidity, macroeconomics, and correlations.
Stay in the loop of the latest crypto events
- Inflation is slowing & the crypto market is rising
- Deposits to crypto exchanges are on the rise
- Technical Analysis: Asian Trading Hours Are Uplifting The Market
- NFT market value increased by 11,000 percent in 2020-2022
- Bitcoin’s Price Predictions for 2023
Get started with Bitcoin Litecoin Ethereum AAVE USDC Stellar Ripple
Join Coinmotion and buy your first cryptocurrencies within minutes!
The views, thoughts, and opinions expressed in the text belong to the author and not necessarily to the author’s employer, organization, committee, or other group or individual.

