

The TA of week 34 explores the latest technical indicators, including bitcoin’s confluence zone. Additionally, we take a deep dive into potential market bottom cues.
Technical Double Top and Double Bottom
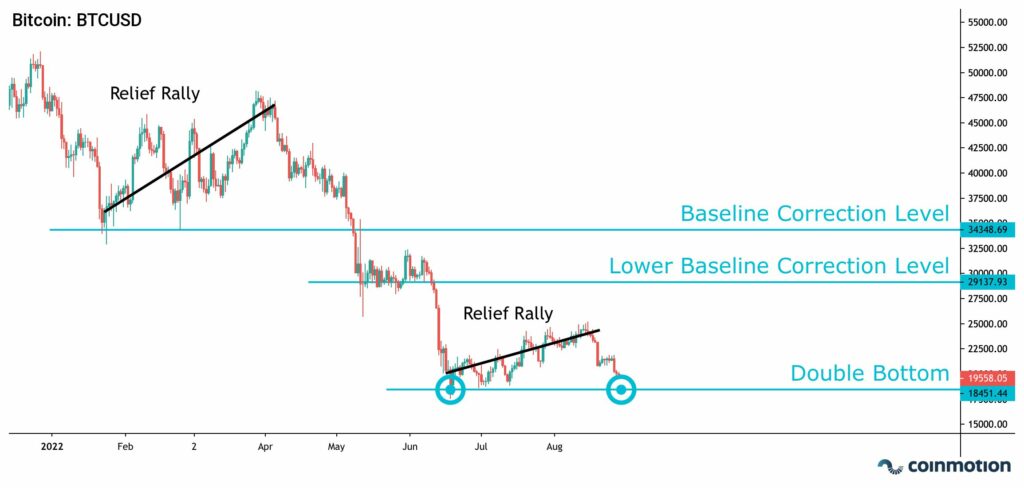
Cryptoassets went through yet another correction last weekend, as the leading cryptocurrency bitcoin broke its $21K support. Bitcoin seems to have a tendency for weekend price corrections and the previous weekend saw BTCUSD dropping from the $23K level to $21K. Bitcoin seems to be forming a double bottom pattern as the spot price is pulled towards mid-June’s lows. While the year 2021 was characterized by a double top pattern, the double bottom might be this year’s eventual scenario.
During its fall from November’s grace or the $69K level, bitcoin has experienced two major relief rallies. The first relief rally pulled bitcoin up from the $35K level to $47K during a time window of January – April. The second relief rally has been much lower between $19K and $24K, spanning from June to August. In 2022 so far, bitcoin has fallen through baseline correction level and lower baseline correction level into the current double bottom setting.
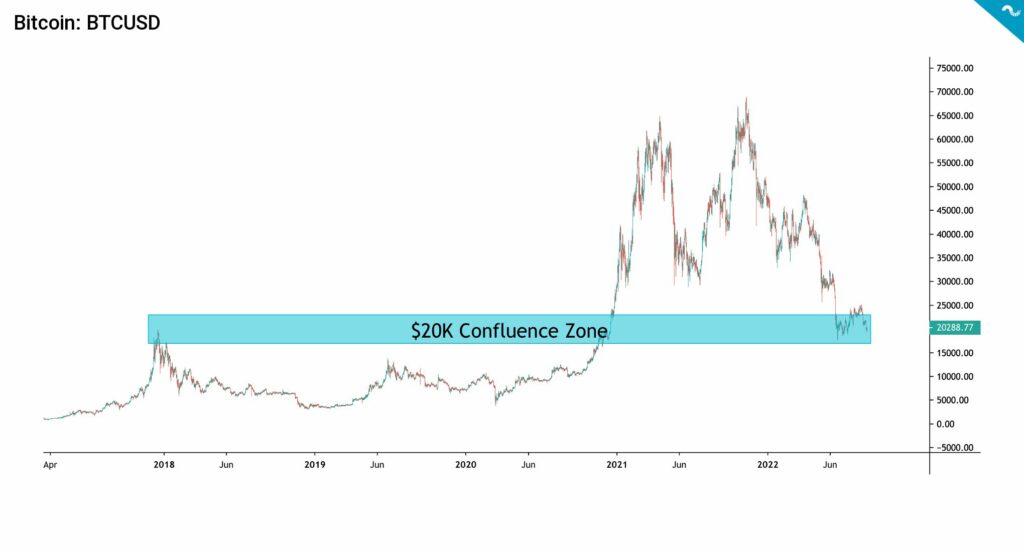
Bitcoin has formed a multi-year confluence zone (light blue) at the $20K level, which acts as current spot price support. The confluence zone dates back to the 2020 bull cycle and late 2017’s price peak. Although the confluence zone acts as a firm support, it also makes bitcoin’s further price advances harder.
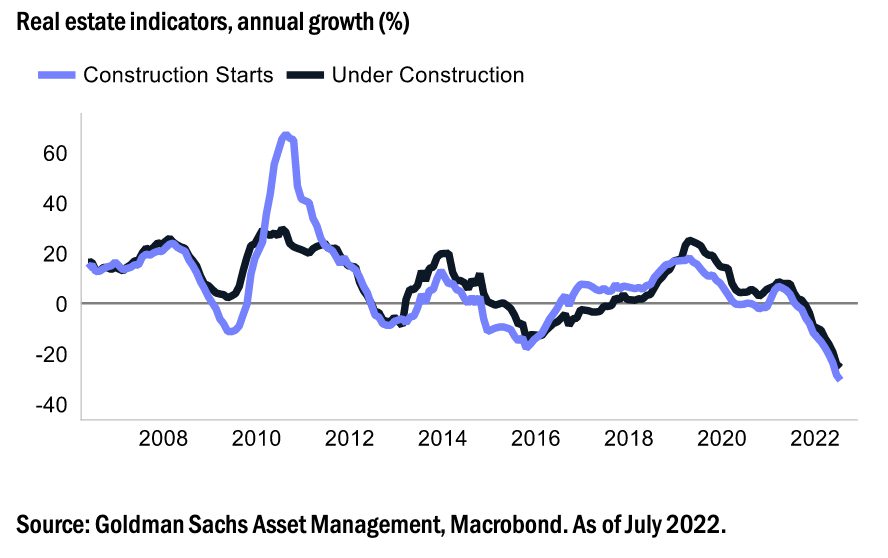
The macro-environment still remains challenging for crypto assets. The leading stock market indicator S&P 500 was pulled back last week in a wake of the EU’s energy crisis. Despite Europe being geologically far away from the US markets, Europe still makes up 25 percent of the SPX earnings. EU itself is preparing to counter the hard winter as electricity prices are up 1000% in some cases. Additionally, Chinese real estate has collapsed in 2022. The country’s government is attempting to stimulate the economy, which has been hit by a combination of a vicious deleveraging cycle and tightening financial conditions.
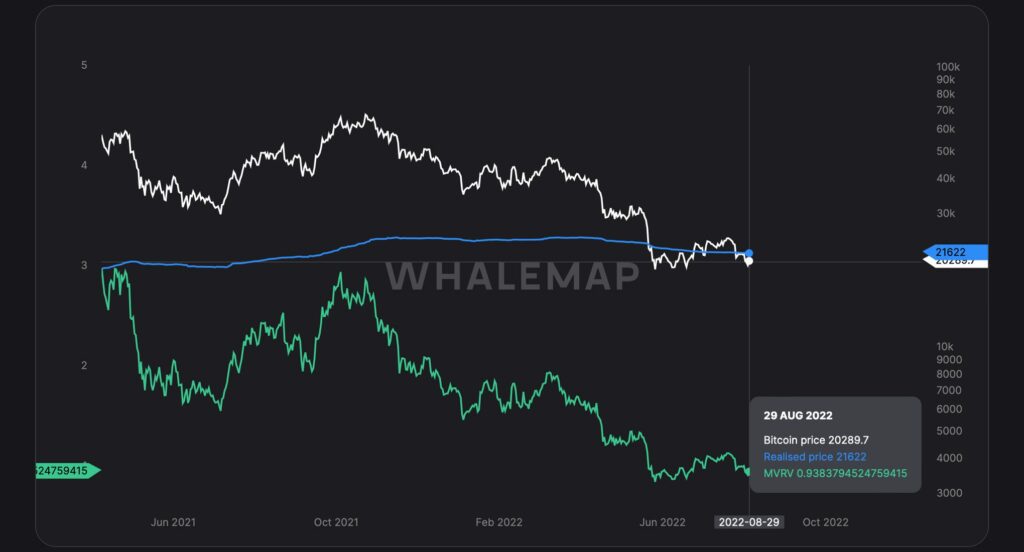
Bitcoin’s spot price (white) plummeted below the realized price (blue) amid the price corrections of recent weeks. Realized price is one of the main benchmarks for BTCUSD and breaching it is a major bearish technical sign. Bitcoin’s MVRV indicator (green) is at 0,94, dropping clearly into the buy zone. MVRV values of below one (< 1) have historically been excellent for accumulation.
The cryptocurrencies underwent a heavy correction last weekend, however, they have been able to bounce since. Bitcoin is down -4,8 percent within seven days, while Ethereum has only weakened -2,5%. As usual, the small-cap tokens faced more volatility. The leading stock market index S&P 500 is down 2,59 percent from last week, leading to a wide equity sell-off.
Bitcoin (BTC): -4,8%
Ethereum (ETH): -2,5%
Litecoin (LTC): -3,6%
Aave (AAVE): -3%
Chainlink (LINK): -4,4%
Uniswap (UNI): -9,9%
Stellar (XLM): -4,4%
XRP: -4,3%
– – – – – – – – – –
S&P 500 Index: -2,59%
Gold: 0,23%
– – – – – – – – – –
Bitcoin’s 90-Day Pearson Correlation with S&P 500 Index: 0,5
Bitcoin RSI: 38
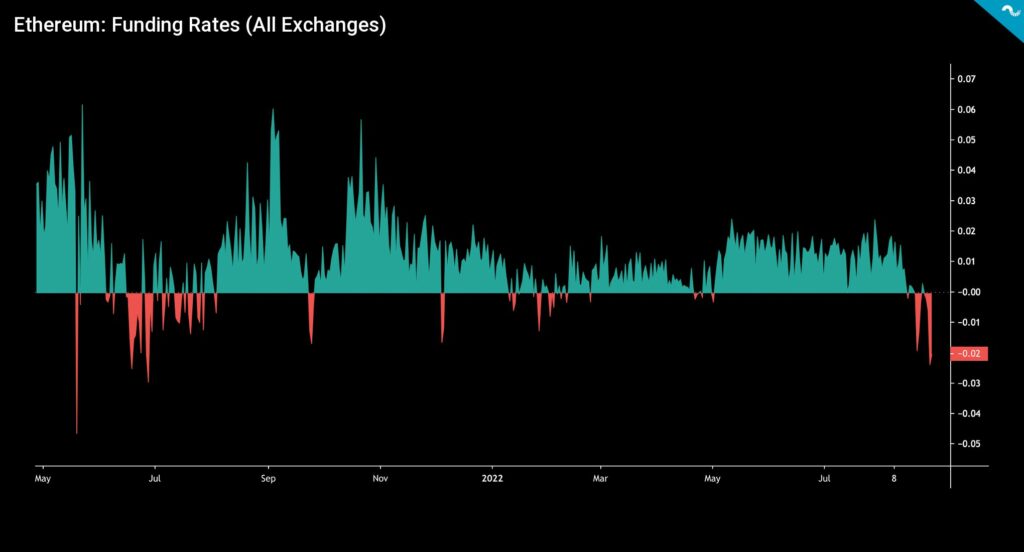
Ethereum’s Funding Highly Negative
Ethereum is currently preparing for the anticipated “Merge” event, which is estimated to occur in 15 days (14.9). Ethereum’s spot price has eclipsed Bitcoin’s since the market bottom in June, however, both have been suffering recently. Ethereum’s funding rate has dramatically dropped to negative territory, plunging into -0,02. The negative funding is usually a bearish sign, as it mirrors dominant short sentiment, and the funding rates were as negative in June’s correction. Negative funding can also mean that traders are hedging their spot exposure in order to be delta neutral. The deepening negative funding sets the stage for a possible short squeeze.
Tracking The Market Bottom
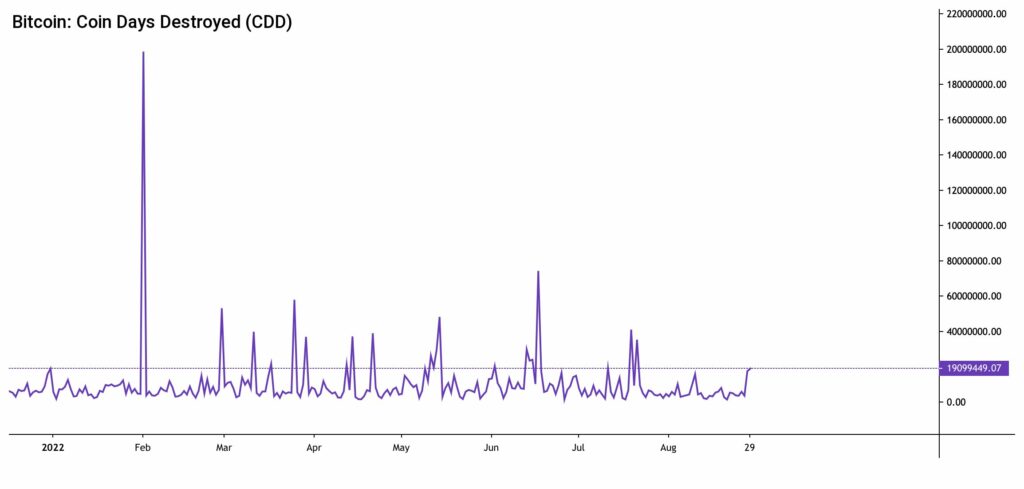
The seemingly everlasting bear market is a tough epoch for all investors and makes us think about where the organic market bottom is. Bitcoin’s transparent structure has allowed the creation of multiple market bottom indicators, which we’ll unwrap here. The first one is Coin Days Destroyed (CDD), which essentially highlights the position of long-term holders (LTH) and is considered an alternative to the basic transaction volume metric. Each unspent day for a bitcoin unit adds a “coin day” and when that coin is eventually spent, the unit uplifts the Coin Days Destroyed metric. CDD can be interpreted with the following logic:
↑ High CDD: Selling pressure from long-term investors, bearish
↓ Low CDD: No significant selling pressure from long-term investors, bullish
The most recent CDD data shows no notable long-term holder capitulation, however, a moderate amount of old coins has been sold so far in 2022. The highest CDD value so far was recorded in late 2018 as bitcoin’s spot price slid towards $3K, leading to a wide capitulation. In a summary, these CDD peaks mark the moments when long-term holders have reduced exposure to bitcoin and sold their positions. Calmer CDD periods mirror long-term holding, respectively.
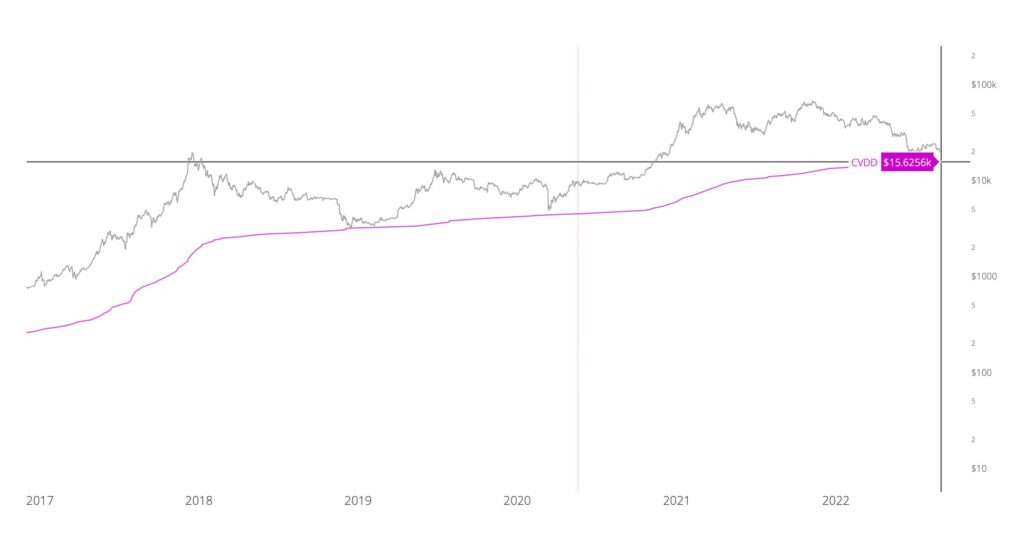
Perhaps a more interesting indicator for tracking bitcoin’s market bottom is the Cumulative Value Days Destroyed indicator or CVDD. When bitcoin units pass from an old investor to a new investor, the transaction carries a USD value and also destroys an amount of holding time by the previous holder. CVDD is the cumulative sum of this value-time destruction as a ratio to the age of the market and it’s divided by 6 million as a calibration factor. The CVDD has accurately formed bitcoin’s market bottom since the early years and the current CVDD would indicate bitcoin bottoming at 15 626 US dollars. That scenario would mean a -23 percent drop from current levels.
GBTC’s Discount at -31%
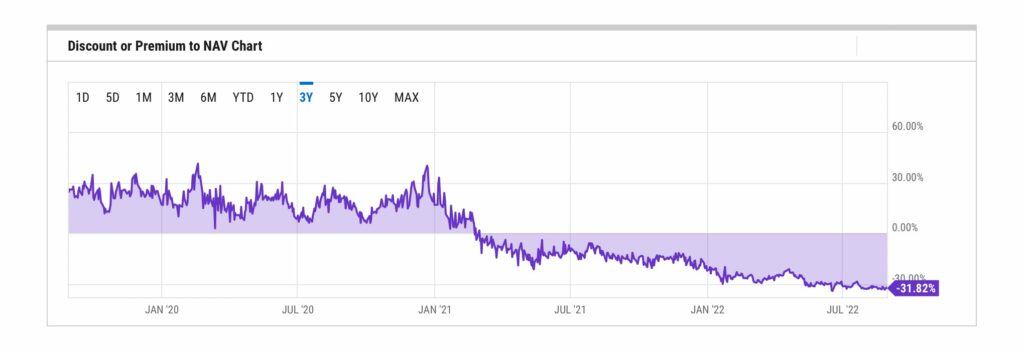
Grayscale’s Bitcoin Trust, or GBTC, is one of the most well-known financial products in the industry. The GBTC was particularly used by hedge funds for the “arbitrage trade”, which exploited the GBTC premium over a six-month lockup period. The arbitrage trade worked seemingly well until February 2021, and we can argue that many newcomer institutions used this arbitrage opportunity. Just like a typical anomaly, the time window for arbitrage trade closed in February 2021, and GBTC premium shifted to negative (discount).
The premium has been negative since and very recently it reached a new low of -31,82 percent. GBTC’s other metrics are also in decline and its assets under management (AUM) have declined from January’s $29,95 billion to current $12,45B. Additionally, the daily volume of GBTC has dropped from January’s $128 million to a mere $36M in late August. Grayscale has stated that they plan to convert the GBTC into an ETF, so hypothetically the discount would be a trading opportunity if we assume that the premium status quo to returns to normal.
What Are We Following Right Now?
Europe’s energy market is going through heavy volatility, including 300 euro intraday swings in baseload electricity prices.
After years of enormous monetary expansion, the US dollar has reversed its supply curve. No wonder why the increasingly scarce dollar is appreciating in value.

The views, thoughts, and opinions expressed in the text belong to the author and not necessarily to the author’s employer, organization, committee, or other group or individual.