
The latest TA explores how the trading volume of Ethereum has eclipsed Bitcoin in some exchanges. Additionally, we dive into the macro environment and how Ethereum’s potential divide could mess with the markets and communities. We also assess the correlation between the most prominent cryptoassets and S&P 500 index.
The Flippening of Exchange Volume
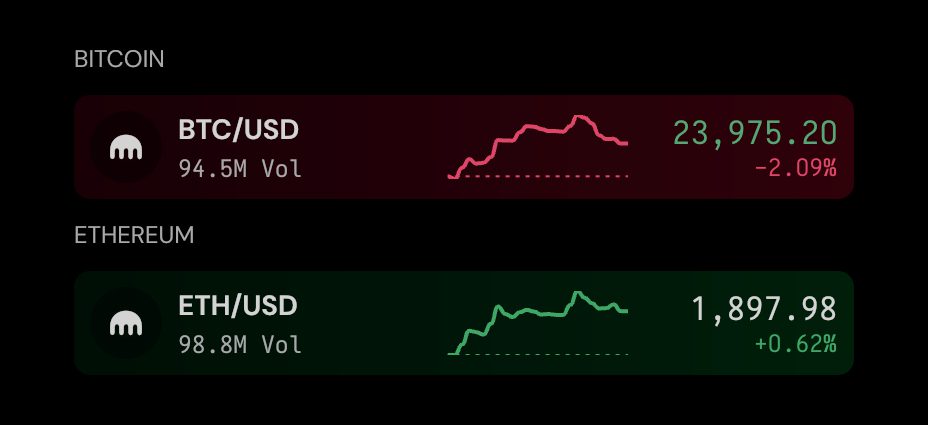
Digital assets experienced yet another eventful week as the leading cryptocurrency bitcoin was surging towards the weekend. Bitcoin was able to climb from Wednesday’s lows of $22,8K to Sunday’s $25K. However, bitcoin promptly pulled back to $23K during early week 23. Investors are relentlessly trying to price in Ethereum’s upcoming Merge event, as it promises to lead the DeFi platform into its new protocol chapter. According to Kraken’s exchange data, the trading volume of Ethereum surpassed Bitcoin on Friday as ETH recorded $98,9 million worth of trading volume while BTC only reached $94,5 million.
Ethereum’s chain speculation was yet again fueled by Justin Sun, who openly supports a “USDD” algorithmic stablecoin, which would be the first asset in the forked “EthereumPOW” ecosystem. Justin Sun’s exchange Poloniex is among the first ones to list two potential forked Ethereum (ETH) tokens: ETHW (ETH1) and ETHS (ETH2). The “two chain structure” would likely split the Ethereum community into two, however, we must not forget that the current Ethereum (ETH) itself is a fork of Ethereum Classic (ETC).
Poloniex states that the two forked tokens, ETHW (ETH1) and ETHS (ETH2), represent Proof-of-Work (PoW) and Proof-of-Stake (PoS) respectively, and can be paired up with ETH, USDT, or USDD for trading. The tokens can also be swapped with ETH at a one-to-one ratio on the platform. The two newly listed tokens are reportedly powered by TRON.
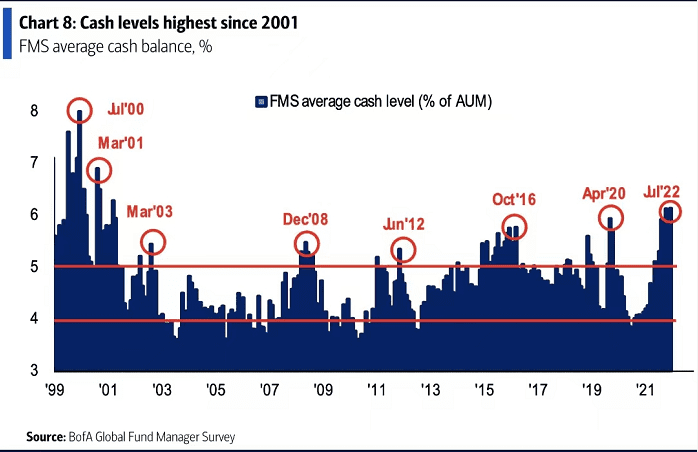
Most digital assets bottomed in mid-June, as explored in the last TA, and Ethereum is up 50 percent from its lowest spot price level in 2022. Cryptocurrencies have been able to perform well amid the confluence of macro uncertainties, including inflation, war, and raw material shortages. Bank of America recently published a study that showcases the exceptionally high cash levels waiting on the sidelines. According to Bank of America’s survey for fund managers (FMS), average cash balances are up 5,6 percent, the highest level since 2001. The significant amount of cash on the sidelines could easily find its way to high beta asset classes like crypto.
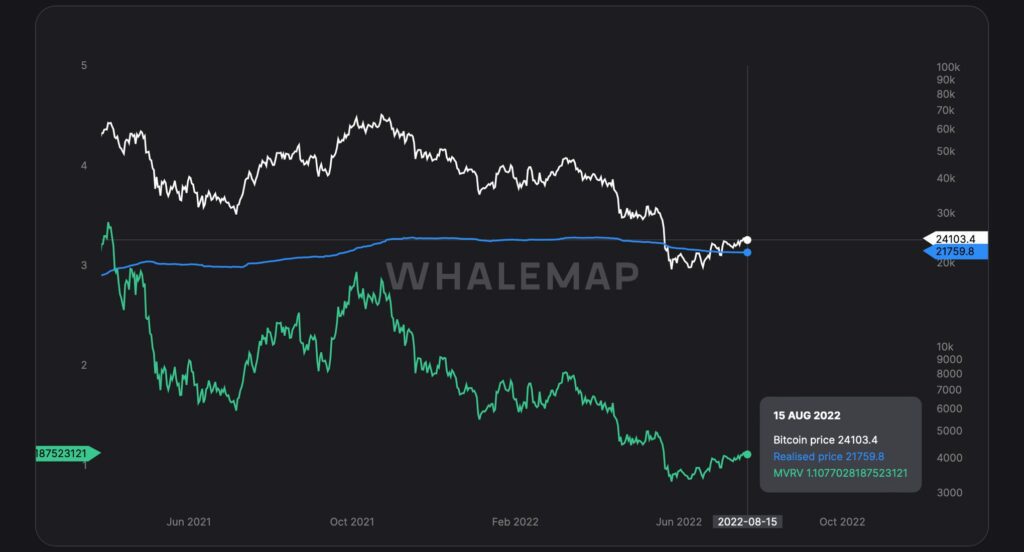
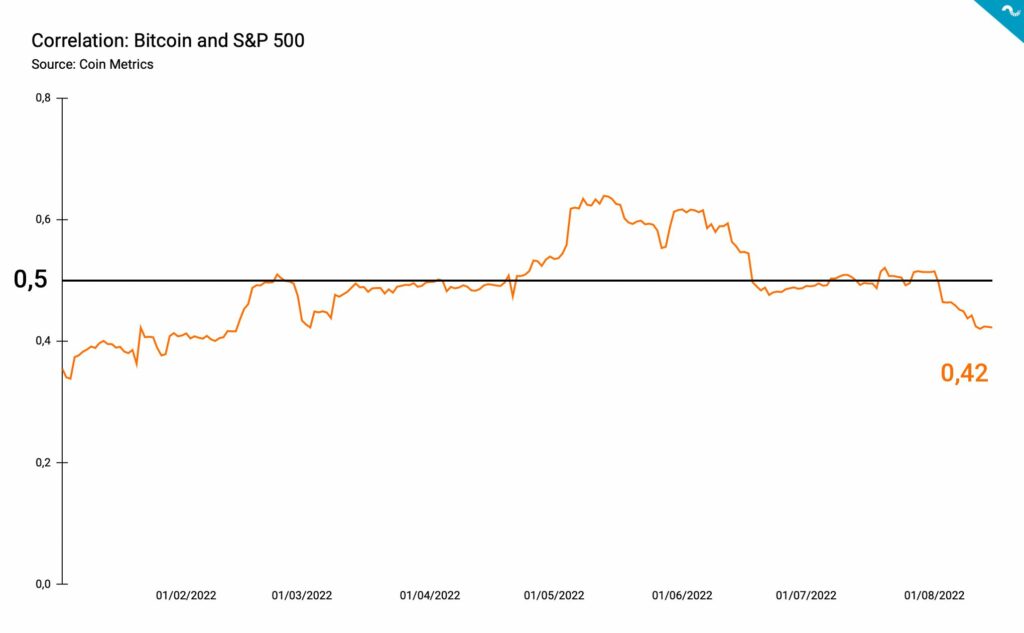
Whalemap’s data shows Bitcoin gaining altitude above the realized price (blue) as it tries to move towards Deutsche Bank’s target price of $28K. Bitcoin’s MVRV indicator (green) has soared to 1,1, indicating the leading cryptocurrency being in close proximity to the buy zone of MVRV below one (< 1). Bitcoin’s 90-day correlation with S&P 500 index has dropped to a new low of 0,42, while S&P 500 has heavily surged upwards, recording a 3,79 percent increase in a week.
Technology stocks like Apple (AAPL) have almost fully recovered from mid-June’s crash and AAPL is only 5 percent away from its all-time high. The good sentiment of tech stocks could eventually pull cryptoassets up in their wake. Most of the cryptoassets have gone sideways within the past seven days, waiting for new (upward) momentum.
7-Day Price Performance
Bitcoin (BTC): +0,3%
Ethereum (ETH): +5,8%
Litecoin (LTC): -2,6%
Aave (AAVE): +4,8%
Chainlink (LINK): -1,6%
Uniswap (UNI): -5,5%
Stellar (XLM): -6%
XRP: -1,2%
– – – – – – – – – –
S&P 500 Index: +3,79%
Gold: -0,56%
– – – – – – – – – –
Bitcoin’s 90-Day Pearson Correlation with S&P 500 Index: 0,42
Bitcoin RSI: 59
Digital Assets Decoupling from Stocks
The correlation between cryptocurrencies and the stock market has been a hot topic this year, as macroeconomic headwinds forced both cohorts down during the spring of 2022. Bitcoin’s correlation with the S&P 500 index has historically been weak, however the two have been converging since the summer of 2020. The year 2020 was characterized by emerging institutional demand, which was supported by thought leaders like MicroStrategy’s Michael Saylor.
Bitcoin’s 90-day Pearson correlation with S&P 500 entered a secular uptrend in the summer of 2021, when the relationship increased from July’s 0,1 to late year 0,3. The correlation peak was reached in mid-May 2022 when it increased to 0,64. From there on the correlation has dropped below 0,5 (black trendline) and to the current 0,42. In addition to the S&P 500, bitcoin’s correlation with Nasdaq 100 has been even higher, reaching 0,894 in July 2022.
While many analysts still repeat the “correlation narrative”, data shows how Bitcoin seems to be decoupling from the stock market. Somewhat counter-intuitively the initial decoupling doesn’t seem to be that bullish for bitcoin, as many tech-related stocks like Apple have almost fully recovered back to their ATH level. The decoupling of Bitcoin and the S&P 500 is a positive phenomenon, however it might take some time for bitcoin to actually rally up.
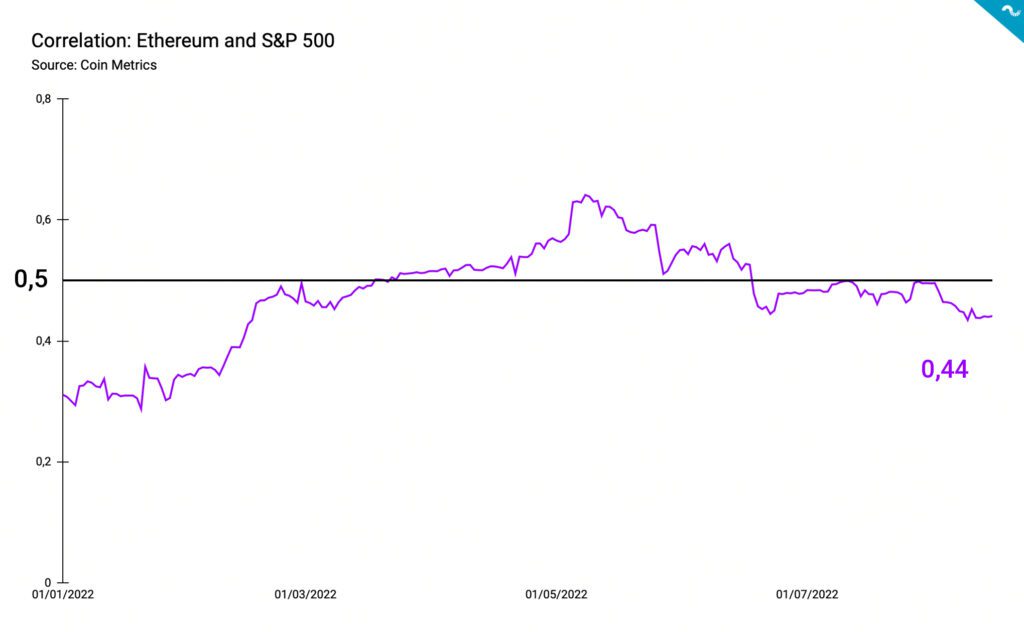
Surprisingly, Ethereum is slightly more correlated with the stock market than the leading cryptocurrency Bitcoin. Ethereum’s correlation chart with S&P 500 follows a similar trajectory as Bitcoin’s, but very recently Ethereum was even more correlated with stocks at 0,44. The correlation with S&P explains why Ethereum is 50 percent up from June’s market bottom and Bitcoin only 13%. If we assume that the stock market would continue its recovery, Ethereum’s correlation with S&P might even go up, forming a notable divergence to Bitcoin.
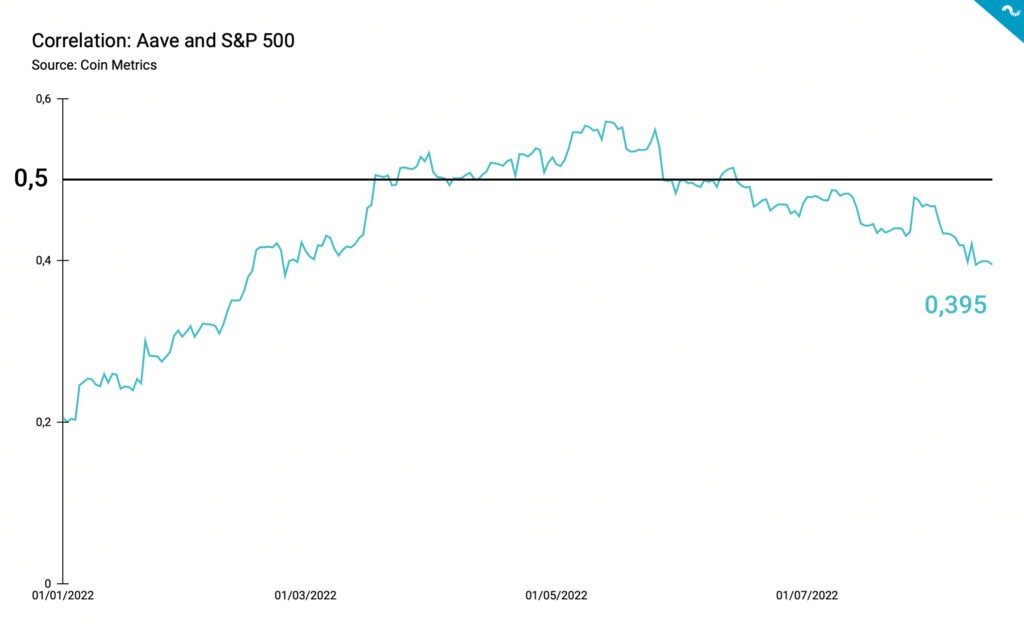
The token of the decentralized lending platform Aave has diverged from Bitcoin and Ethereum by having only a 0,395 correlation with the S&P 500. Aave has recovered almost 100 percent from the chasm of June and it has outperformed the stock market in addition to the leading cryptocurrencies. Aave was one of the cryptocurrencies that missed the second double top rally in 2021, and it might be forming a bullish trajectory if macro eases a bit.
What Are We Following Right Now?
China’s imports of steel products are at the lowest level in 24 years, signaling a potentially deepening recession.
According to the current adoption pace, 1 billion people might be using bitcoin within four years.
Sometimes it’s good to take a wider perspective and look at bitcoin’s yearly spot price candles.

The views, thoughts, and opinions expressed in the text belong to the author and not necessarily to the author’s employer, organization, committee, or other group or individual.