
The TA of week ten explores latest market action and on-chain data. Additionally we follow how cryptoassets continue their flow into crisis-ridden Ukraine.
Bitcoin’s Spot Price Up 7% Since The Trend Reversal
The leading cryptocurrency Bitcoin has shown slight weakness during past seven days, dropping -1,3 percent. The second largest cryptoasset and decentralized finance platform Ethereum weakened -3,3% during the same timeframe. Small-cap tokens like Aave weakened more than bigger ones, as usually happens per defaltam.
7-Day Price Performance
Bitcoin (BTC): -1,3%
Ethereum (ETH): -3,3%
Aave (AAVE): -4,1%
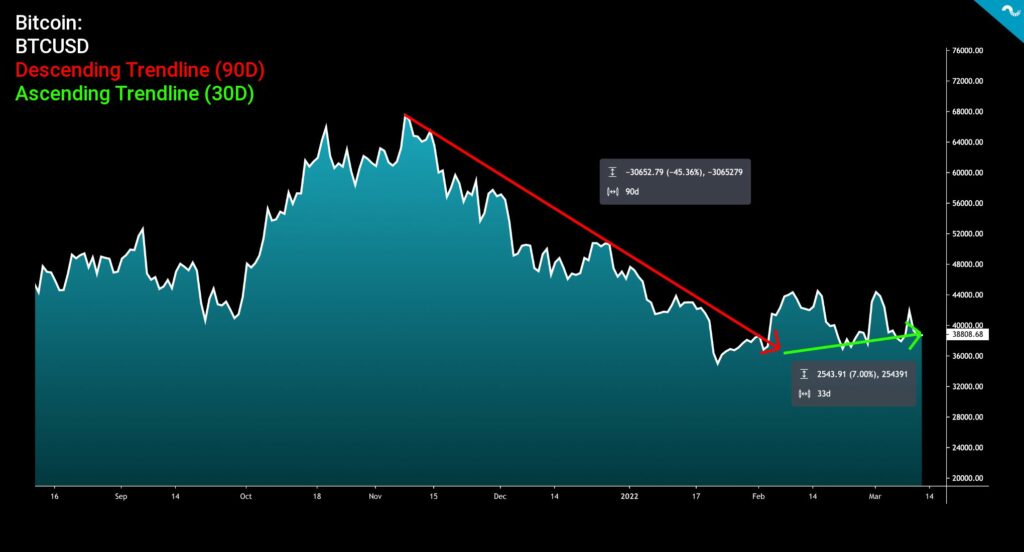
Bitcoin’s spot price has continued its upward momentum after bouncing decisively from $35K level in early February. The spot has increased 7% since the inflection point, fluctuating between levels of $36K and $44K. While Bitcoin’s spot price performance might look modest, it has been excelling well in an environment of rising macro and geopolitical risk. Bitcoin has been outperforming stocks in this uncertain market, and its performance has totally eclipsed technology-related stocks and indices like OMXH 25.
Block Reward Data Indicates Ongoing Accumulation Phase
Recent on-chain data shows how the percentage of fees in total block reward has remained low since May 2021 spot price correction. When analyzing data since 2017, the percentage of fees in total block reward data can be segregated into two major segments: Accumulation cycle and distribution cycle. Accumulation cycles have been favored by institutions and smart money, while distribution cycles have been characterized by retail demand.
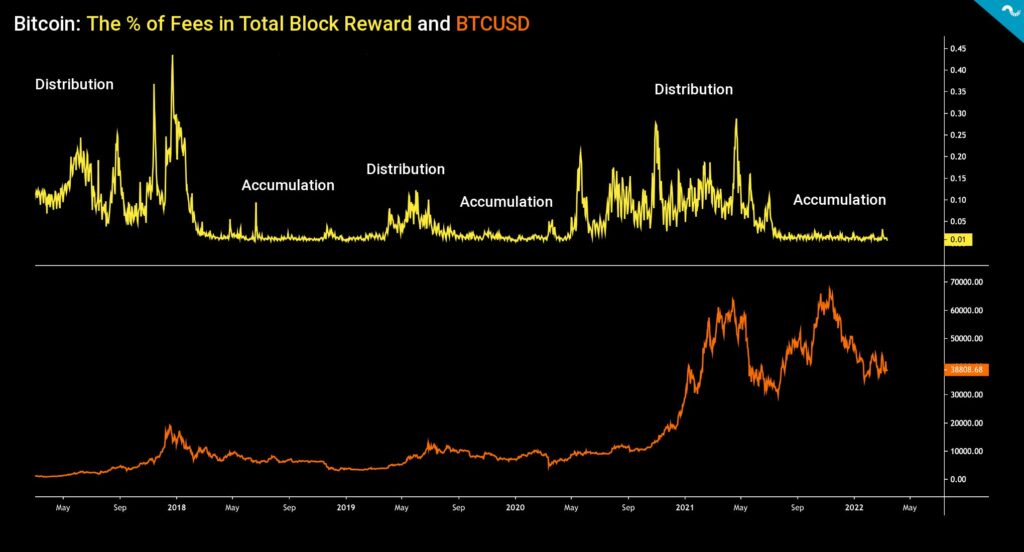
The on-chain data since 2017 shows how the said year was definitively a distribution cycle, as percentage of fees in total block rewards climbed to 0,43 in late December of 2017. The distribution cycle of 2017 was followed by an accumulation cycle in 2018 and 2019, including a small distribution phase during summer 2019. The accumulation cycle of 2020 was again followed by distribution cycle in late 2020 and early 2021, correlating with huge spot price hikes. The current accumulation cycle is soon 12 months old and consequently a new distribution cycle is soon ahead.
Crypto Donations to Ukraine Reach $100 Million
As explored in the TA of last week, the cryptoassets have continued their inflow to Ukraine. Alex Bornyakov, Ukraine’s deputy minister at the Ministry of Digital Transformation, estimates that the combined amount of donated cryptoassets has ascended to $100 million. In addition to receiving help in traditional forms the country has been successfully leveraging crypto technology in its fight for existence.
After the start of conflict on February 24th, the donations were firstly launched in Bitcoin, Ethereum, and USDT (ERC-20) form on February 26th. On March 1st Polkadot was added to the list after famous Ethereum & Polkadot founder Gavin Wood personally promised to donate $5 million to the cause. The campaign was further scaled on March 6th as the government added an option to donate in Monero. The public addresses are listed followingly:
Bitcoin (BTC): 357a3So9CbsNfBBgFYACGvxxS6tMaDoa1P
Ethereum (ETH) and USDT (ERC-20): 0x165CD37b4C644C2921454429E7F9358d18A45e14
Polkadot (DOT): 1x8aa2N2Ar9SQweJv9vsuZn3WYDHu7gMQu1RePjZuBe33Hv
Monero (XMR): 42HKMWrDzCt45jAp9g5SBe1AJbnBwgUpY8nNfaG6g2T1ZLQpMesUsX1HzZwhuX4CCH7T5ew8AhBPNDXfHNU9xN77N232aap
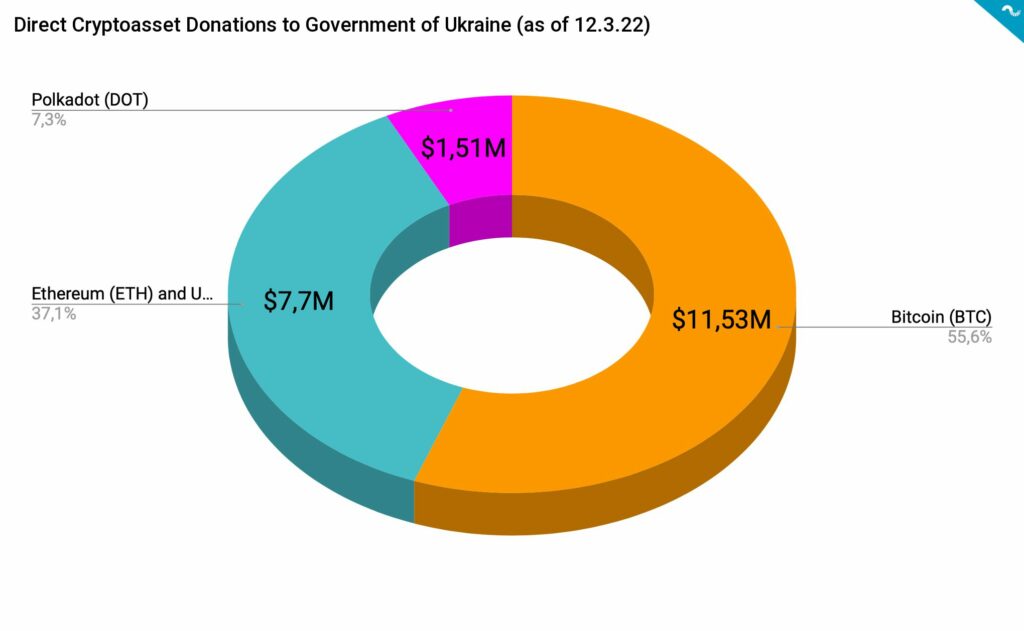
The direct Bitcoin donations grew from $9,95 million of last week to $11,53M, increasing 16 percent. Donations in Ethereum and USDT grew even more from $4,62 million to $7,7M, representing a 67% increase. Polkadot donations grew from $1,41 million to $1,51M. The amount of donated Monero units is unknown as the privacy protocol hides its transactions by default and government didn’t publish the view key.
UTXO Data Indicates Accumulation in Multiple Waves
Bitcoin’s mysterious creator Satoshi Nakamoto originally designed the cryptocurrency as a transparent network. Transparency allows researchers to deeply explore the network and its underlying UTXO structure. UTXO Age Distribution, or more commonly known as HODL Waves, presents a macro view of Bitcoin investor behaviour. The UTXO data is usually divided into six segments however two of them attract special attention right now.
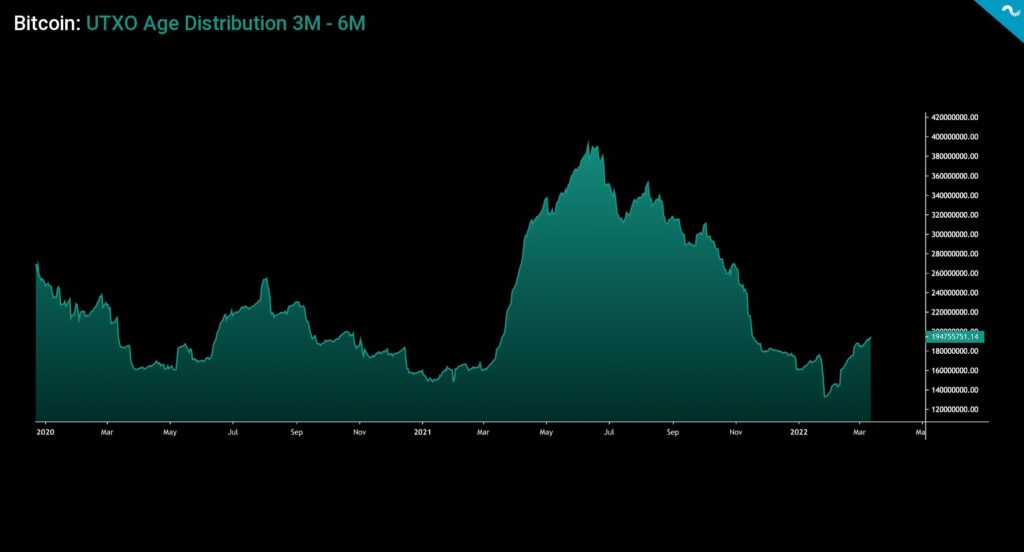
3M-6M UTXO
The three to six month long UTXO wave mirror short-term investors and this wave has increased heavily from May to July 2021. After July 2021 the wave decreased significantly towards the end of the year, signaling notable selling pressure. However very recently the 3M-6M UTXO wave saw an inflection point and gained new momentum, signaling fresh accumulation. This can also be interpreted as a possible spot price bottom.
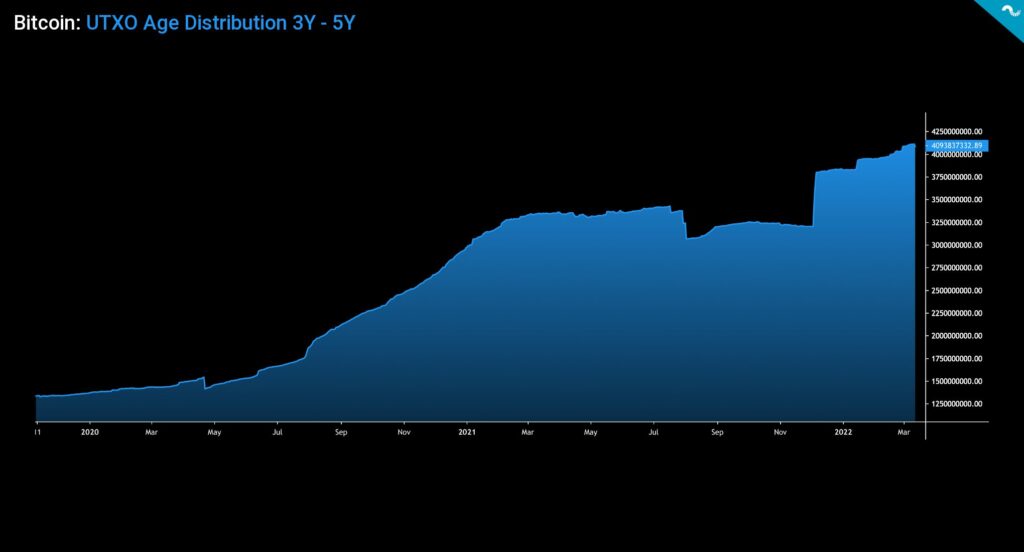
3Y-5Y UTXO
The three year to five year UTXO wave shows long secular uptrend since early 2020. 3Y-5Y UTXO wave represents long-term smart money and institutional money like MicroStrategy, who have multi-year Bitcoin strategies. This wave saw some selling pressure from late summer to November 2021, however accumulation has been persistent since. The long-term institutional investors have deep investment horizons and they have a tendency to buy regardless of the spot price volatility.