


The TA of week 15 explores uncertain markets, supply chain concerns, and growing inflation. Additionally we study Bitcoin’s technical and fundamental metrics, as usual.
Macro Environment Shrouded in Uncertainty
After a long macro-level bull cycle from 2010 to 2021, we’re witnessing uncertainty spreading dark clouds across markets again. The markets are seeing geopolitical, inflationary, and COVID-related risk going beyond expectations. The 2010 to 2021 cycle was characterized by low inflation and almost every asset class offered moderate to high returns, however those times might now be history.
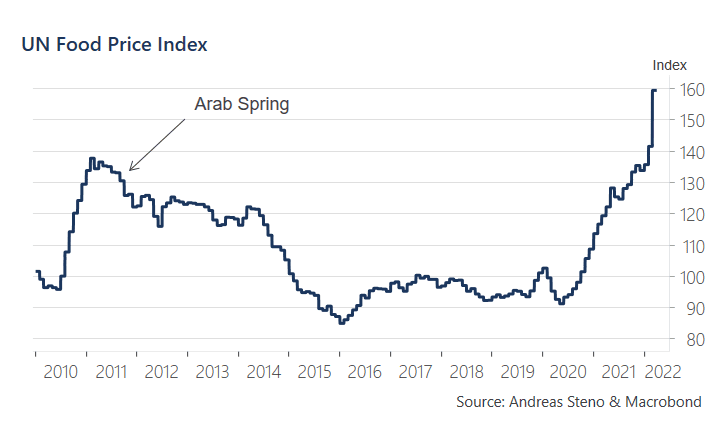
The fastly escalating inflation runs at approximately 10 percent per annum, and the effect of inflation is especially pronounced in commodities like wheat and crude oil. Andreas Steno Larsen recently published an analysis which portrays how UN Food Price Index has almost doubled in recent years, rising from level 90 into 160. Escalating food prices alone have a huge multiplicative effect on regional stability and geopolitics.
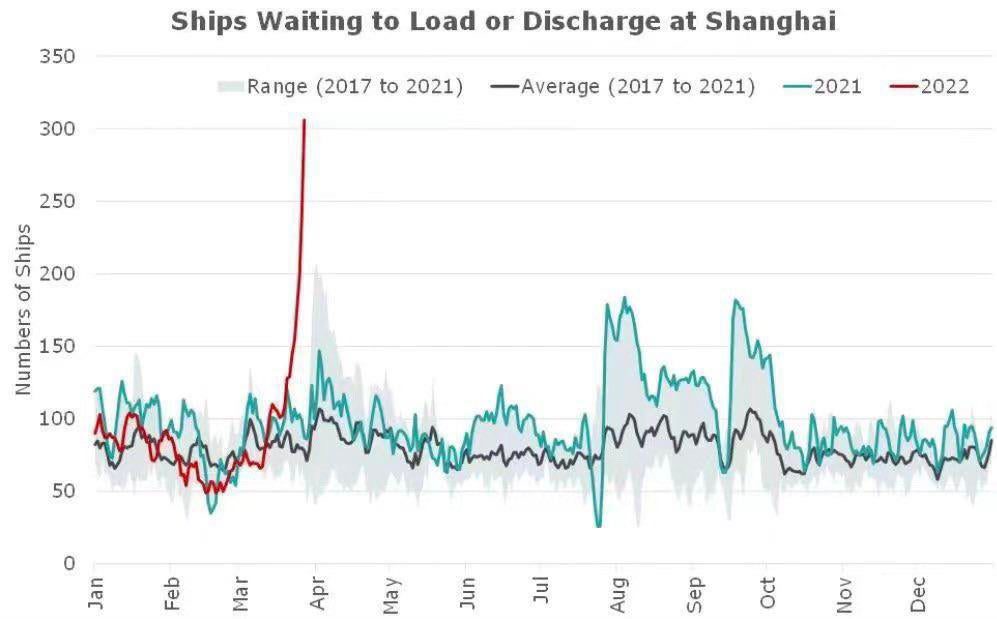
COVID-related supply chain issues are also acting as catalyst for inflation, recent data from Shanghai shows how the amount of ships waiting to load or discharge cargo has climbed over 300% since February. Shanghai acts as a distribution center for global goods and supply chain issues will likely ripple through global trade, significantly rising price levels.
Bitcoin Heavily Correlated with S&P 500 Index
Bitcoin has continued to weaken for the second week in a row and the leading cryptocurrency has dropped -7,8% during past seven days. The main decentralized finance platform Ethereum is down -9,3% from last week. Legacy altcoins like XRP and Litecoin are essentially sideways with DeFi tokens taking more losses.
7-Day Price Performance
Bitcoin (BTC): -7,8%
Ethereum (ETH): -9,3%
Litecoin (LTC): -3,9%
Aave (AAVE): -9,3%
Chainlink (LINK): -13,6%
Uniswap (UNI): -9,7%
Stellar (XLM): -5,4%
XRP: -2,5%
– – – – – – – – – –
S&P 500 Index: -2,39%
Gold: 2,07%
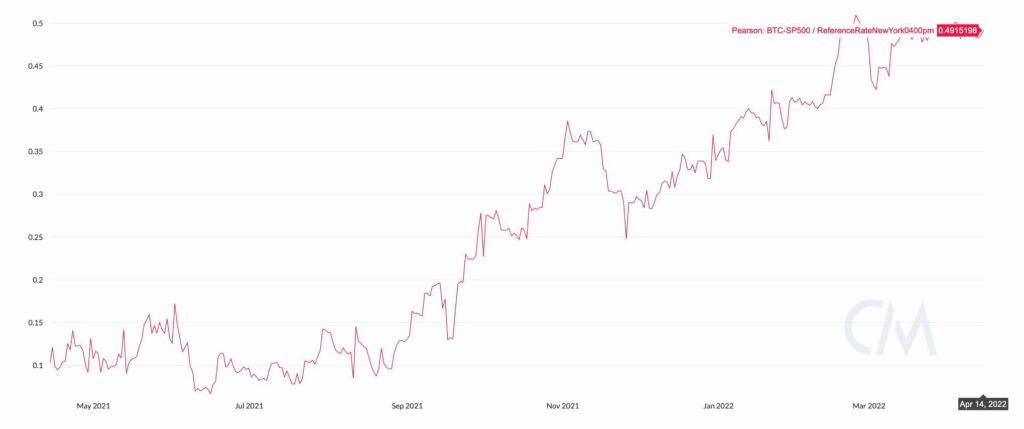
S&P 500 Index has weakened -2,39% during the past week in heavy correlation with bitcoin. The 90-day Pearson correlation between Bitcoin and S&P 500 is almost at 0,5, marking one of the highest positive correlations in Bitcoin’s history. This means that Bitcoin closely follows the stock market and is closely tied to gusts of larger macro market.
Gold has been strengthening its position by 2,07% and currently supports its investment narrative as store of value (SoV). The 90-day Pearson correlation between Bitcoin and gold is close to zero at -0,05.
Bitcoin Bounces on 600-Day Moving Average
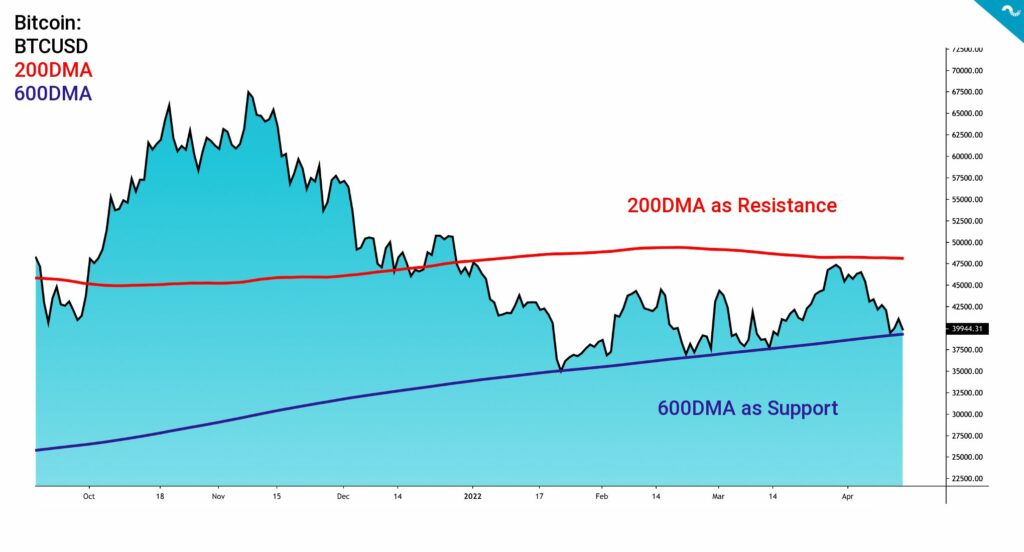
While Bitcoin has been weakening within first weeks of April, it’s still in the upwards moving channel of 600-day moving average (600DMA) (blue) and 200-day moving average (200DMA) (red). In this setting the 600DMA acts as a support level and 200DMA as resistance. Bitcoin’s spot price tried to break through 200DMA in late March but the attempt was rejected. Bitcoin decisively bounces on the 600DMA and it seems to hold as the de facto support level, however each touch to the 600DMA makes it weaker over the long time scale.
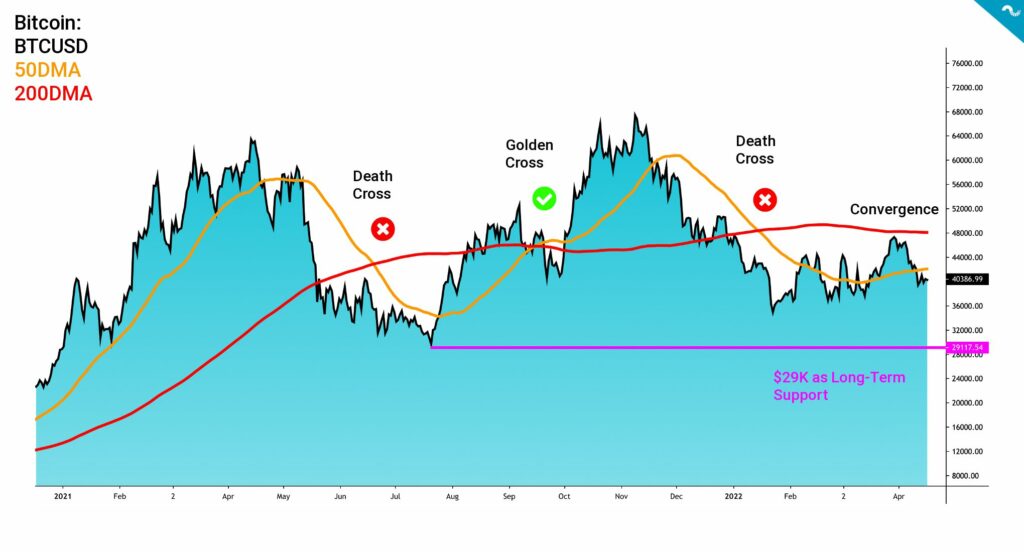
Over longer time horizon the 50-day moving average (50DMA) (orange) and 200-day moving average (200DMA) (red) have offered precise spot price signals. Bitcoin’s spot price hit $29K level (purple) at the inflection point of summer 2021. The $29K level was also the foundation for huge short squeeze in late July 2021 and launched a 3-month long bull market. If the spot should fall further down, $29K will be the last line of defence.
50DMA and 200DMA have been forming the the well-known Golden and Death Cross settings that have occurred 3 times since the beginning of 2021: Death Cross in June 2021, Golden Cross in September 2021, and Death Cross again in January 2022. Counterintuitively the 50DMA is again approaching 200DMA and this convergence might even form a new Golden Cross.
↑ Golden Cross: 50DMA Crosses 200DMA to The Upside
↓ Death Cross: 50DMA Crossed 200DMA to The Downside
End Game for Emerging Market Currencies?
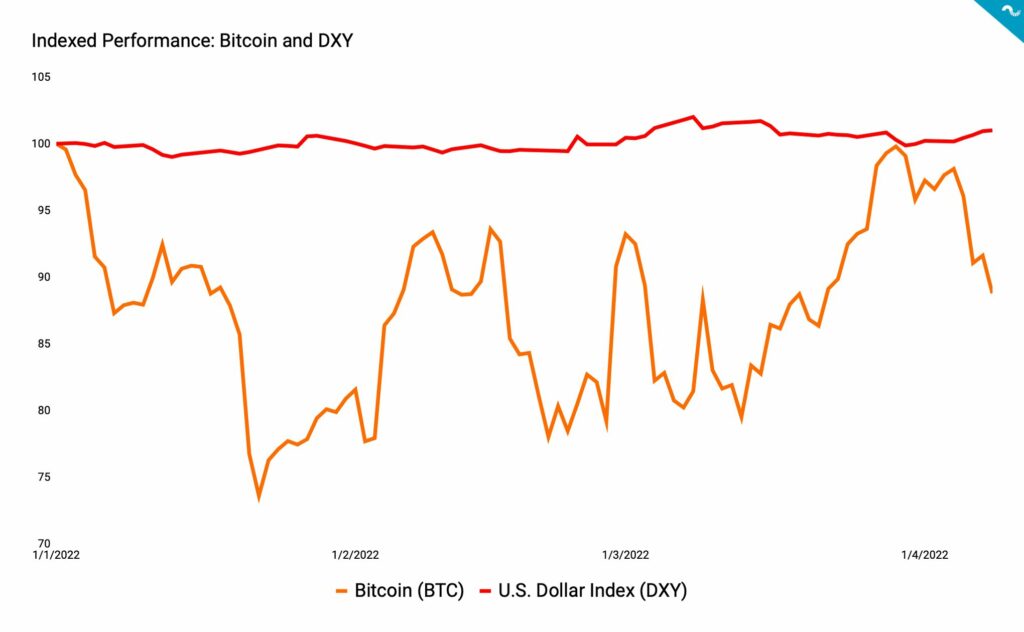
Historically Bitcoin has flourished during epochs of weakening U.S. dollar and suffered when USD is strong, vice versa. If we believe this inverse correlation to be relevant the signs are currently bearish, as the U.S. Dollar Index (DXY) (red) gains momentum while Bitcoin (orange) loses it. DXY is currently up 4,93 percent YTD and has climbed 10,58% in 12 months. However this bearish setting might be transitory and it doesn’t rule out the possibility of trend reversal.
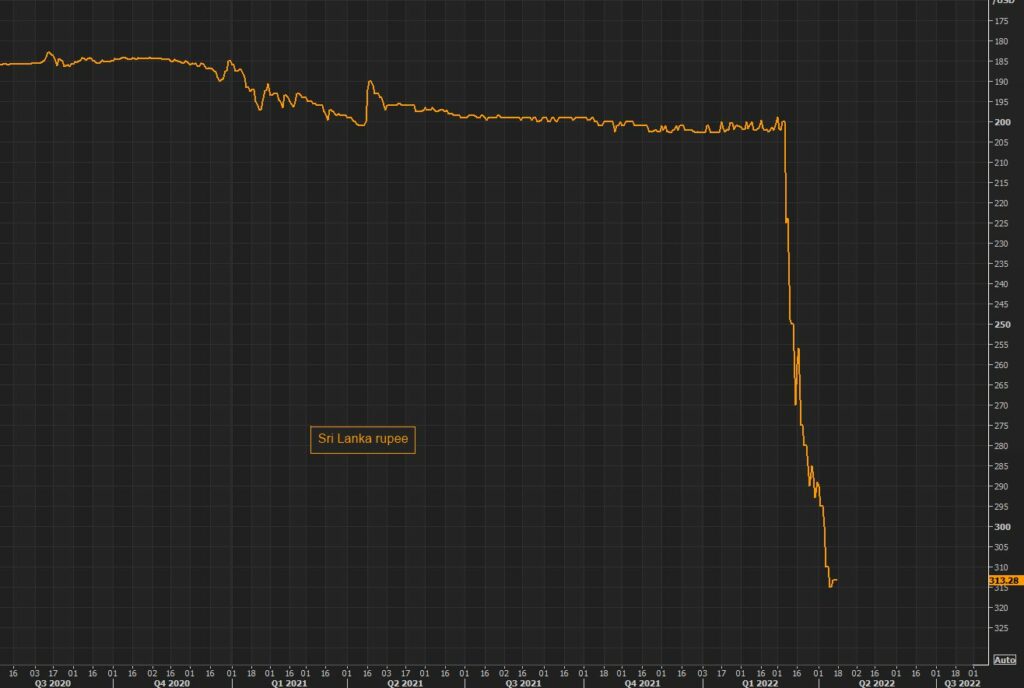
The so called “End Game” for national currencies is inching closer. The latest victim of weakening FIAT currencies is the Sri Lankan rupee (LKR) that has weakened -38% against U.S. dollar since January 2022. The LKR is currently world’s worst performing currency as Sri Lankan state is rumored to be approaching a default.
Indicator of The Week: UTXO Data Shows Accumulation and Hopium
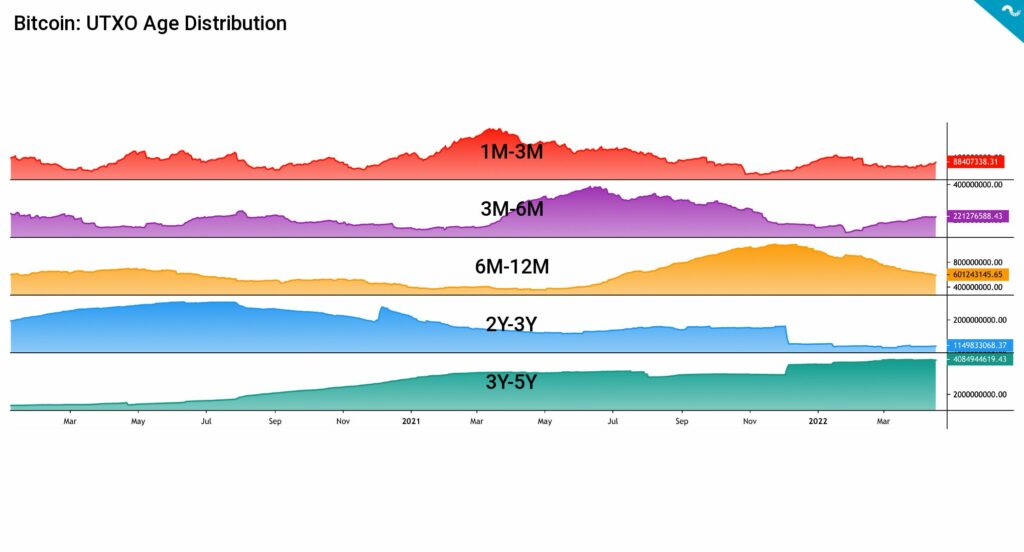
Bitcoin is a transparent system and this built-in transparency allows researchers to closely examine the transactions by UTXO data. The UTXO Age Distribution, also called as HODL Waves, helps us to interpret Bitcoin in-depth.
Although the current sentiment looks weak the UTXO data offers some hope related to accumulation. The 3M-6M wave (purple) is rising after briefly dropping in early 2022 and this indicates accumulation among short to moderate term investors. The 3Y-5Y UTXO wave (green) is also in upward trajectory, mirroring institutional-level appetite.
What Are We Following Right Now?
Michael Saylor and Lex Fridman discussing Bitcoin, inflation, and the future of money.

Supply chain mayhem in Shanghai, more inflation incoming?
Web3 slang is sometimes confusing, this tweetstorm explains most used crypto and Web3 terms.