


The TA of week 18 estimates the recent market correction and its consequences. Additionally we take a deep dive into a selection of technical and fundamental indicators.
The Great Reset
Digital assets continued their downward trajectory during week 18 and Bitcoin has printed six (6) consecutive red weekly candles for the first time in eight years. The six red weekly candles are a truly bearish technical sign. Cryptocurrencies are still highly correlated with the stock market and particularly with technology-related stocks.
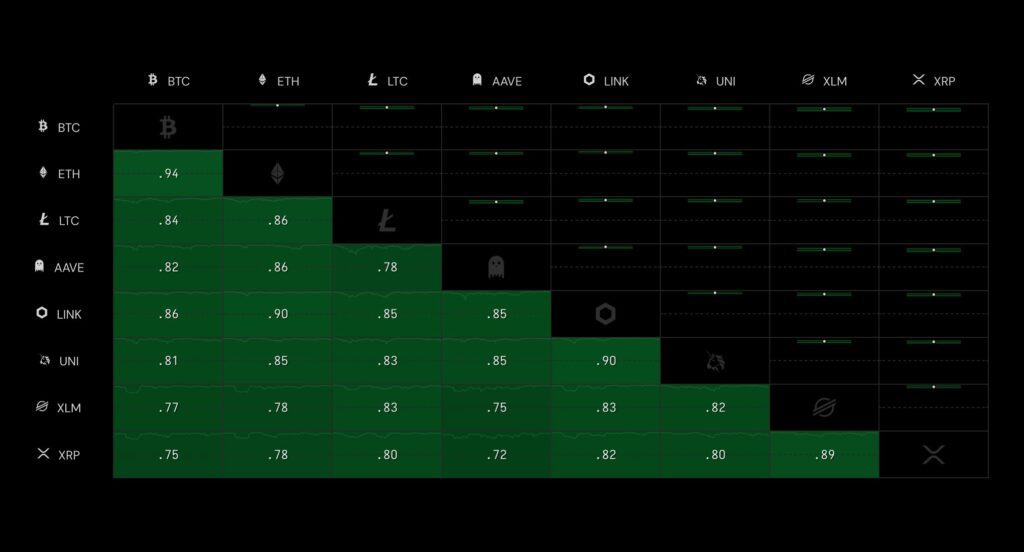
The leading cryptocurrency Bitcoin has weakened -18,3 percent in a week, closely followed by the leading DeFi platform Ethereum at -18,7%. Litecoin has weakened in close correlation with Bitcoin, and as usual DeFi tokens like Aave are down almost -30%. The general correlation between cryptocurrencies remains high, ranging from 0,8 to 0,9 for most assets.
7-Day Price Performance
Bitcoin (BTC): -18,3%
Ethereum (ETH): -18,7%
Litecoin (LTC): -17,7%
Aave (AAVE): -27,7%
Chainlink (LINK): 22,3%
Uniswap (UNI): -8,6%
Stellar (XLM): -16,1%
XRP: -15,5%
– – – – – – – – – –
S&P 500 Index: -3,27%
Gold: -2,05%
– – – – – – – – – –
Bitcoin’s Illiquid Supply: 77%
Bitcoin RSI: 32
Double Trouble for Bitcoin’s Spot Price, Exchange Reserves Up(!)
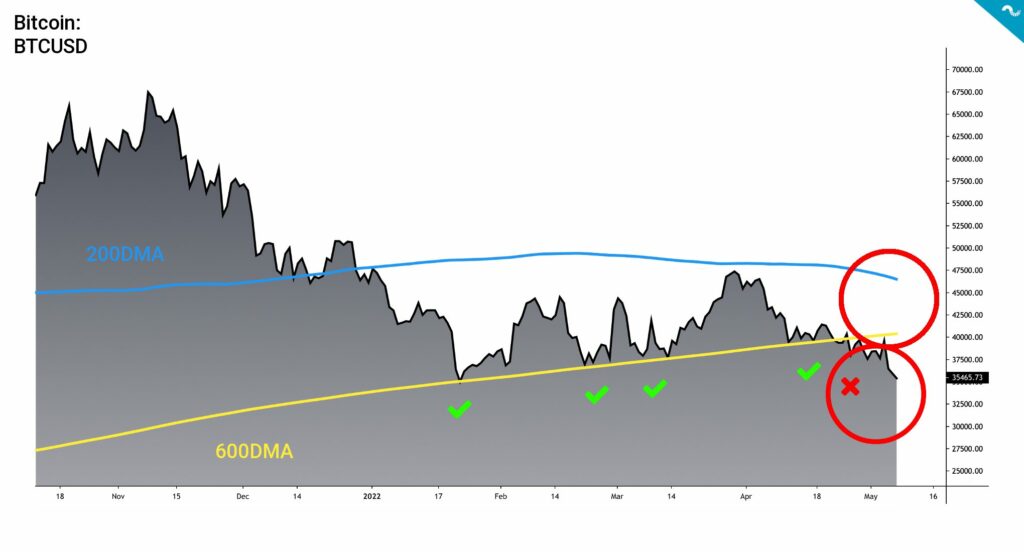
Bitcoin’s spot price breached its multi-month 600-day moving average (600DMA) (yellow) support last week, and has continued its declining trajectory since. The spot price touched the 600DMA nine times between January lows and May, testing and weakening the 600DMA each time. Eventually the 600DMA had to break and let the spot fall through.
The spot price is currently facing threats from multiple directions, as in addition to spot price weakness the 200-day moving average (200DMA) (blue) is approaching the 600DMA from above. Theses two indicators might generate a “Death Cross” setting between 200DMA and 600DMA, and that would indicate even larger downside pressure.
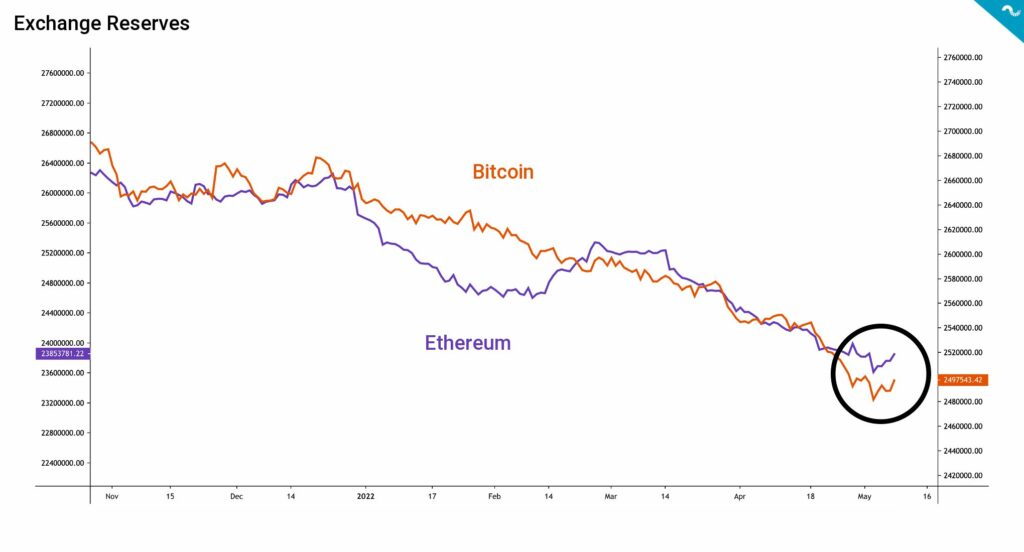
In the middle of market mayhem the exchange reserves of Bitcoin (orange) and Ethereum (violet) took a dramatic turn as they turned up within past few days. The exchange reserves have been in a secular downtrend since early 2020 and consequently this new direction is significant. By our general rule the increasing exchange reserves are a bearish signal to the market, indicating selling pressure.
↑ Increasing Exchange Reserves: Bearish, indicating bitcoin selling pressure
↓ Decreasing Exchange Reserves: Bullish, indicating accumulation to cold storage
TerraUSD (UST) and Luna Foundation Guard (LFG) Seem to Be in Trouble
Amid the huge volatility, TerraUSD (UST) has been in spotlight for its speculated US dollar peg weakness. Multiple analysts have estimated that TerraUSD might not be able to keep its 1:1 peg to the dollar and consequently the structure might even collapse.
Algorithmic stablecoins like TerraUSD are by default standalone systems that balance themselves by countercyclical adjustment, in order to maintain their peg with USD. If UST is an algorithmic stablecoin like the famous FRAX, why would it need Bitcoin reserves?
It’s possible that the structuring of Luna Foundation Guard’s bitcoin reserves has been more like a marketing campaign that cements UST’s perceived reliability. However LFG’s Bitcoin purchases have been funded with massive amount of LUNA tokens from the original ICO, representing a significant percent of LUNA supply. The funds flowing into BTC weaken LUNA’s market cap and vice versa.
LFG’s main wallet: bc1q9d4ywgfnd8h43da5tpcxcn6ajv590cg6d3tg6axemvljvt2k76zs50tv4q
LFG’s Binance hot wallet: bc1qgrt0twkr6z5ypr2f42vm82alk22m289ca260e4
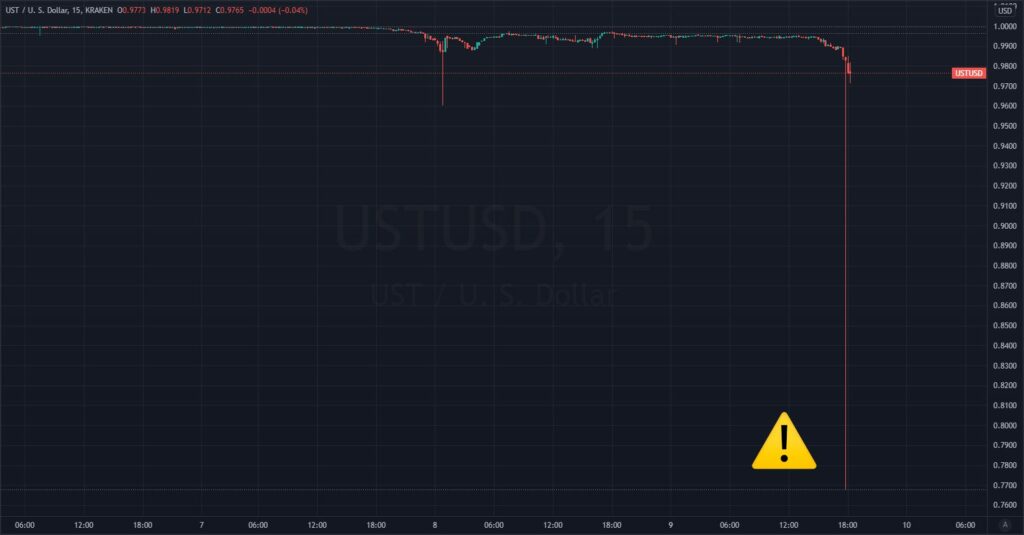
UST Falls to 0,77 USD on Kraken
As markets speculated, TerraUSD is indeed drifting into troubles as its peg to dollar is incrementally weakening. Market was stirred by the apparent fragility of the stablecoin that momentarily dropped to 0,77 USD on US-based exchange Kraken. TerraUSD was later able to retain most of its USD peg, however the stablecoin still remains in deeply unknown waters.
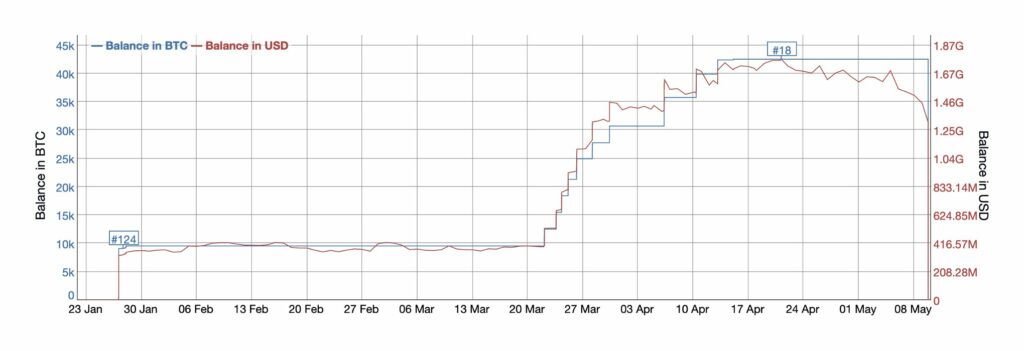
In order to support the UST stablecoin, Terra suddenly emptied its Luna Foundation Guard (LFG) wallet, previously containing more than >42K bitcoin units. These coins are consequently flowing to hot wallets, like the Binance wallet listed above, in order to be converted to support the stablecoins peg. Consequently Terra is generating selling pressure towards bitcoin, as it needs to sell BTC units in order to support UST by purchasing the asset.
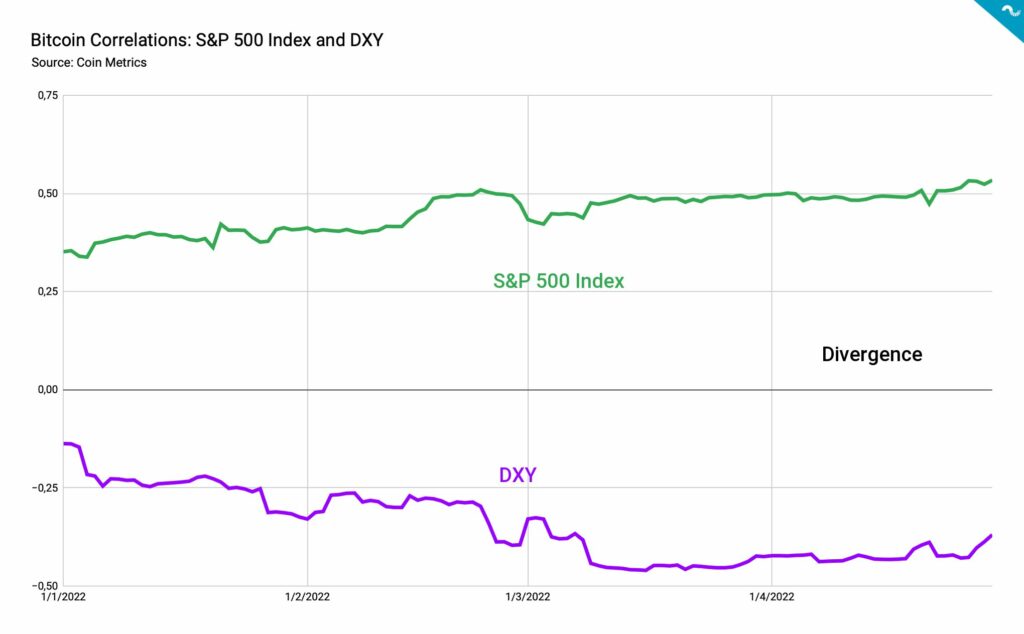
Correlations: S&P 500 Index & DXY
Bitcoin currently acts as a high beta asset and consequently it’s highly correlated with stock market indices like S&P 500 and Nasdaq Composite. It would be crucial for bitcoin to try to decouple from this correlation as the risk asset segment is currently dragging bitcoin down. I personally think the decoupling would be possible, however it’d need a spot price drop and market-wide capitulation first.
While the 90-day Pearson correlation between S&P 500 Index and Bitcoin has climbed above 0,63, Bitcoin’s correlation with US Dollar Index DXY remains heavily negative at -0,37. The dollar has been strengthening against major national currencies, including CNY and EUR. Additionally the cross-market liquidity seems to escape to dollar.
Along the years there has been speculation about the future status of the dollar and a possible “Dollar End Game” setting, where Chinese Yuan (CNY) would approach dollar’s position. However as CNY is currently weakening against USD, it’s clear that USD is still the undisputed number one national currency, and the only organic global reserve currency.
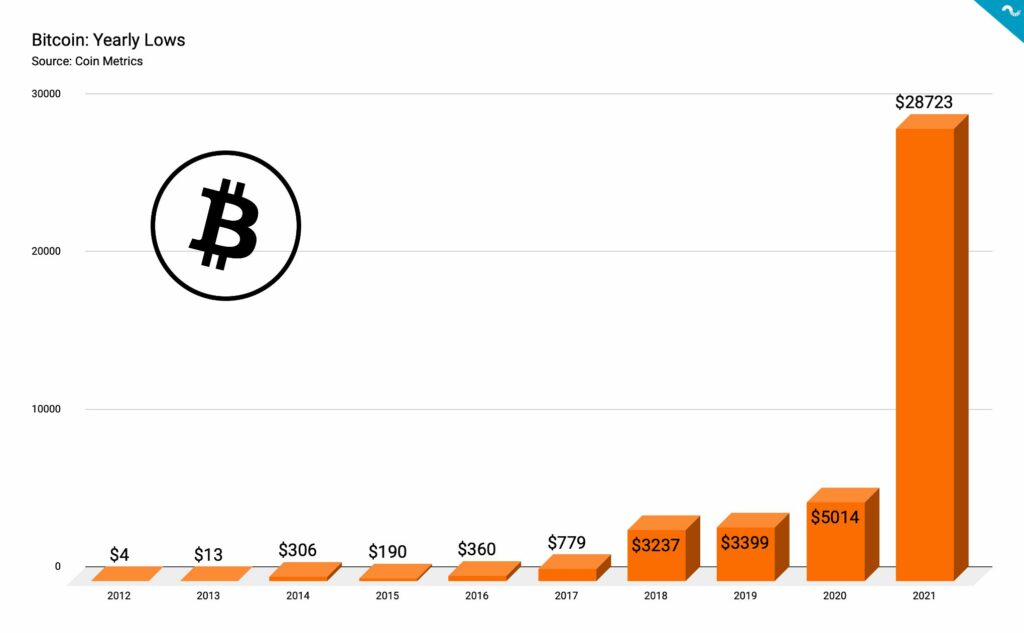
Zoom Out
Despite the spot price meltdown, it’s good to “zoom out” and take a wider market perspective. In the context of price performance of previous years, the current $30K price level is pretty decent. The yearly lows of previous years were $28723 for 2021, $5041 for 2020, and $3399 for 2019.
The cryptocurrency market is highly speculative and it has a tendency to attract a huge amount of short-term money during bull cycles. The market has a mechanism to flush out excess speculative investors and derivatives, in order to to seperate the wheat from the chaff. As Mike Belshe mentions, a 6-12 month bear cycle might actually be healthy for the ecosystem.
What Are We Following Right Now?
What countries are next to adopt Bitcoin as legal tender? Samson Mow explains.

Analyst Lyn Alden has published her May 2022 newsletter.
The market crash could spread to other asset classes, including the housing market.