


TA of week 19 explores the meltdown of Terra ecosystem and its multiplicative effects. Additionally we monitor how Bitcoin allocations increase the performance of a traditional portfolio.
Market Survives The Great Terra Stress Test
Digital assets entered yet another brutal week in the wake of Terra’s (LUNA) capitulation. The LUNA token is currently down -100 percent within last seven days and its TerraUSD (UST) stablecoin massively de-pegged from dollar, falling to current $0,16. However the big narrative here would be Bitcoin’s resilience amid the Terra meltdown, as bitcoin’s spot price weakened only -15,5% during the week of 19.
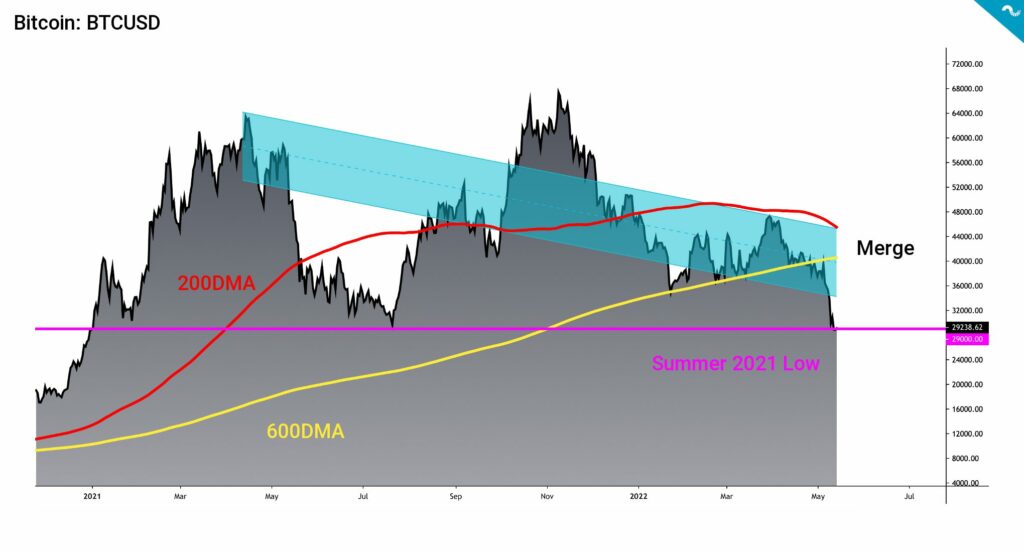
Bitcoin’s current technical chart focuses on three main themes:
A. Bitcoin falls through main 2021-2022 trendline (blue)
B. The retest of 2021 cycle lows (pink)
C. The merge of 200DMA (red) and 600DMA (yellow)
Bitcoin is currently facing a combination of bearish technical signals, as the spot price bounces on summer 2021 low of $29K. Bitcoin’s spot price has declined under the (blue) technical trendline of 2021 and 2022, and 600-day moving average (600DMA) (yellow). Additionally the 200-day moving average (200DMA) (red) is about to merge with 600DMA and drop under it. This would set off a technical “Death Cross” setting.
As usual, the altcoins have weakened more than bitcoin during Terra-induced crash and the effect is especially pronounced in DeFi tokens. Aave (AAVE) is currently down -34,4% in seven days and Uniswap (UNI) -27,1%. During market crashes the correlations have a tendency to go towards one (1) and DeFi tokens are usually categorized as higher beta assets.
7-Day Price Performance
Bitcoin (BTC): -15,5%
Ethereum (ETH): -21,8%
Litecoin (LTC): -28,1%
Aave (AAVE): -34,4%
Chainlink (LINK): -26,5%
Uniswap (UNI): -27,1%
Stellar (XLM): -17,3%
XRP: -26,8%
– – – – – – – – – –
S&P 500 Index: -2,41%
Gold: -3,82%
– – – – – – – – – –
Bitcoin’s 90-Day Pearson Correlation with S&P 500: 0,64
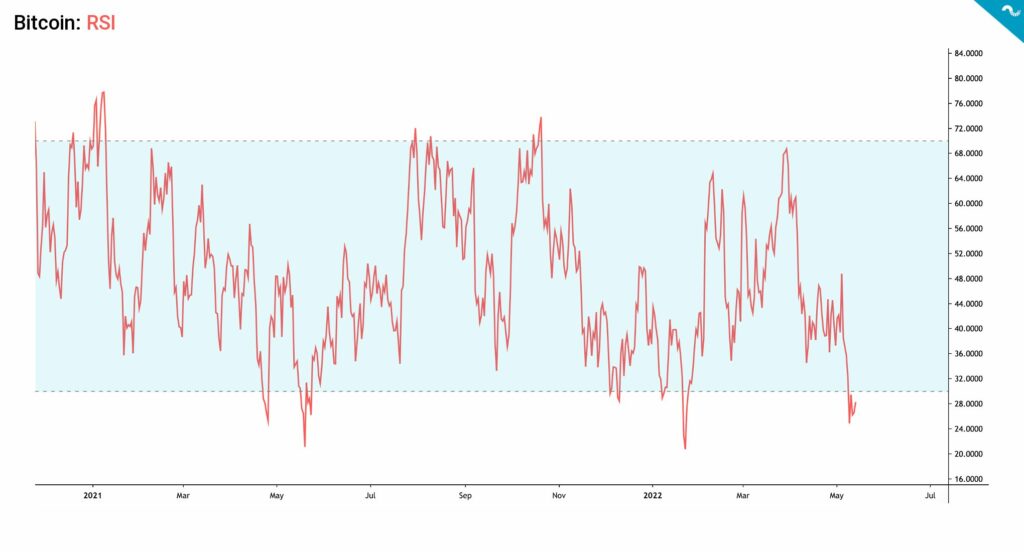
Bitcoin RSI: 28
Bitcoin’s Relative Strength Index (RSI) has dropped into 28, signaling a buying opportunity. Any value of RSI under 30 usually signals undervaluation, however in this environment some technical indicators might not be reliable. RSI is a valuable indicator during neutral or bull cycles, while in deep macro-induces bear markets might reduce its relevance. There’s still a chance for local technical breakout tough, and that would generate a relief rally. Bitcoin is also approaching the realized price of $29K, which according to analyst Lyn Alden is in “deep value zone”.
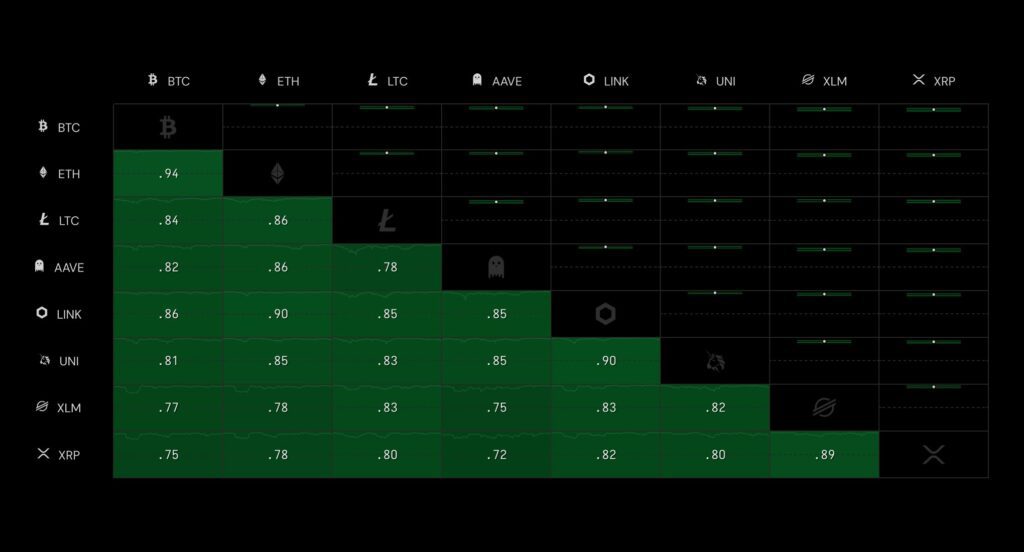
Digital Asset Correlations Reaching Towards One (1)
The 7-day correlation between cryptoassets seems to be ever-increasing and ETH-BTC correlation has reached value of 0,94, which is exceptionally close to one. Additionally Chainlink (LINK) has reached a 0,9 correlation with Ethereum (ETH) and Uniswap (UNI).
Bitcoin is still particularly correlated with technology-related stocks, however we expect the correlation to weaken over time. The decoupling will be supported by the decreasing amount of speculative money as the cheap dollar has been uplifting most asset classes since 2020’s quantitative easing. Instead of QE, Fed’s current policy focuses on monetary tightening (QT).
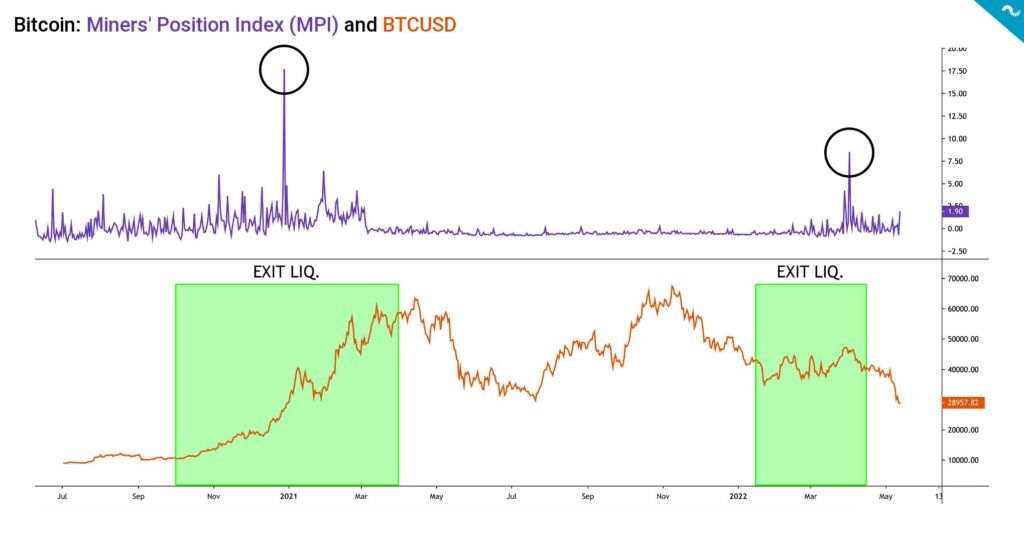
Miners’ Position Index Shows Moderate Selling Pressure in April
While bitcoin’s technicals look somewhat bearish, multiple fundamental indicators are still in neutral to positive zone. One of these indicators is Miners’ Position Index (MPI) (purple) that looks relatively flat despite the challenging market environment. The MPI mirrors miners’ average liquidation behavior compared to the historical average. Miners’ Position Index shows two significant spikes in early 2021 and 2022, but miners are currently not generating significant selling pressure to bitcoin’s spot price.
Mining operations generate significant costs and miners have a need to cover these costs by selling the bitcoin supply they mined. However miners also need a liquid market that can absorb the inflow of selling pressure, this is why we saw significant selling pressure in the bull cycle of early 2021 (Exit Liquidity, green). Miners also had another opportunity for exit liquidity as bitcoin spot price ascended from August to November. Miners prefer to sell against the strong spot price in order to minimize the effects on the market. Nevertheless during early 2022 sell-off they had to de-risk against a weaker spot price.
As a summary miners prefer to sell during bull trends in order to maximize liquidity. Huge amount of miner selling during a bear cycle would likely collapse bitcoin’s spot price and that would disrupt the miners themselves.
↑ High MPI: More Selling Pressure by Miners. Bearish
↓ Low MPI: Less Selling Pressure by Miners. Bullish
Bitfinex Whales in Accumulation Mode?
Despite the bearish market sentiment the long derivative contracts of Bitfinex exchange recently reached all-time highs (ATH), hitting 75 300 BTC. As mentioned earlier the technical indicators like low RSI might offer an opportunity for a relief rally and increasing longs would support this thesis.
Bitfinex is known to be a preferred exchange for whales and it’s also the corporation behind popular stablecoin Tether (USDT). Whales and institutional money have a tendency to buy bitcoin during times of spot price weakness, effectively counter-trading the market. In this market composure the whales would be accumulating, while the retail segment capitulates.
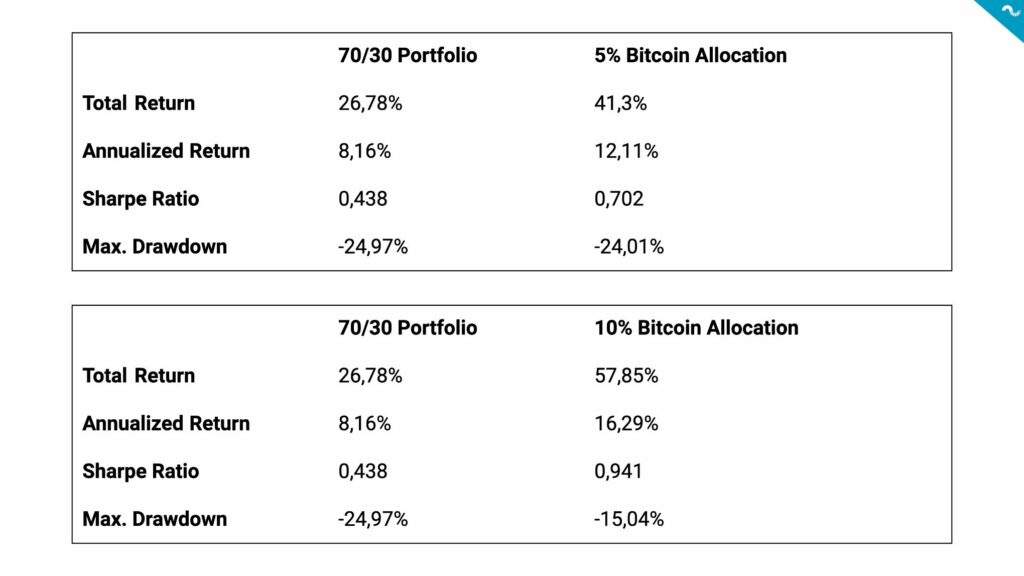
5-10% Bitcoin Allocation Enhances Portfolio Performance Significantly
Coinmotion Research recently built a Bitcoin allocation model, which compares the performance of 70/30 portfolio to different Bitcoin allocations. In our model we took a 36 month perspective to a portfolio constructed of 70 percent of stocks and 30% of bonds.
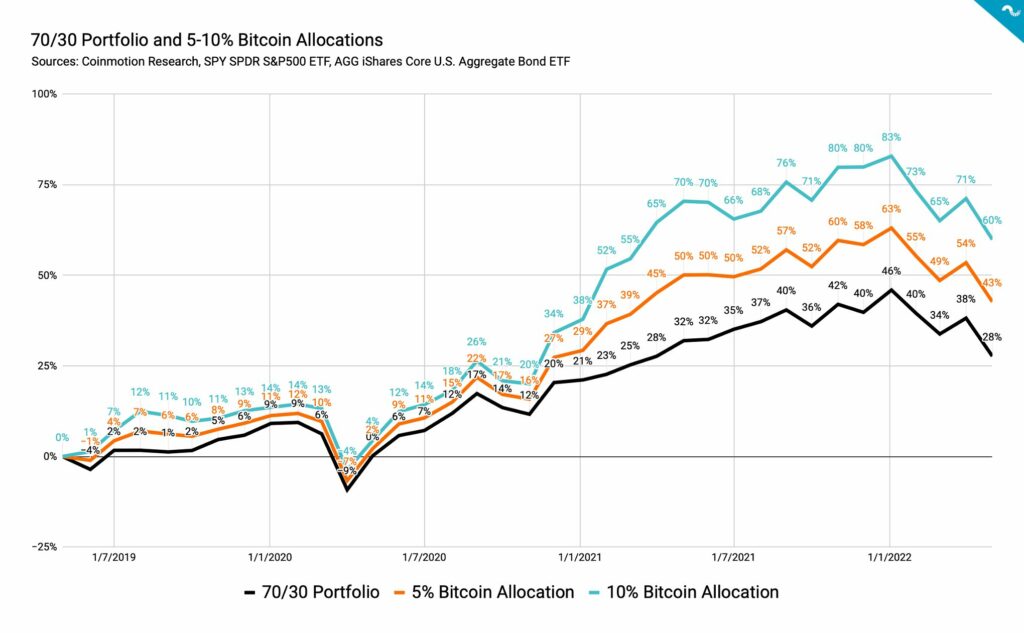
While the traditional portfolio grew 28% during past 36 months, a 5% bitcoin allocation uplifted the performance to 43%. A 10% bitcoin allocation boosted the portfolio performance even more, rising it to 60%. The risk/return metric Sharpe ratio was 0,438 to the traditional portfolio and a 5% bitcoin allocation increased it to 0,702. A 10% bitcoin allocation increased the Sharpe ratio further into 0,941. As summary even a relatively small bitcoin allocations have been greatly increasing the performance of traditional portfolio within past three years.
What Are We Following Right Now?
Analyst Lyn Alden argues that market has already priced in the quantitative tightening (QT).
Analyst Lyn Alden evaluating the meltdown of Terra ecosystem.
MicroStrategy’s Michael Saylor says bitcoin should drop to $3562 before the company gets margin called. This makes a MicroStrategy margin call situation extremely unlikely.