The technical analysis of week five dives into bitcoin’s fresh upward momentum and its possible decoupling from stock market. Additionally we explore metrics like Coin Days Destroyed and Taker Buy / Sell Ratio.
Bitcoin Breaks 3-Month Downtrend, Gains Upward Momentum
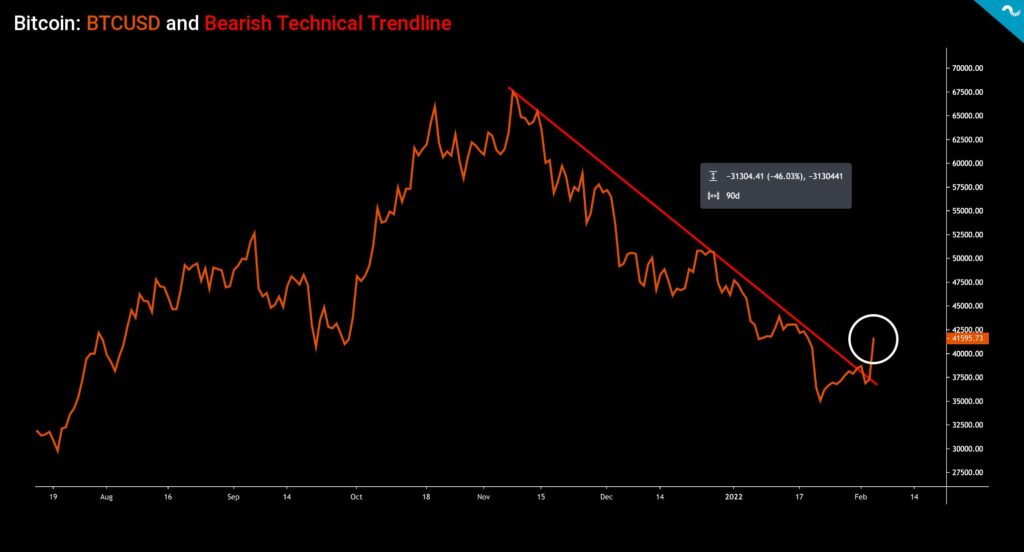
Bitcoin surprised the markets again by rising almost 10 percent in the Friday rally of February 4th. Consequently bitcoin’s spot price has strengthened 9% within last seven days and 18,5% in two weeks. Ethereum took a huge leap on Friday, rising up to 16%.
7D Price Performance
Bitcoin (BTC): 9%
Ethereum (ETH): 16,1%
Aave (AAVE): 11,6%
Meanwhile bitcoin’s 10% spot price hike is good per se, it unfolds a larger macro-level technical shift as the long bearish trend line (red) has been broken after falling for three consequent months. During this 90-day bearish trendline from November 2021 to February 2022 bitcoin’s spot has weakened -46,03%.
Bitcoin’s daily volume still remains low at $16,11 billion on February 6th, compared with $105,43 billion peak volume in November 2021. However multiple on-chain indicators have revealed increasing signs of capitulation and whales have been in accumulation mode since Q4 of 2021.

Coin Days Destroyed (CDD) Indicator Shows a Possible Market Bottom
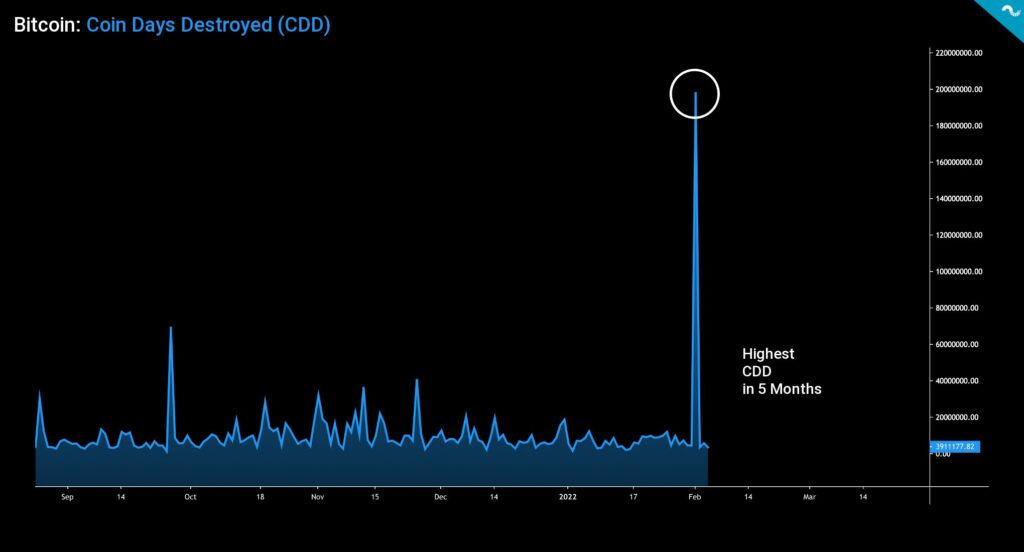
Meanwhile bitcoin’s spot price broke its long-term bearish downtrend, on-chain indicators like Coin Days Destroyed (CDD) are showing signs of capitulation. CDD peaked during early February, effectively showing a bunch of long-term coins being liquidated. As the spot price rebounded afterwards, CDD might signal a local market bottom.
CDD essentially highlights the position of long-term holders (LTH) and is considered as an alternative to basic transaction volume metric. Each unspent day for a bitcoin unit adds a “coin day” and when that coin is eventually spent, the unit uplifts the Coin Days Destroyed metric. CDD can be interpreted with following logic:
↑ High CDD: Selling pressure from long-term investors, bearish
↓ Low CDD: No significant selling pressure from long-term investors, bullish

Is Bitcoin Decoupling from (Technology) Stocks?
Bitcoin’s 10 percent updraft on Friday wasn’t accompanied by any major asset class and S&P 500 Index remained flat alongside gold. This raises the question: Is bitcoin about to decouple from the stock market? Bitcoin has recently been criticized for being too correlated with tech stocks, as the 60-day Pearson correlation has climbed to 0,5. However we should remember that all correlations have tendency to move towards one (1) in heavy market corrections.
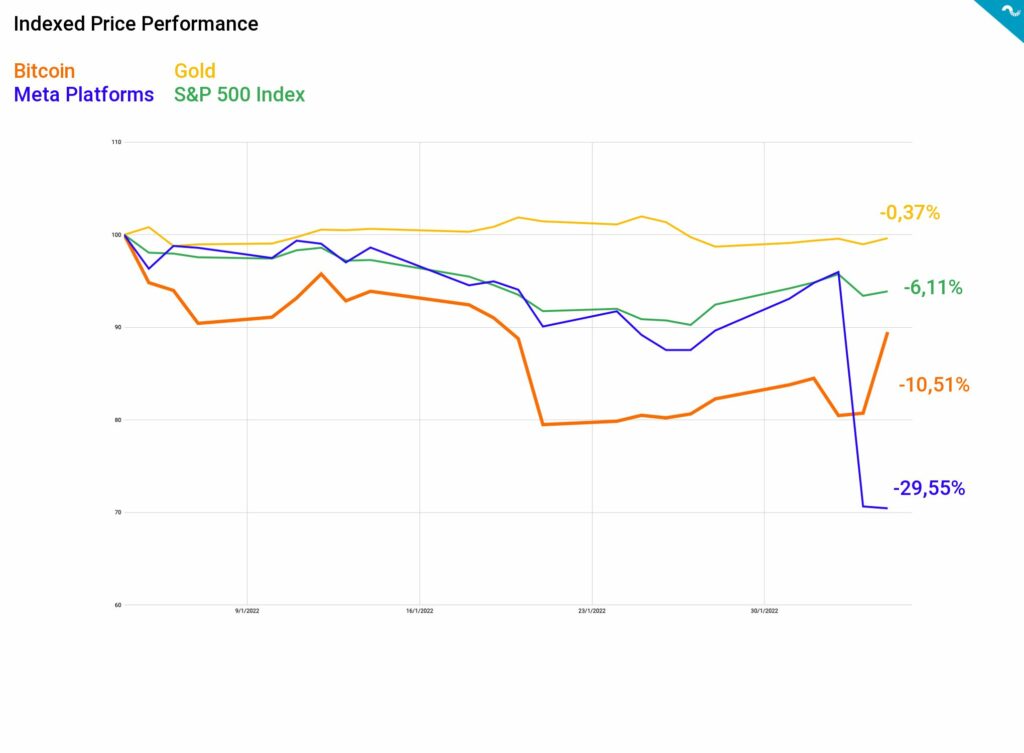
As a reference one of the most famous technology-related stocks Meta Platforms Inc, or perhaps better known as Facebook, crashed over -25 percent between 2nd and 3rd of February. Amid this market disruption bitcoin climbed almost 10%, seemingly being inversely correlated with the Meta. It seems that bitcoin is not that correlated with tech stocks after all. Bitcoin’s current market capitalization of $787,6 billion is relatively close to Meta Platform’s market cap of $659,53B.
Metaverse Platforms had a particularly rough start into 2022 as the stock has dropped -29,55% year-to-date (YTD). Bitcoin’s launch into 2022 seemed weak as well, however with the latest rebound it has only weakened -10,55% from January 1st. S&P 500 Index has been sliding down the hill, dropping -6,11%, while gold has been relatively flat at -0,37%.

Taker Buy / Sell Ratio Signals Weakening Selling Pressure
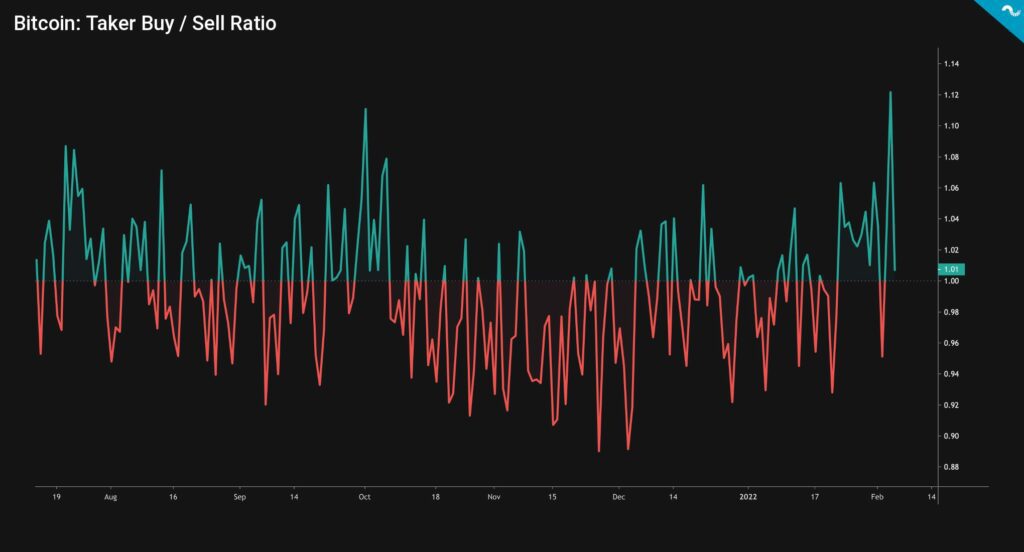
Bitcoin’s Taker Buy / Sell Ratio has climbed well beyond one (1), indicating that bulls are taking control of the market. The ratio reached 1,12 on 4th of February and the ratio was last time above 1,1 in October’s bull cycle. Taker Buy / Sell Ratio supports the recent breakout momentum of bitcoin’s spot price and together they form a setting for further price increase. The ratio can be interpreted with following logic:
Taker Buy / Sell Ratio > 1: Bullish Sentiment
Taker Buy / Sell Ratio < 1: Bearish Sentiment

