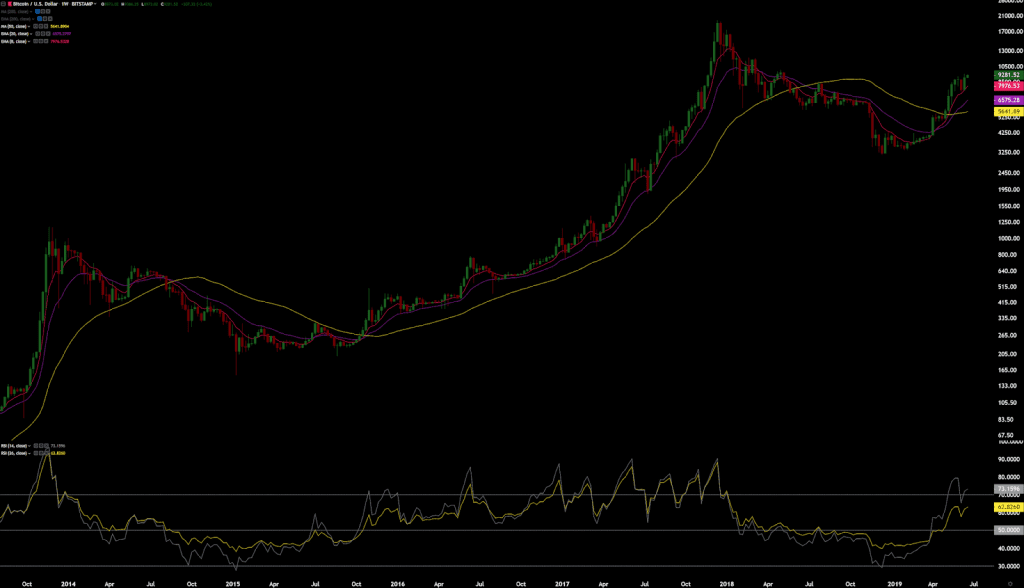
I have been writing bitcoin price analyses for Bittiraha over 4 years, 102 in total and now I’m starting to do it here on Coinmotion’s blog too in English. I’ll start from longer term view and then we’ll see where we might be heading next on the shorter term.
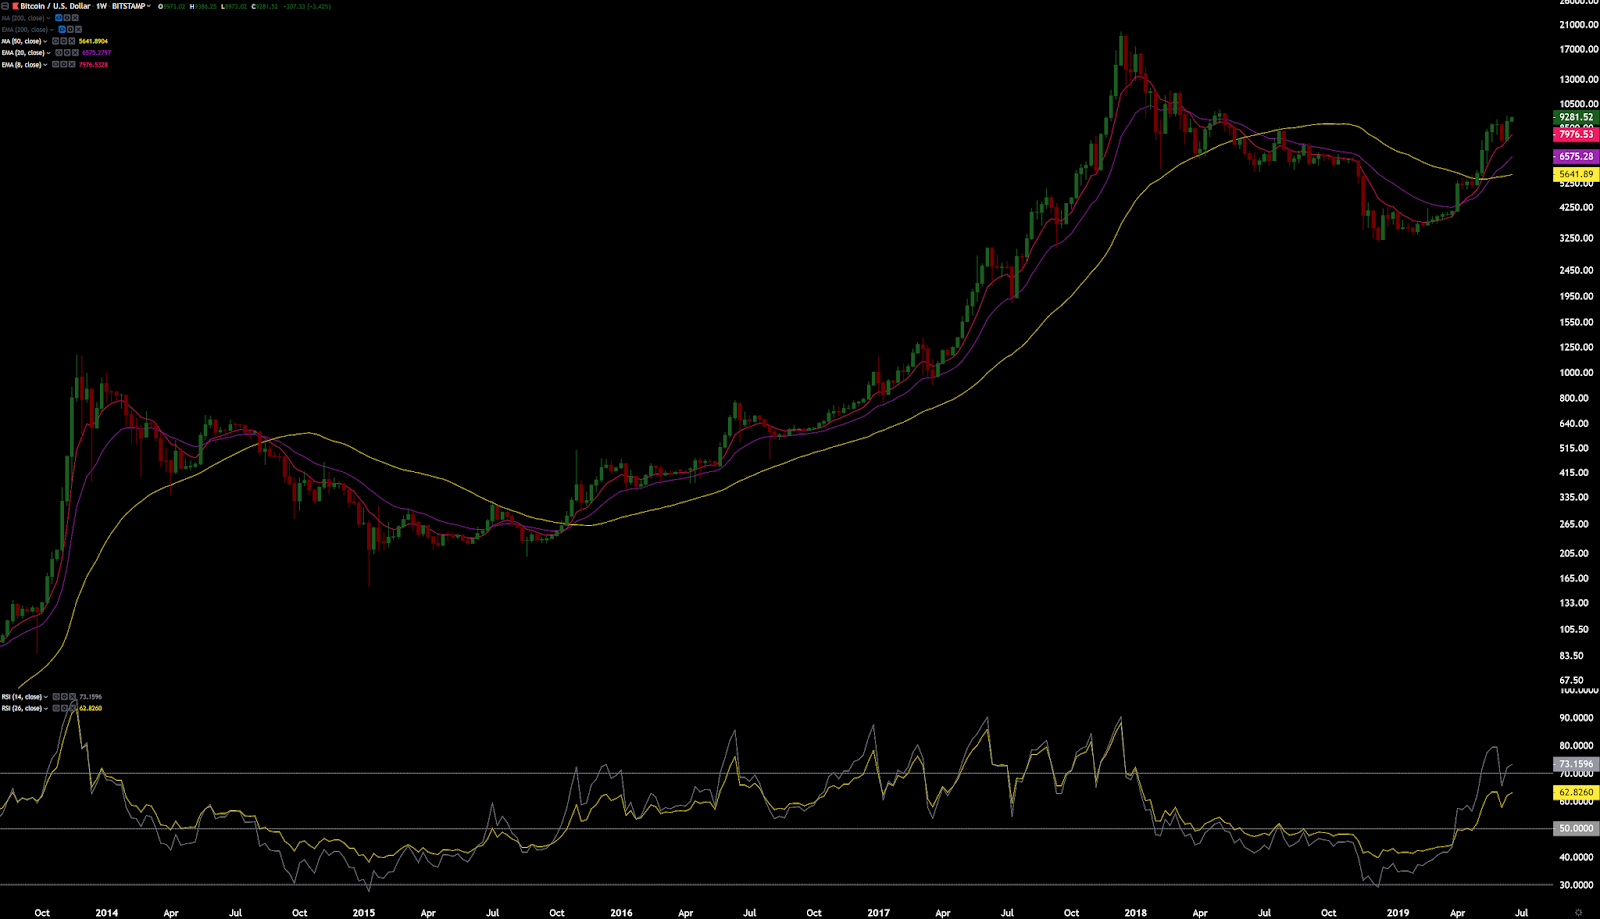
Using simple moving average to define bear and bull markets
I use the simple moving average from 50 weeks (SMA50) to define, if we are in a bull or bear market. Then in the bull market the exponential moving averages from 8 and 20 weeks (EMA8 and EMA20) have been proven to be good supports for the bull rally.
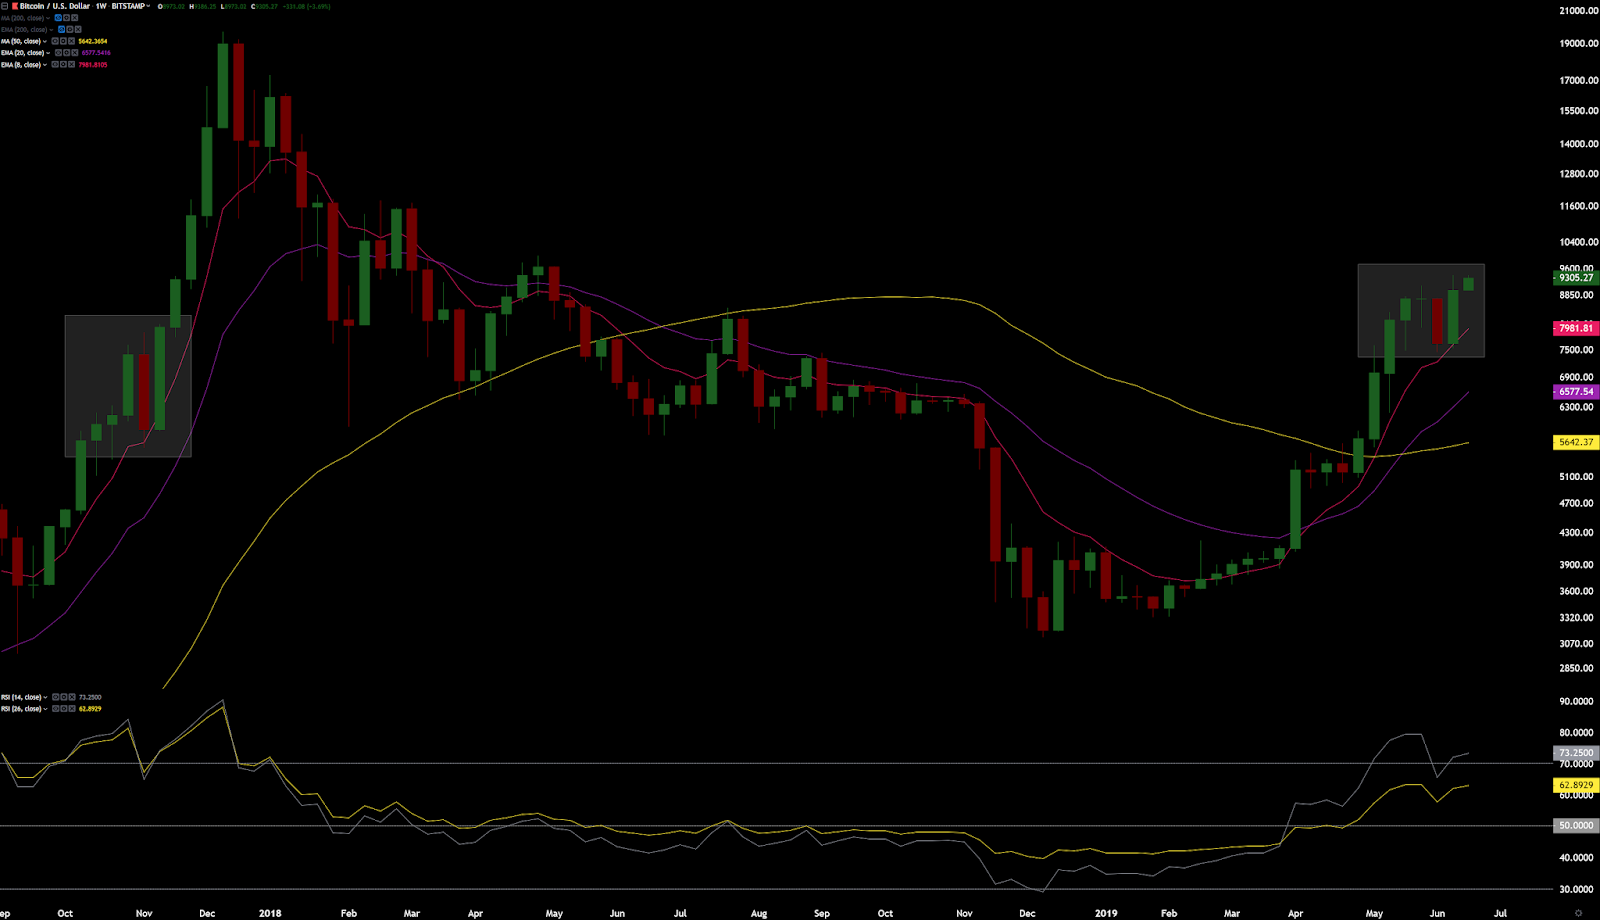
As we can see the current rally started to get a lot of strength once the weekly closed above the SMA50 and now the first correction after that on weekly chart (the red candle) stopped at the EMA8.
This kind of reaction is a sign of strength. There was only one similar correction on our previous bull market, which is shown on the chart above. Strong enough reaction from EMA8 so that the weekly candle closes above the previous red candle’s opening price.
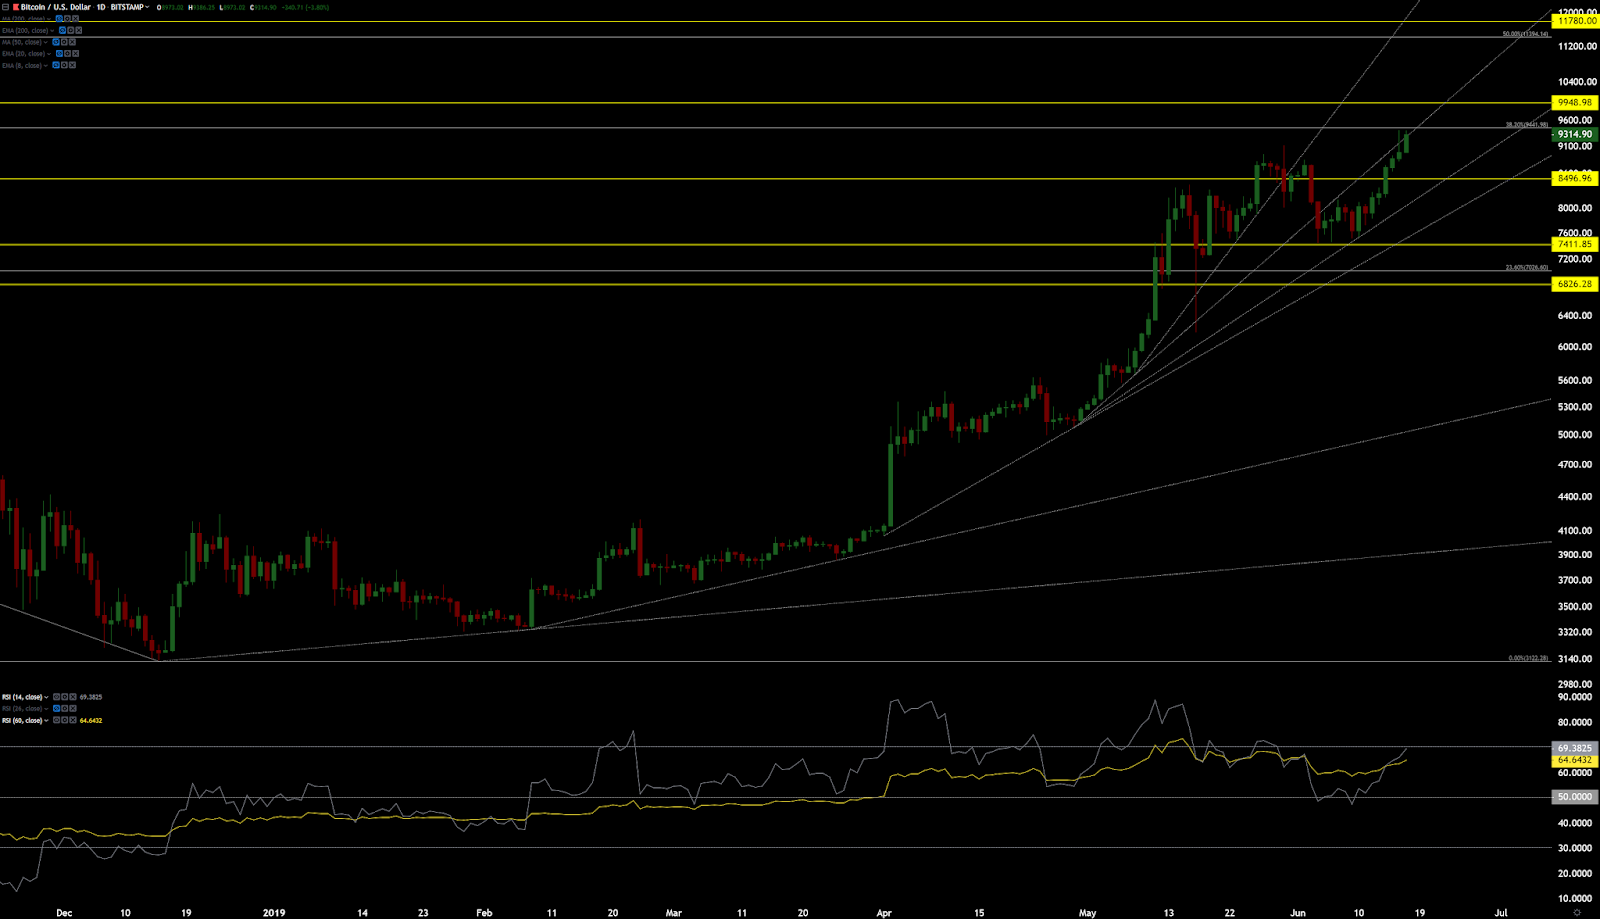
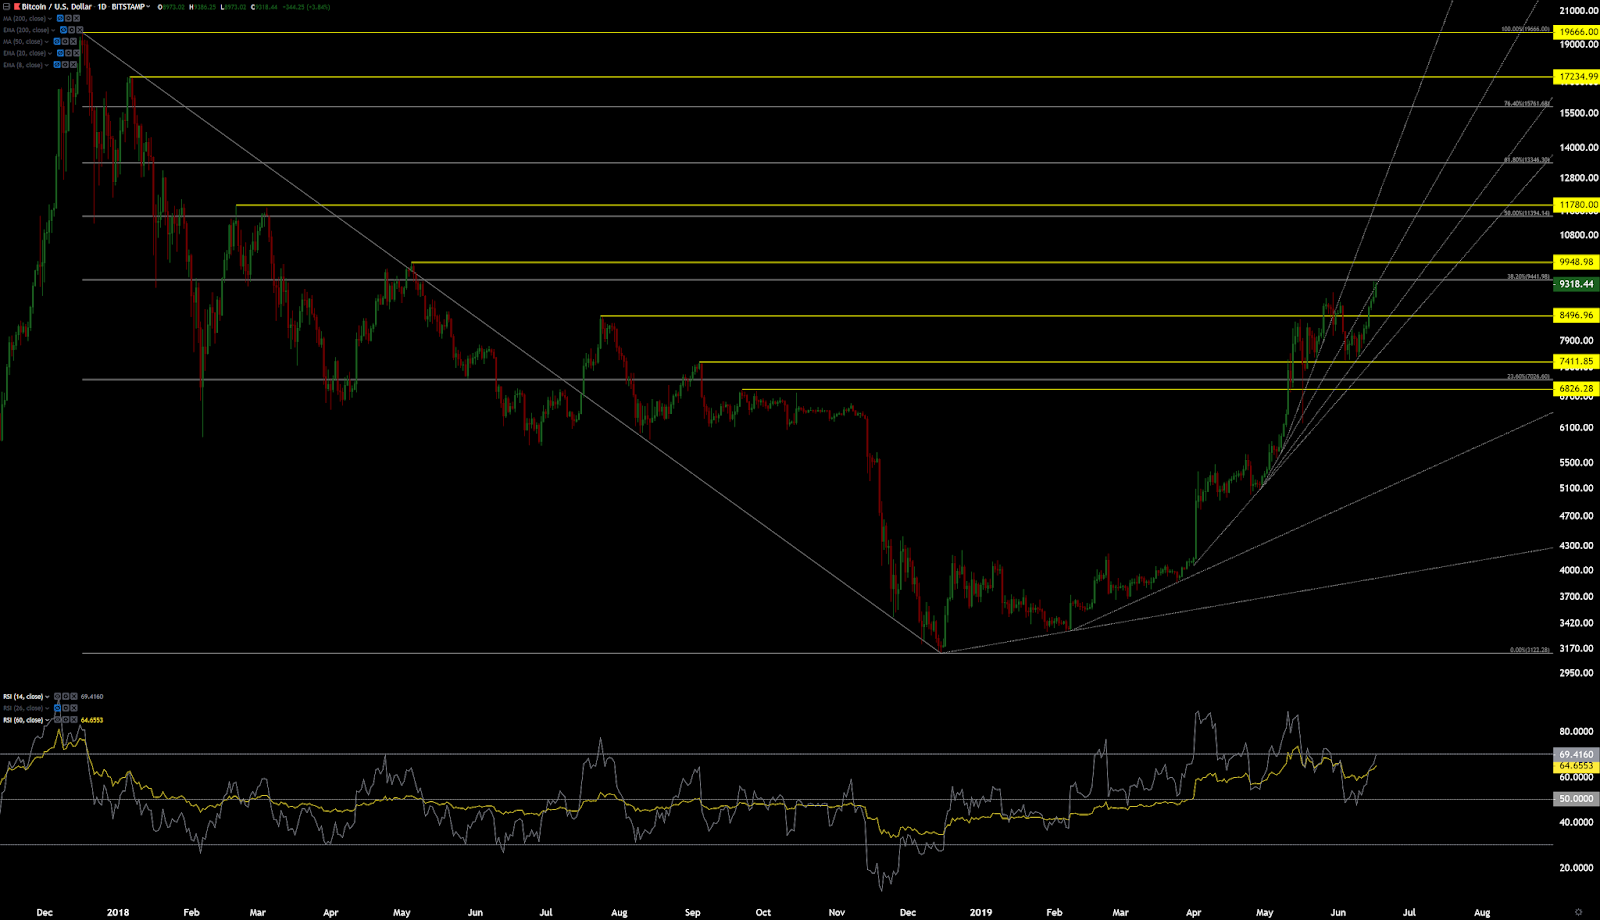
We do have bear divergence on the daily RSI and we are at the 38.2% fibonacci level and there is also daily ascending trendline here, but the weekly reaction from EMA8 is so strong that I suspect, that we have the power to go to at least where the next area of resistance is. That is at 50% fibonacci and the 11780 dollars top.
So we probably need more up before a bigger correction that likely goes to the weekly EMA20. The slower 60 days daily RSI (yellow) could go over 70 again and even make a bear div after that in this case.
