


I wrote the following in an analysis published two months ago:
‘The yellow 50% fibonacci level is the obvious target, especially since the green top candles open (monthly open) is almost at the same price level at 8500 dollars. Decent panic sell-off would take the price for a short time to 7726 dollars or even to the yellow 62% fibonacci at 7231 dollars, but these are more riskier targets in my opinion.’
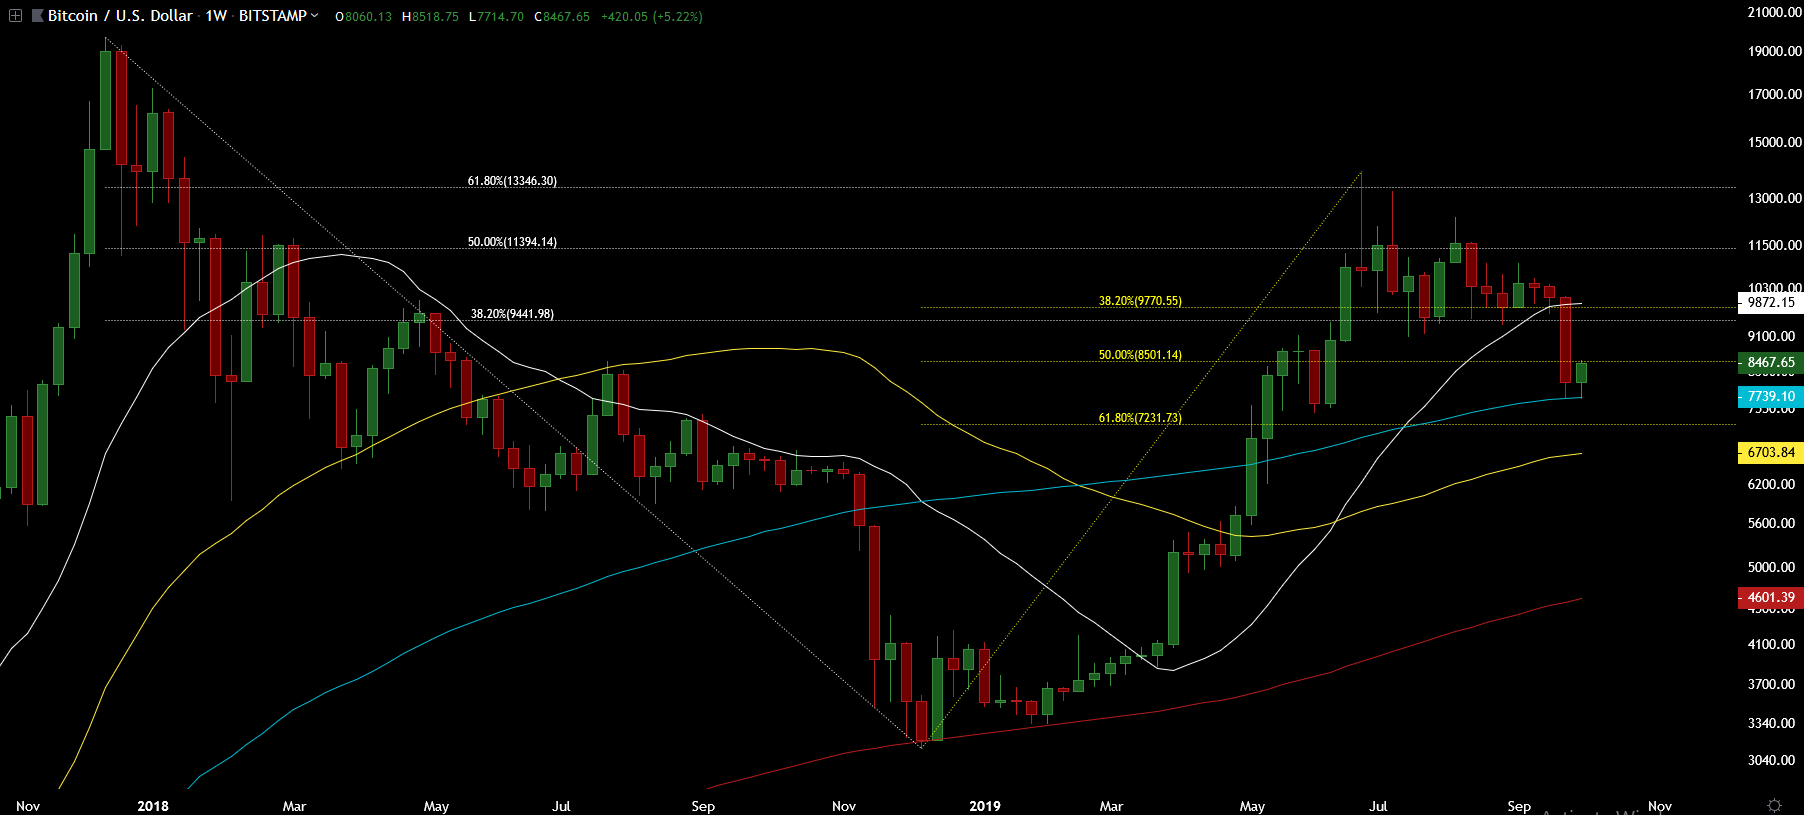
Weekly chart with simple moving averages (SMA) from 20 weeks (white), 50 weeks (yellow), 100 weeks (green) and 200 weeks (red). Chart also has fibonacci levels from the bear market (white) and from the current rally from $3122 bottom (yellow).
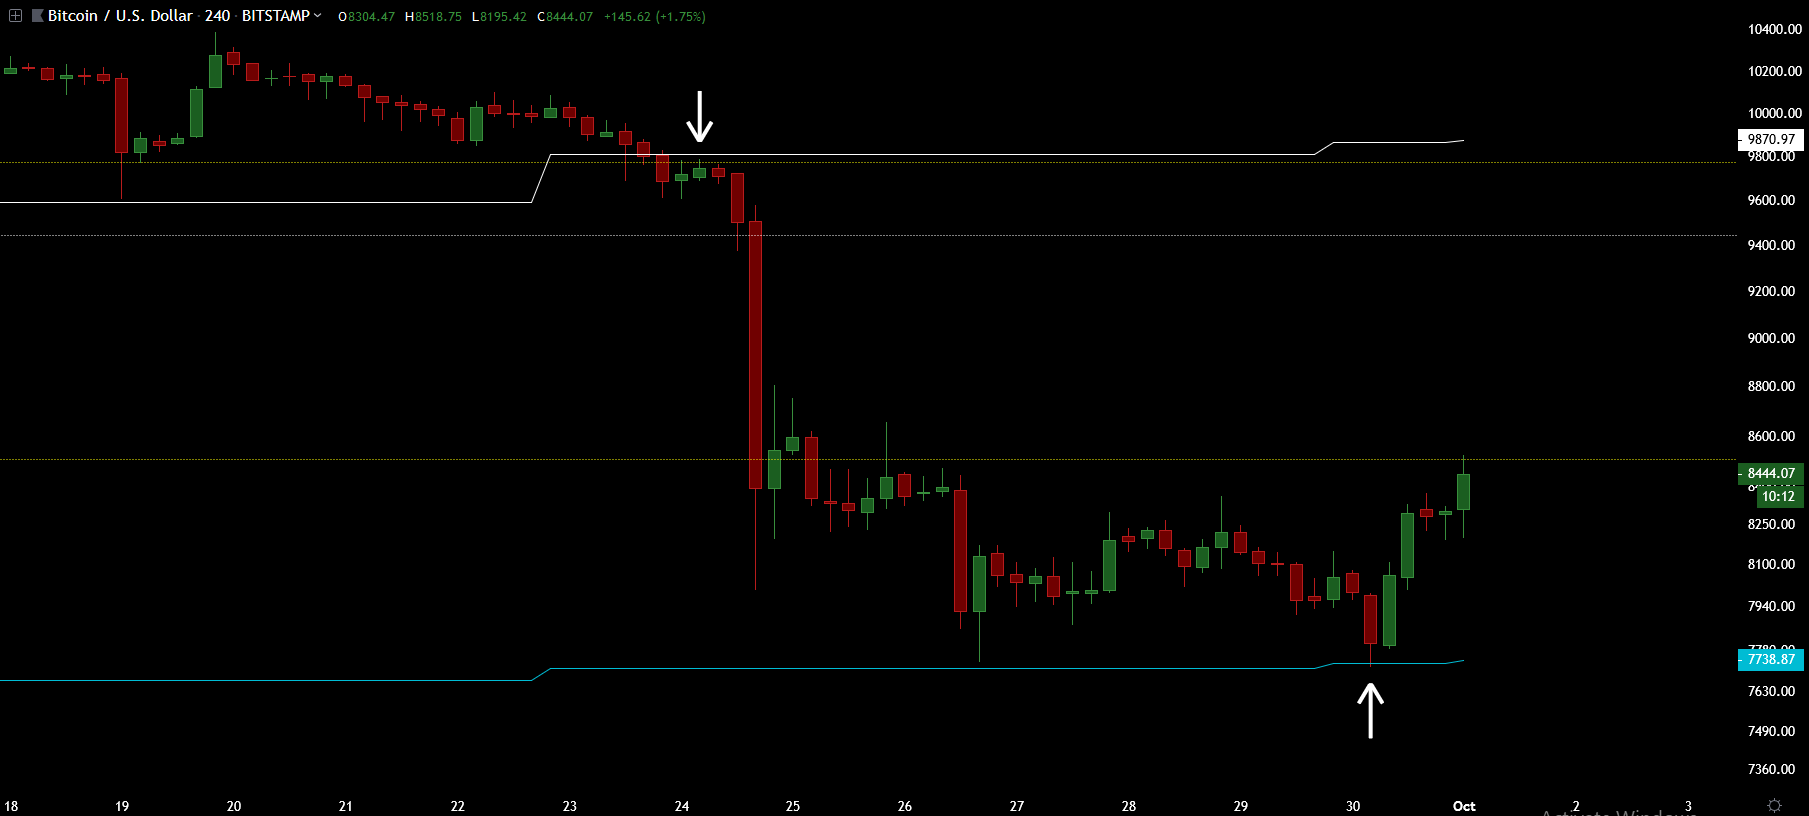
Same SMA’s and fibonacci levels on 4h chart.
Price broke down from the consolidation following the $13880 top. SMA20 did not support the price at the end. Once 4h bars went below the SMA20 price started to drop quickly. Now it has hit the SMA100 and is having promising move up.
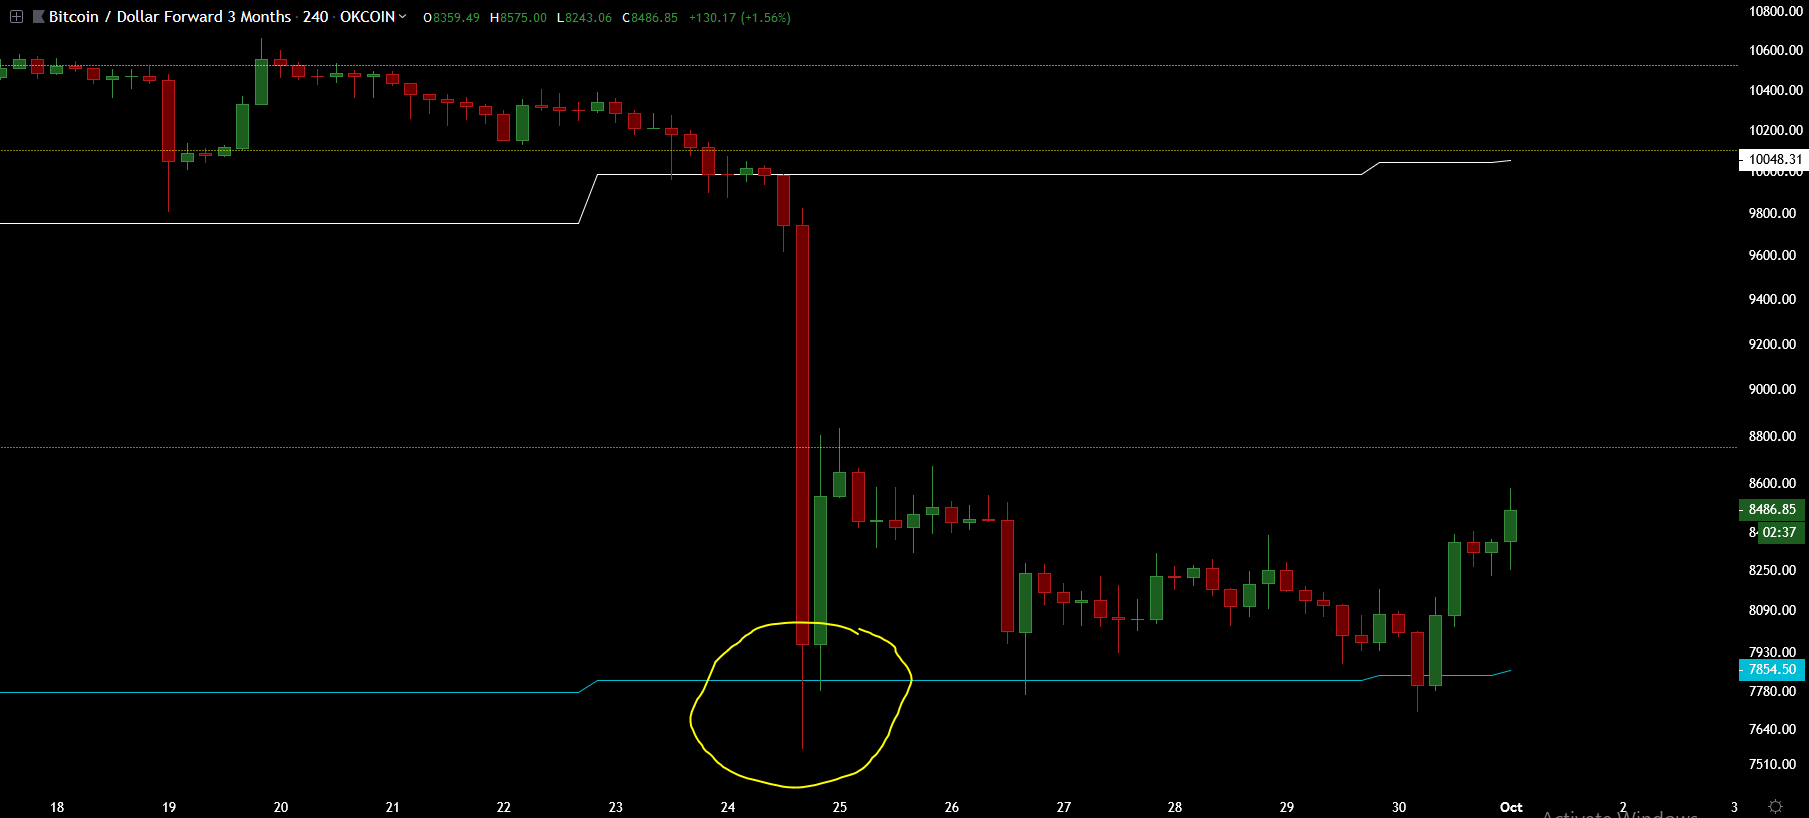
Same SMA’s and fibonacci levels on 4h chart on Okex 3 month futures.
We had a huge margin long squeeze on that first drop. This makes me trust this support even more. This whole drop could have been to margin call as many longs as possible before the rally up continues.
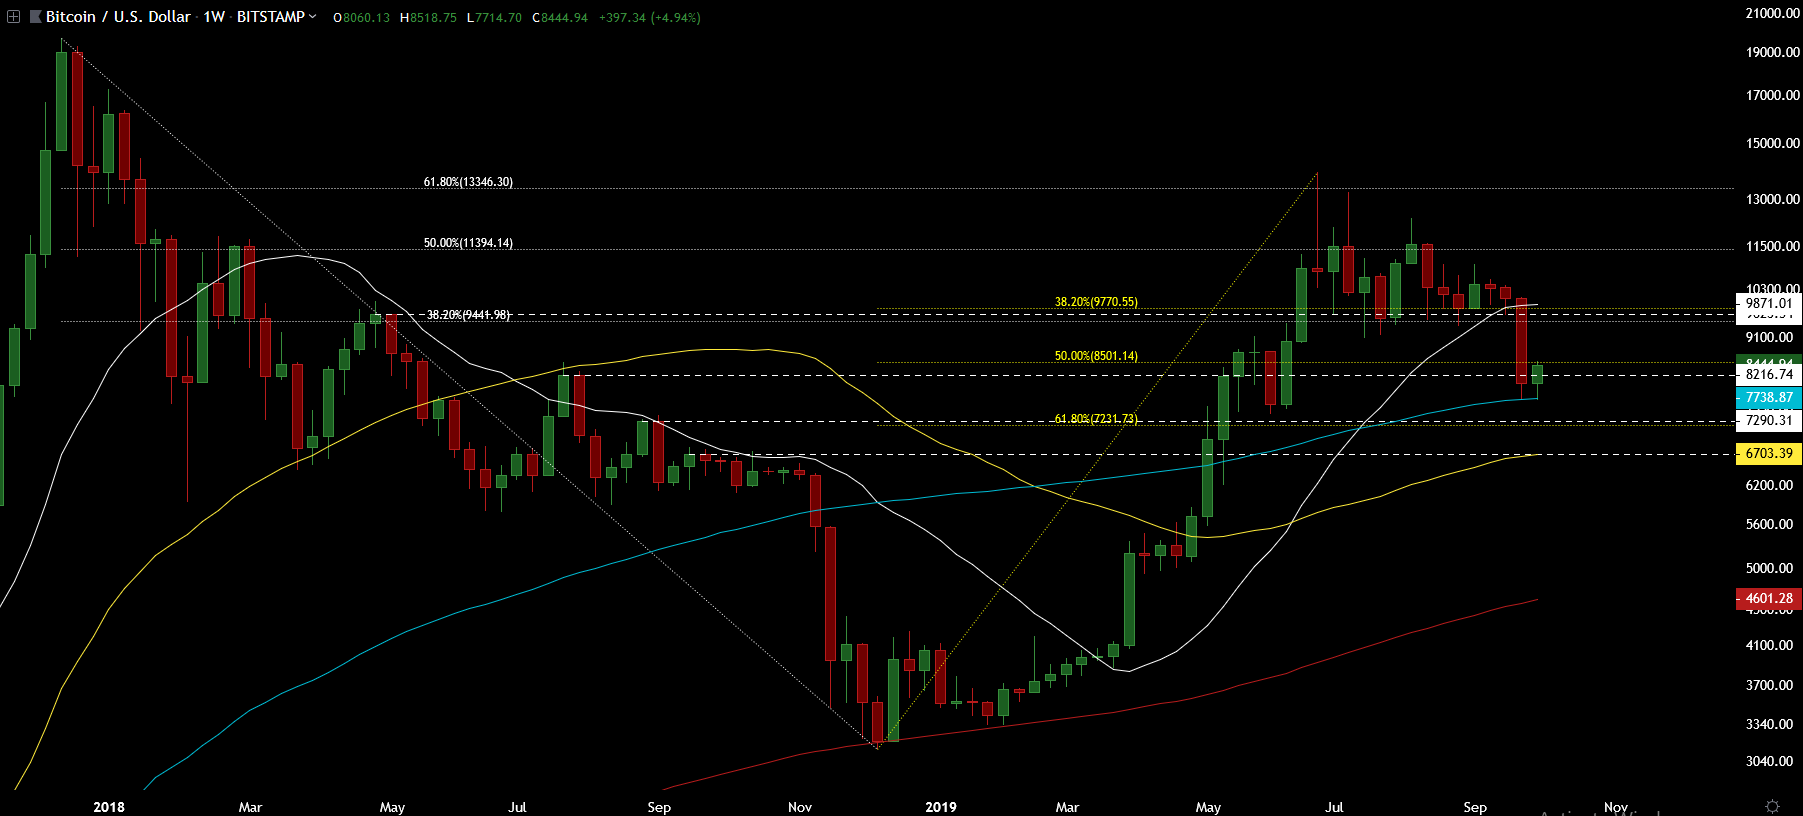
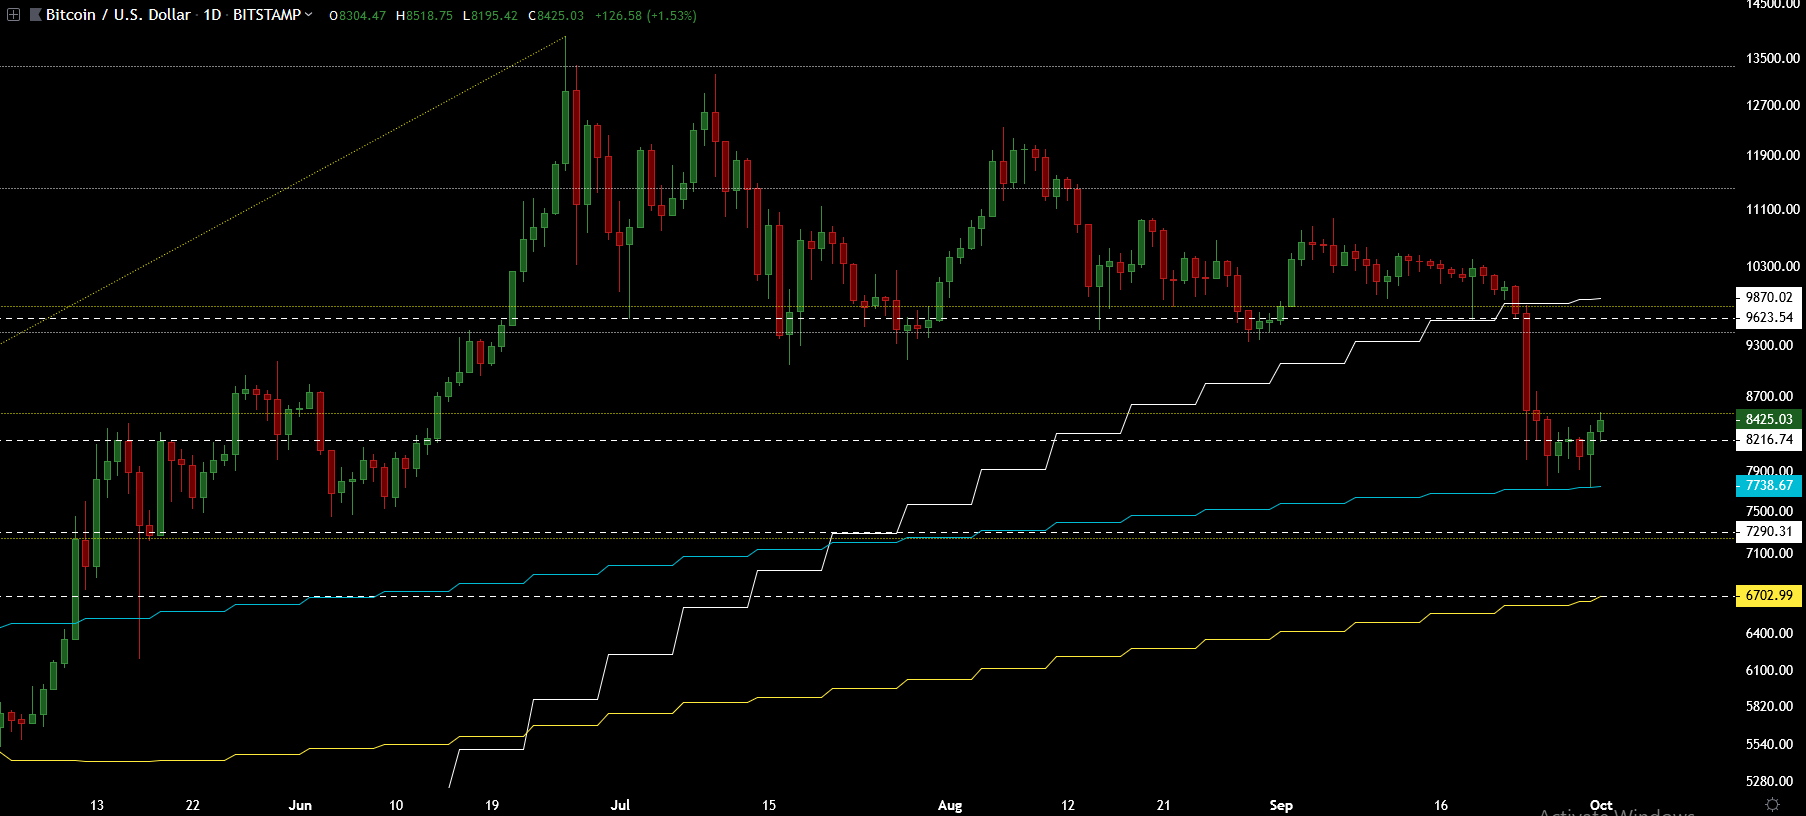
Same tools in weekly and daily chart with few important horizontal lines.
Let’s see the resistances above which might be stopping the rise in the case, if this was indeed the bottom for now and also we have to see the supports below which would be stopping further decline in case this support we hit does not hold.
Right now we are at the yellow fibonacci level at $8501. If we get above this, the price will probably pump fast to break down level where there are white 38% fibonacci at $9441, weekly horizontal line at $9623 and the weekly SMA20 at $9870.
Going above these right away would mean going for new highs above $13880 most likely and then to test the all time high. This would make this whole drop from above weekly SMA20 look like that long squeeze bear trap. It might also very well be that we get to the $9441-9870 area and turn down at least for a small pullback, if not anything else. Traders have to pay attention to reactions on this area, if we get there.
What comes to resistances, if we break this SMA100 then the next support is weekly horizontal line at $7290 and very close to the white 62% fibonacci level at $7231. Long term 62% fibonacci levels are always strong support/resistance levels, especially with weekly horizontal support there too.
Next one down would be the weekly SMA50. I have many times written about the importance of this moving average. If we ever get there, it would most likely be a very strong support level. Breaking this would get me worried, if we are in bull market after all.
As a recap; bull trend looks strong and the current drop is most likely just a correction inside bigger trend up, shaking weak hands before trend continuation.