

On previous analysis I wrote, that we need green weekly engulfing candle to turn the weekly chart bullish and it happened on the same week the previous analysis was posted. Now we have few more weekly candles to look at and interesting monthly close coming soon to prepare for.
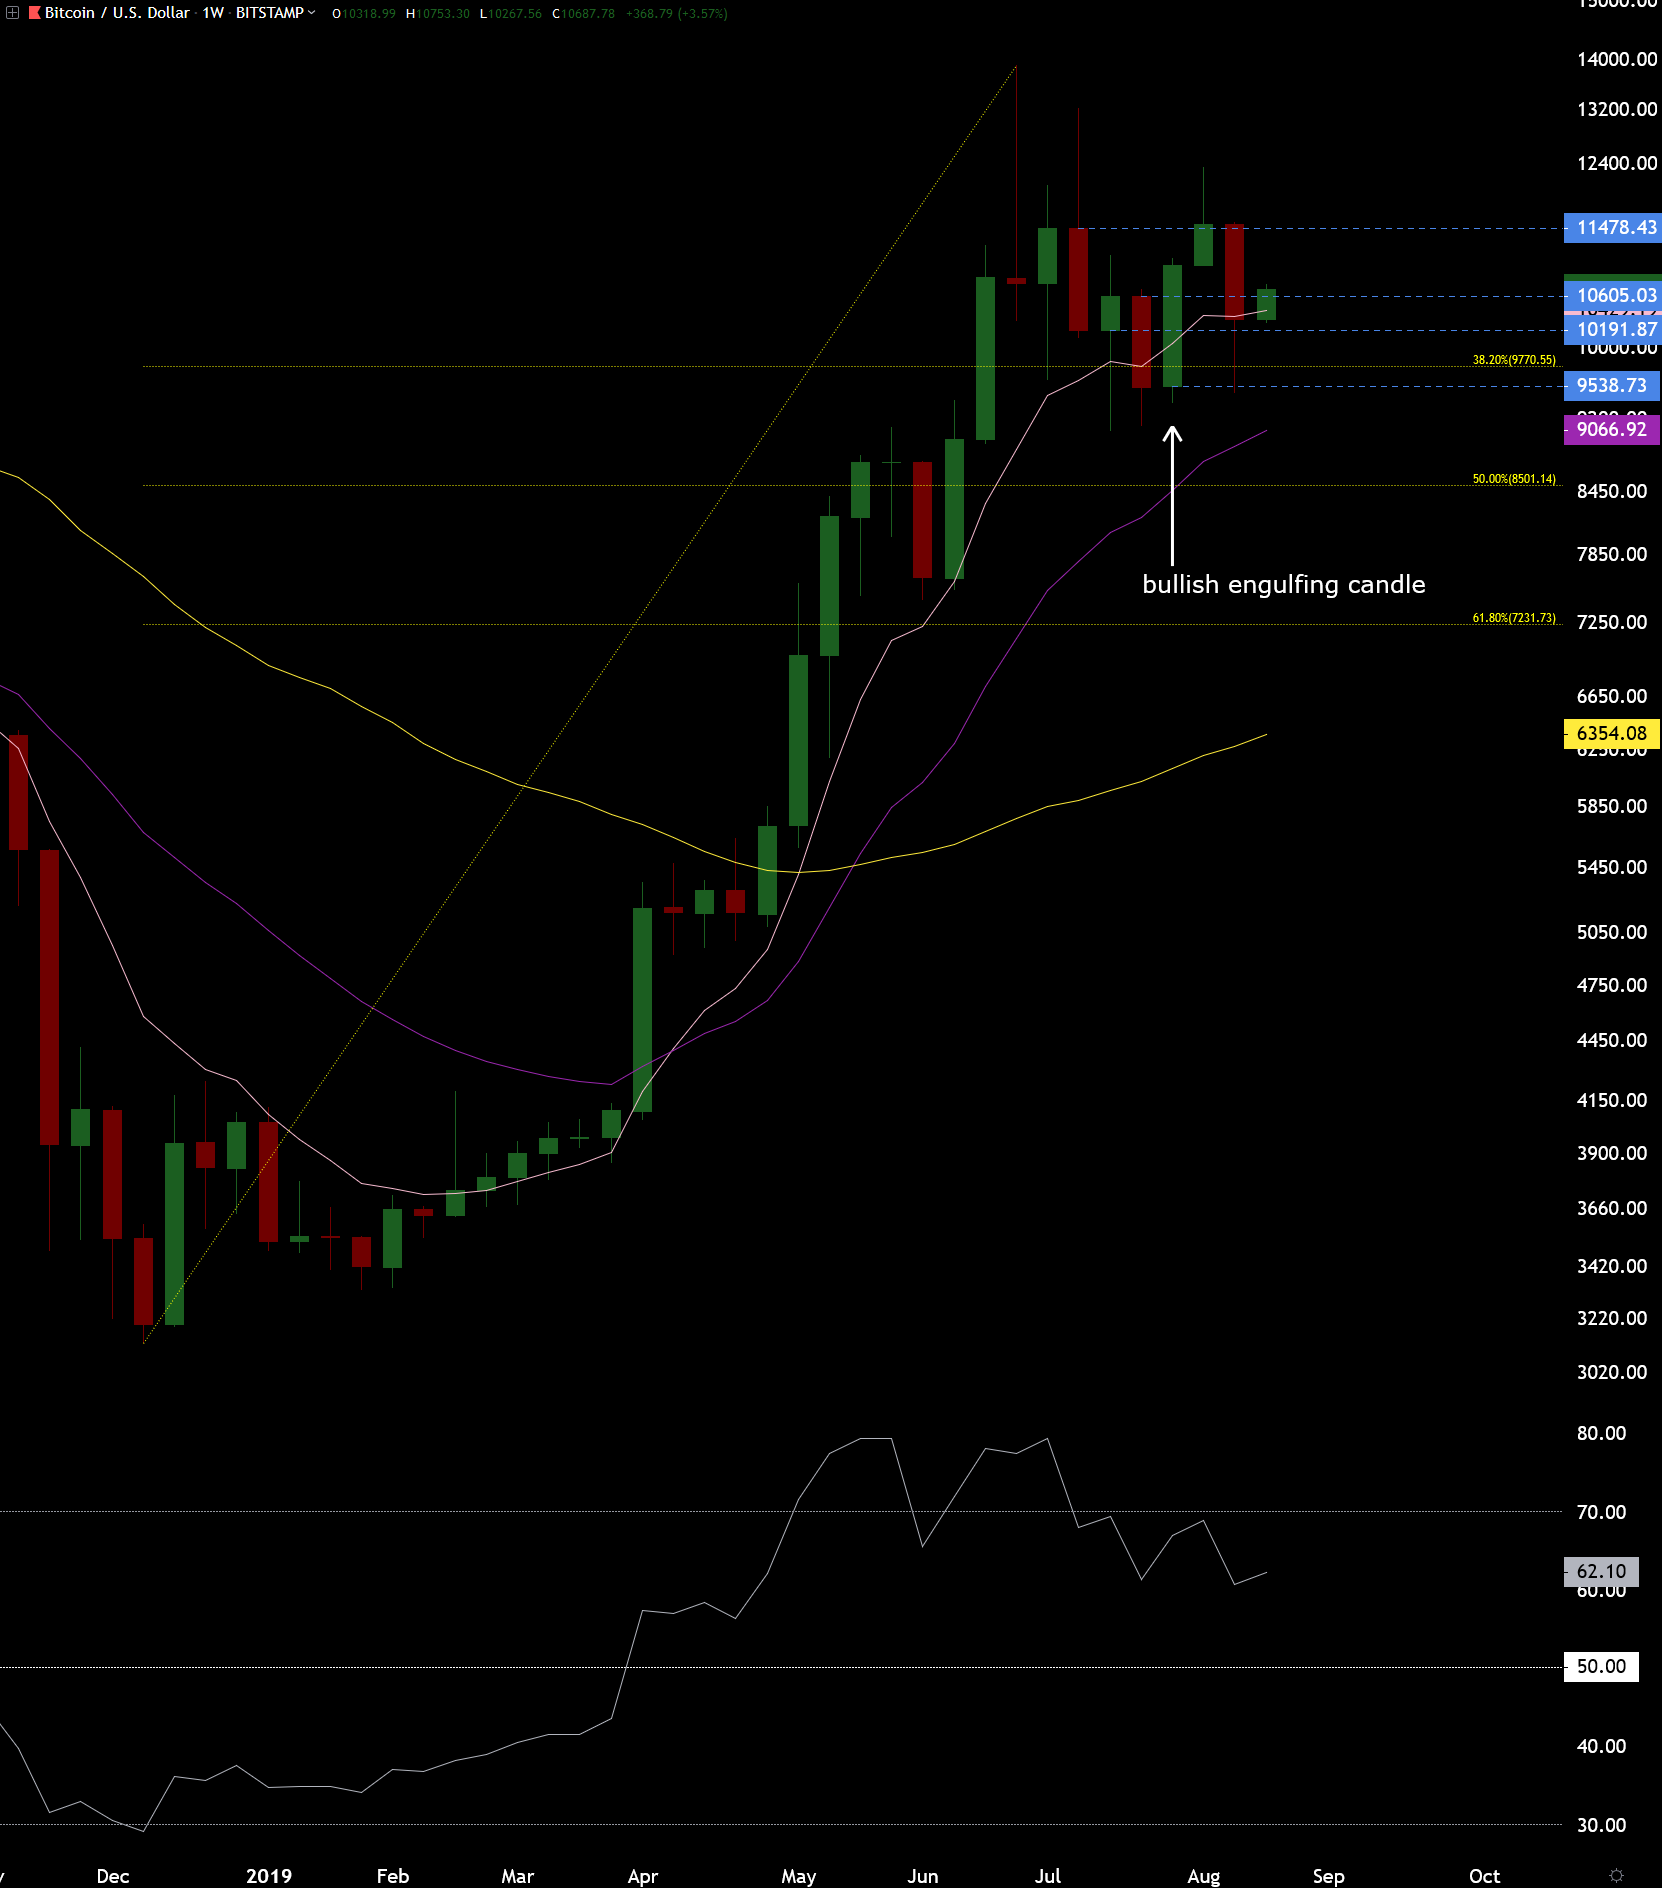
So let’s start from the weekly chart this time. There is an arrow pointing to this bullish green engulfing candle that happened on the week the previous analysis was posted. This kind of candle can very well start the trend continuation from correction bottom.
It would have been more bullish to get a good follow through with the next candle, a clean close above the $11478 weekly open. We didn’t get that and then started to dump on the next weeks candle, but the dump candle wicked to $9538 weekly open and closed over $10191 open so it could be just a correction for the bullish green engulfing candle.
I’m leaning little bit more bullish here than bearish because of the engulfing candle, but if we go down more then the purple EMA (exponential moving average) from 20 weeks is a good support. Close above $11478 open would be obviously bullish and most likely mean new highs above the $13880 top.
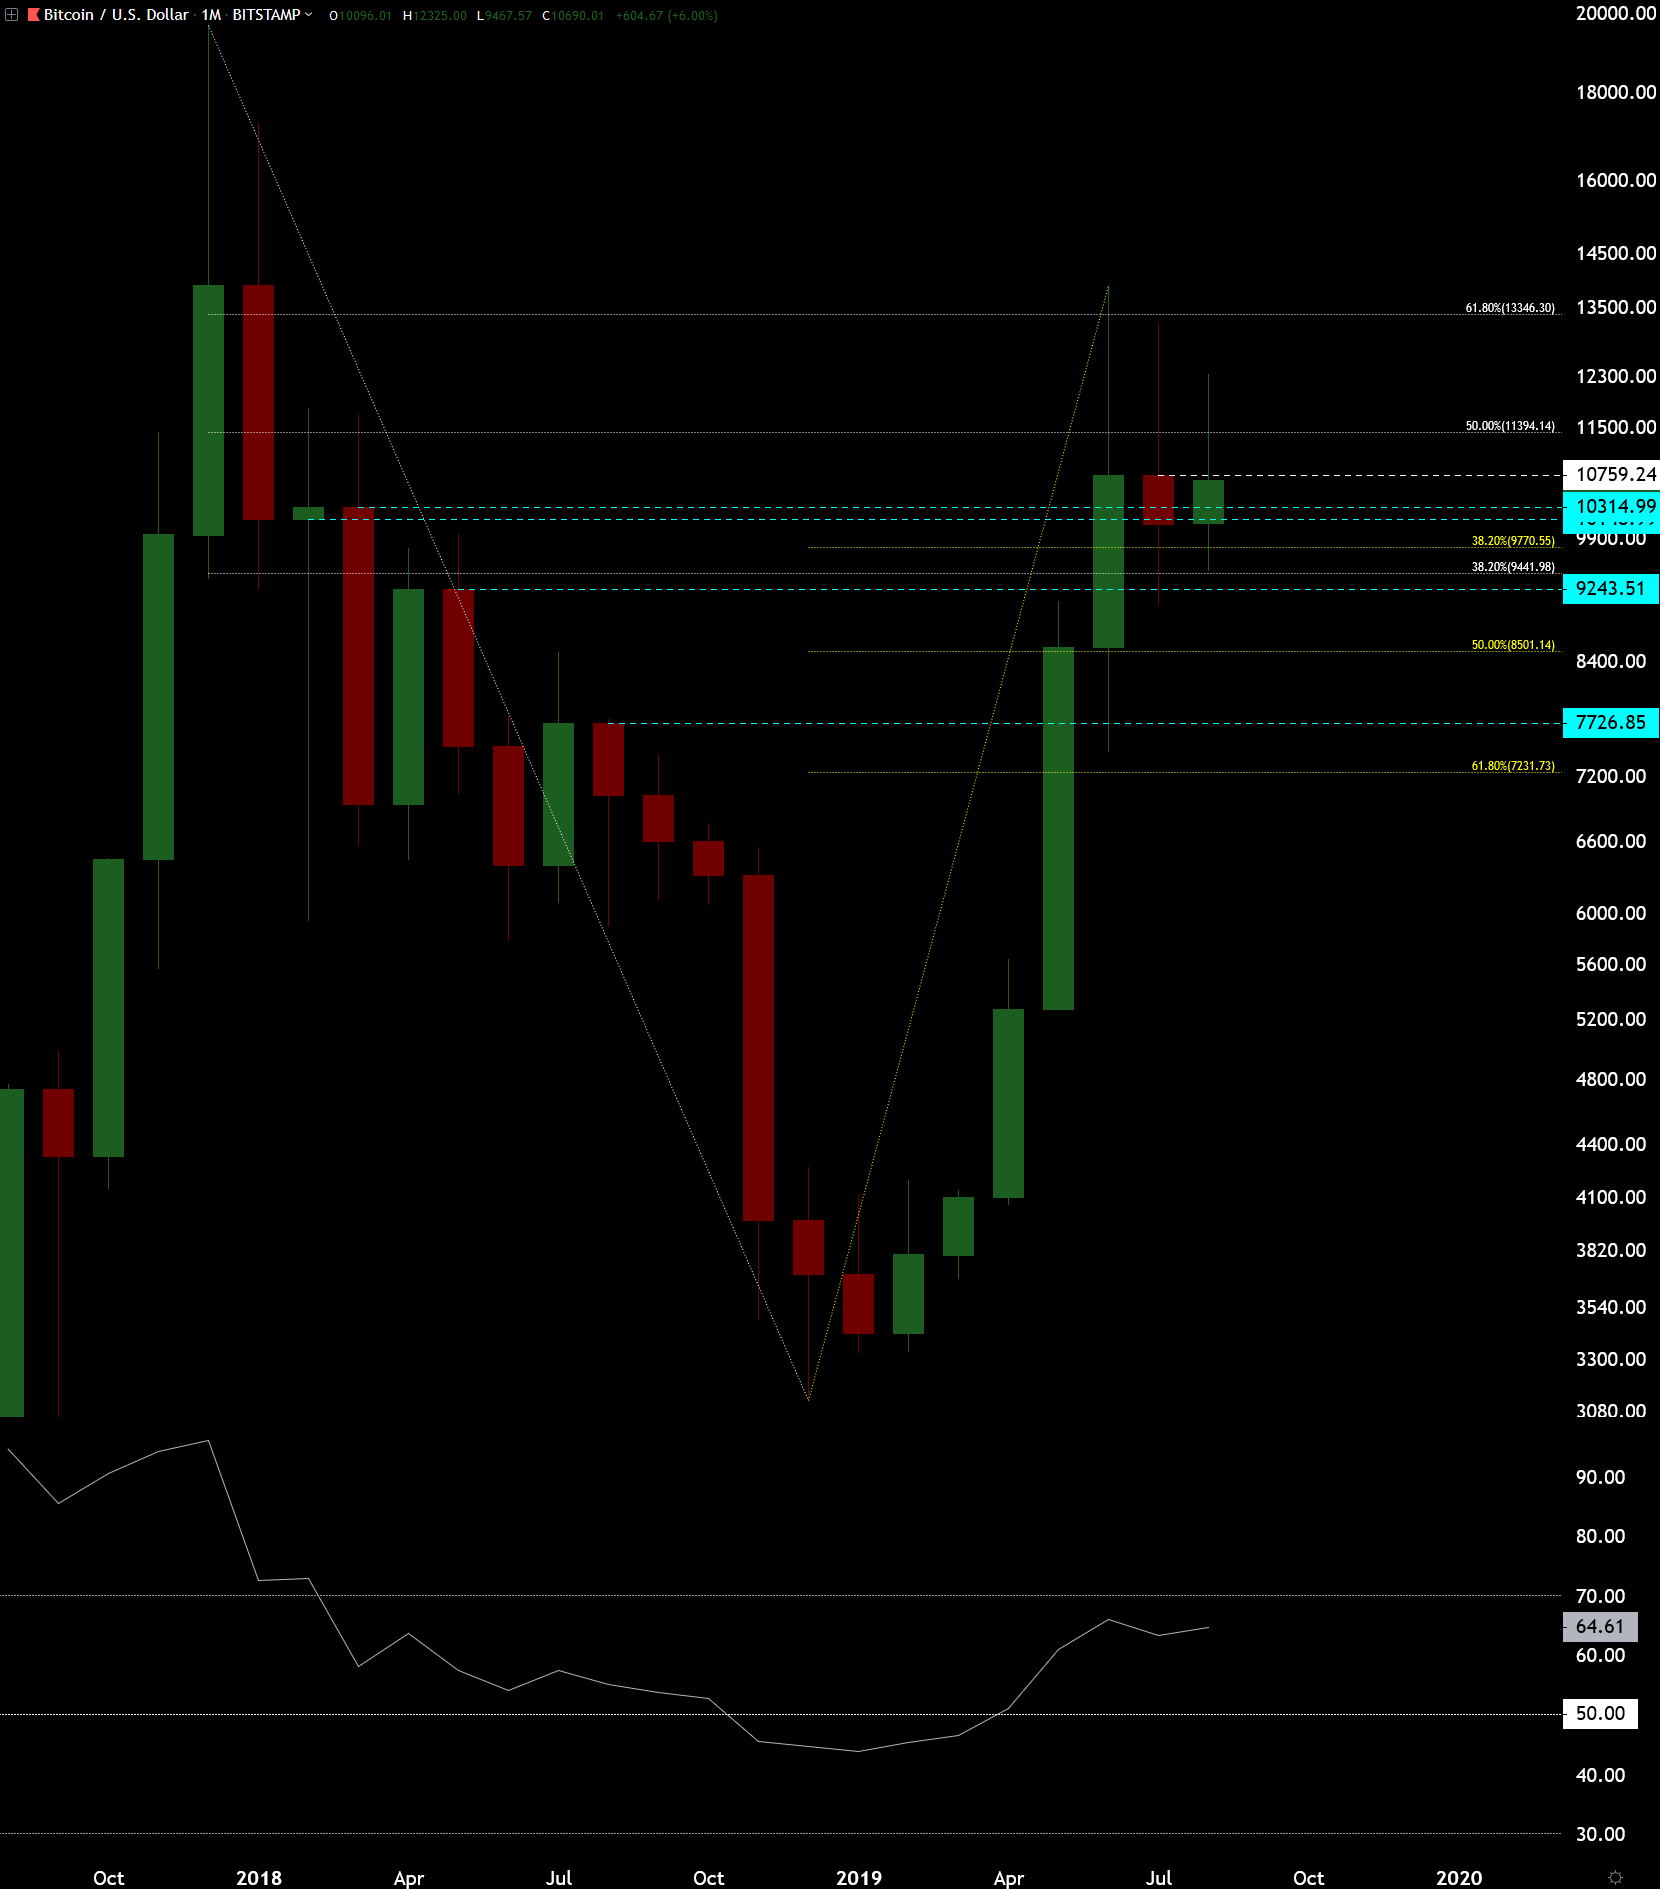
On monthly chart we will see a new close/open in about 2 weeks. There are some nasty looking wicks at the top now. For the trend to continue up it would be nice to see a close above the open marked with the white line at $10759, otherwise this candle will lock yet another top wick and the correction we are seeing might very well keep on correcting.
If we close below the $10148 open then the 50% fibonacci retrace starts to look like a good target since there is also the top candles open at $8545.
The weekly EMA20 (purple moving average on the first chart) was very good support during the previous bull market from $200 to $20000 but that doesn’t necessarily mean it will work again as well on this one. This rise from $3000 has already been different to the start of the previous bull market and the correction might be different/longer to what we saw back then too.
The weekly EMA20 is a good support, but with bearish monthly close I wouldn’t trust it as much as otherwise, although there is nothing meaningful to make me think this would be anything else than a correction on the new bull market from $3000. If you think we are most likely still in bear market, you’re doing it wrong.