


Like I wrote last time the market did have a lot of strength left in it and we went up quite a lot, but now I think it is time for a correction. In this analysis I’ll tell you why this is probable scenario.
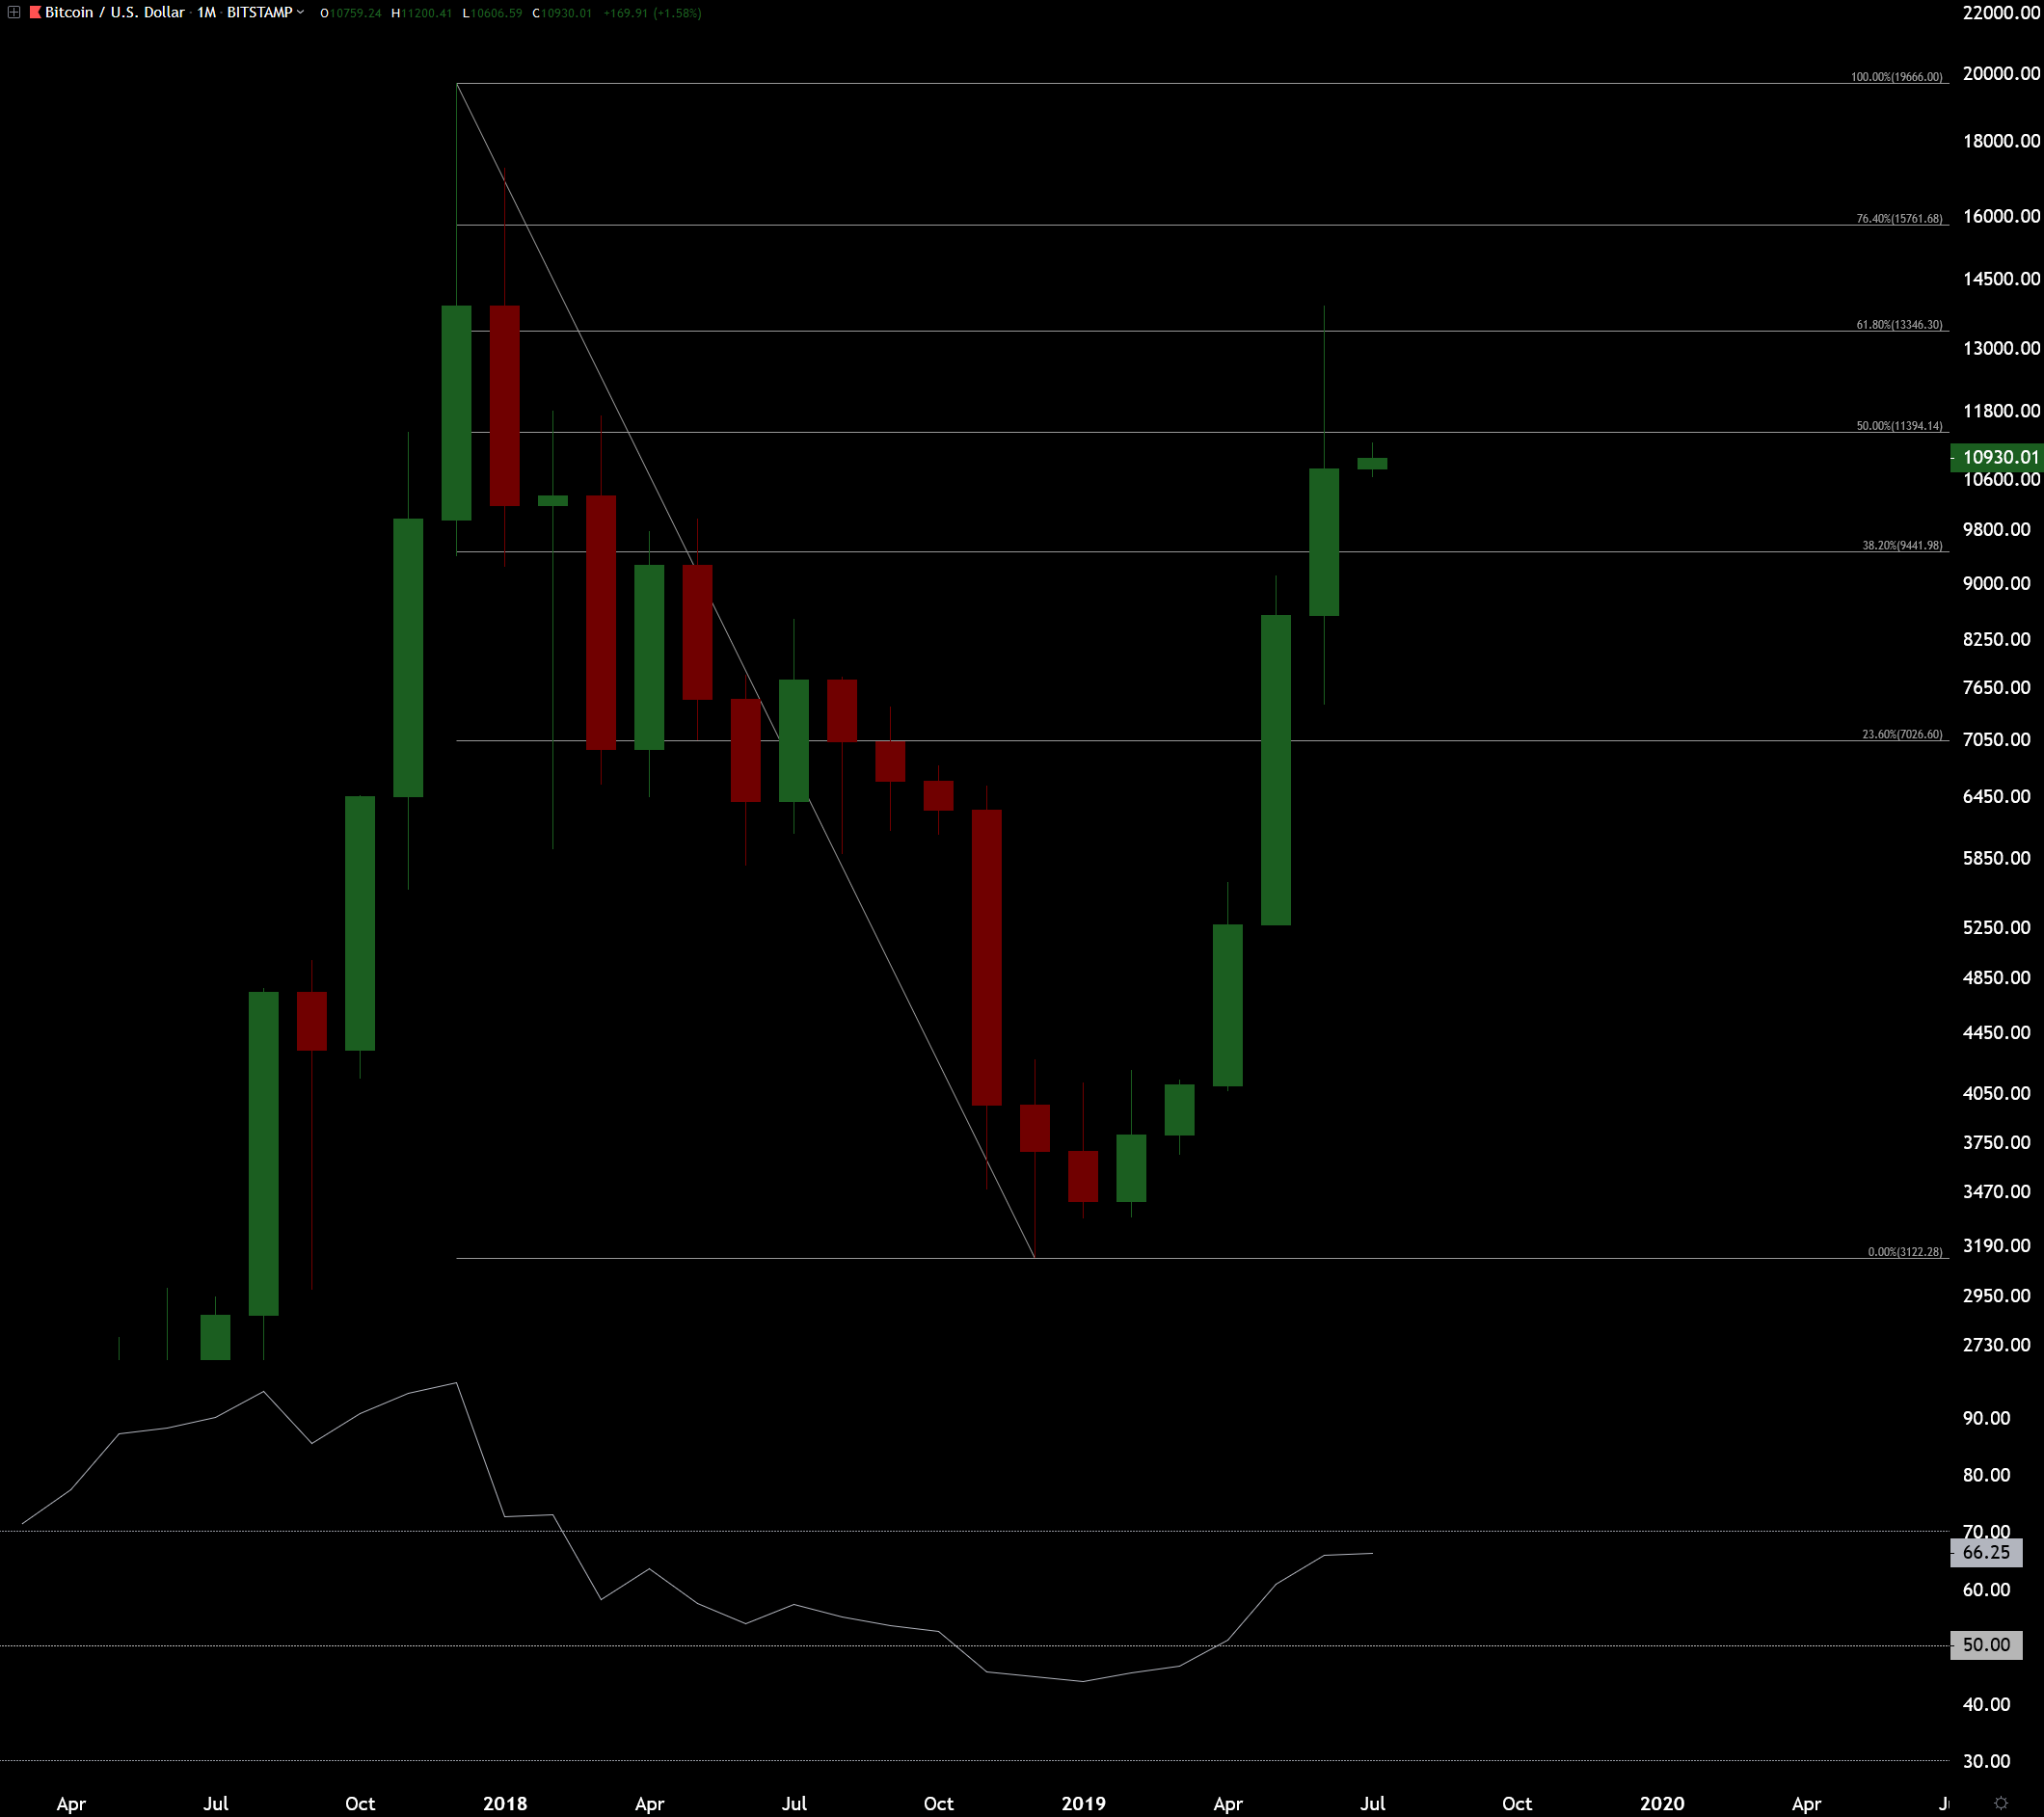
Let’s start from the monthly chart with fibonacci levels and relative strength index (RSI). While price was at 61.8% fibonacci level the RSI was at 70. The 70 RSI level on monthly is possibly an important support/resistance (S/R) level and the 61.8% fibonacci level is for sure an important S/R level.
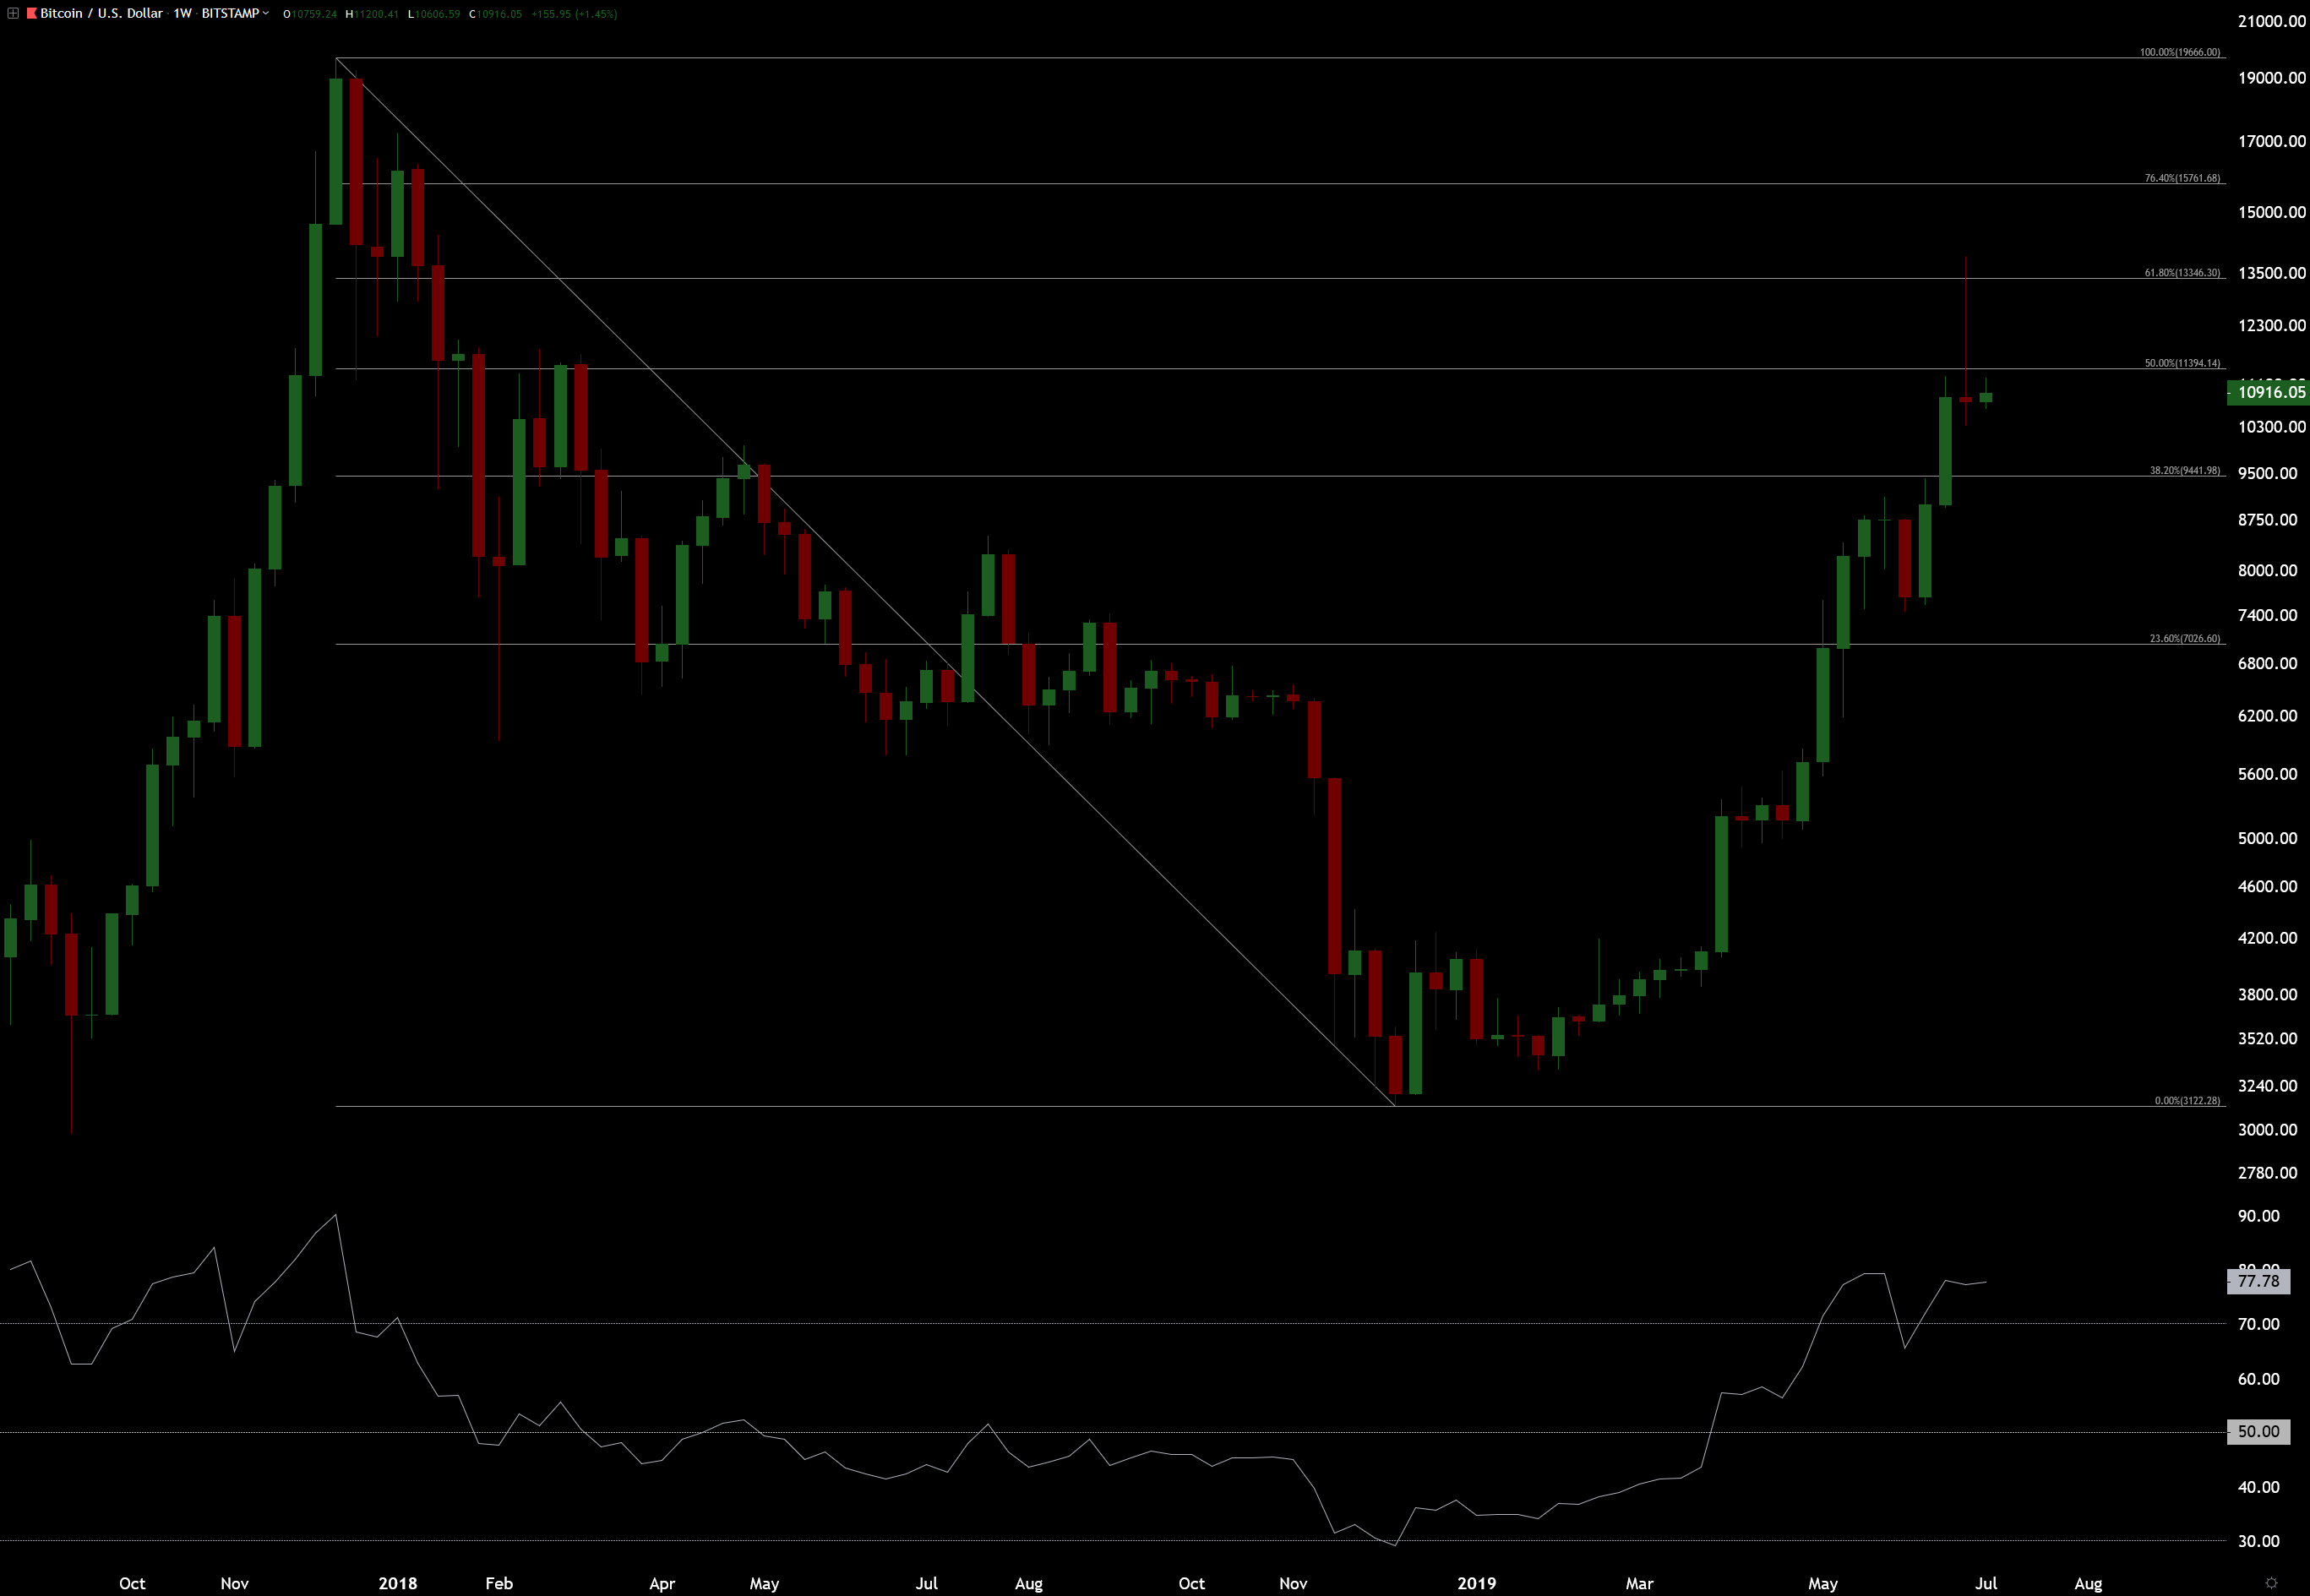
On the weekly chart we can see a red shooting star candle at the top. Shooting star here now is a clear sign on weekly scale that the 61.8% fibonacci level was an important resistance level. Shooting star is the first strong sign of rejection from that 61.8% level since weekly chart closed this morning and it gives stronger signals than daily charts.
There is also a bear divergence showing on the RSI between $9096 and $13880 tops.
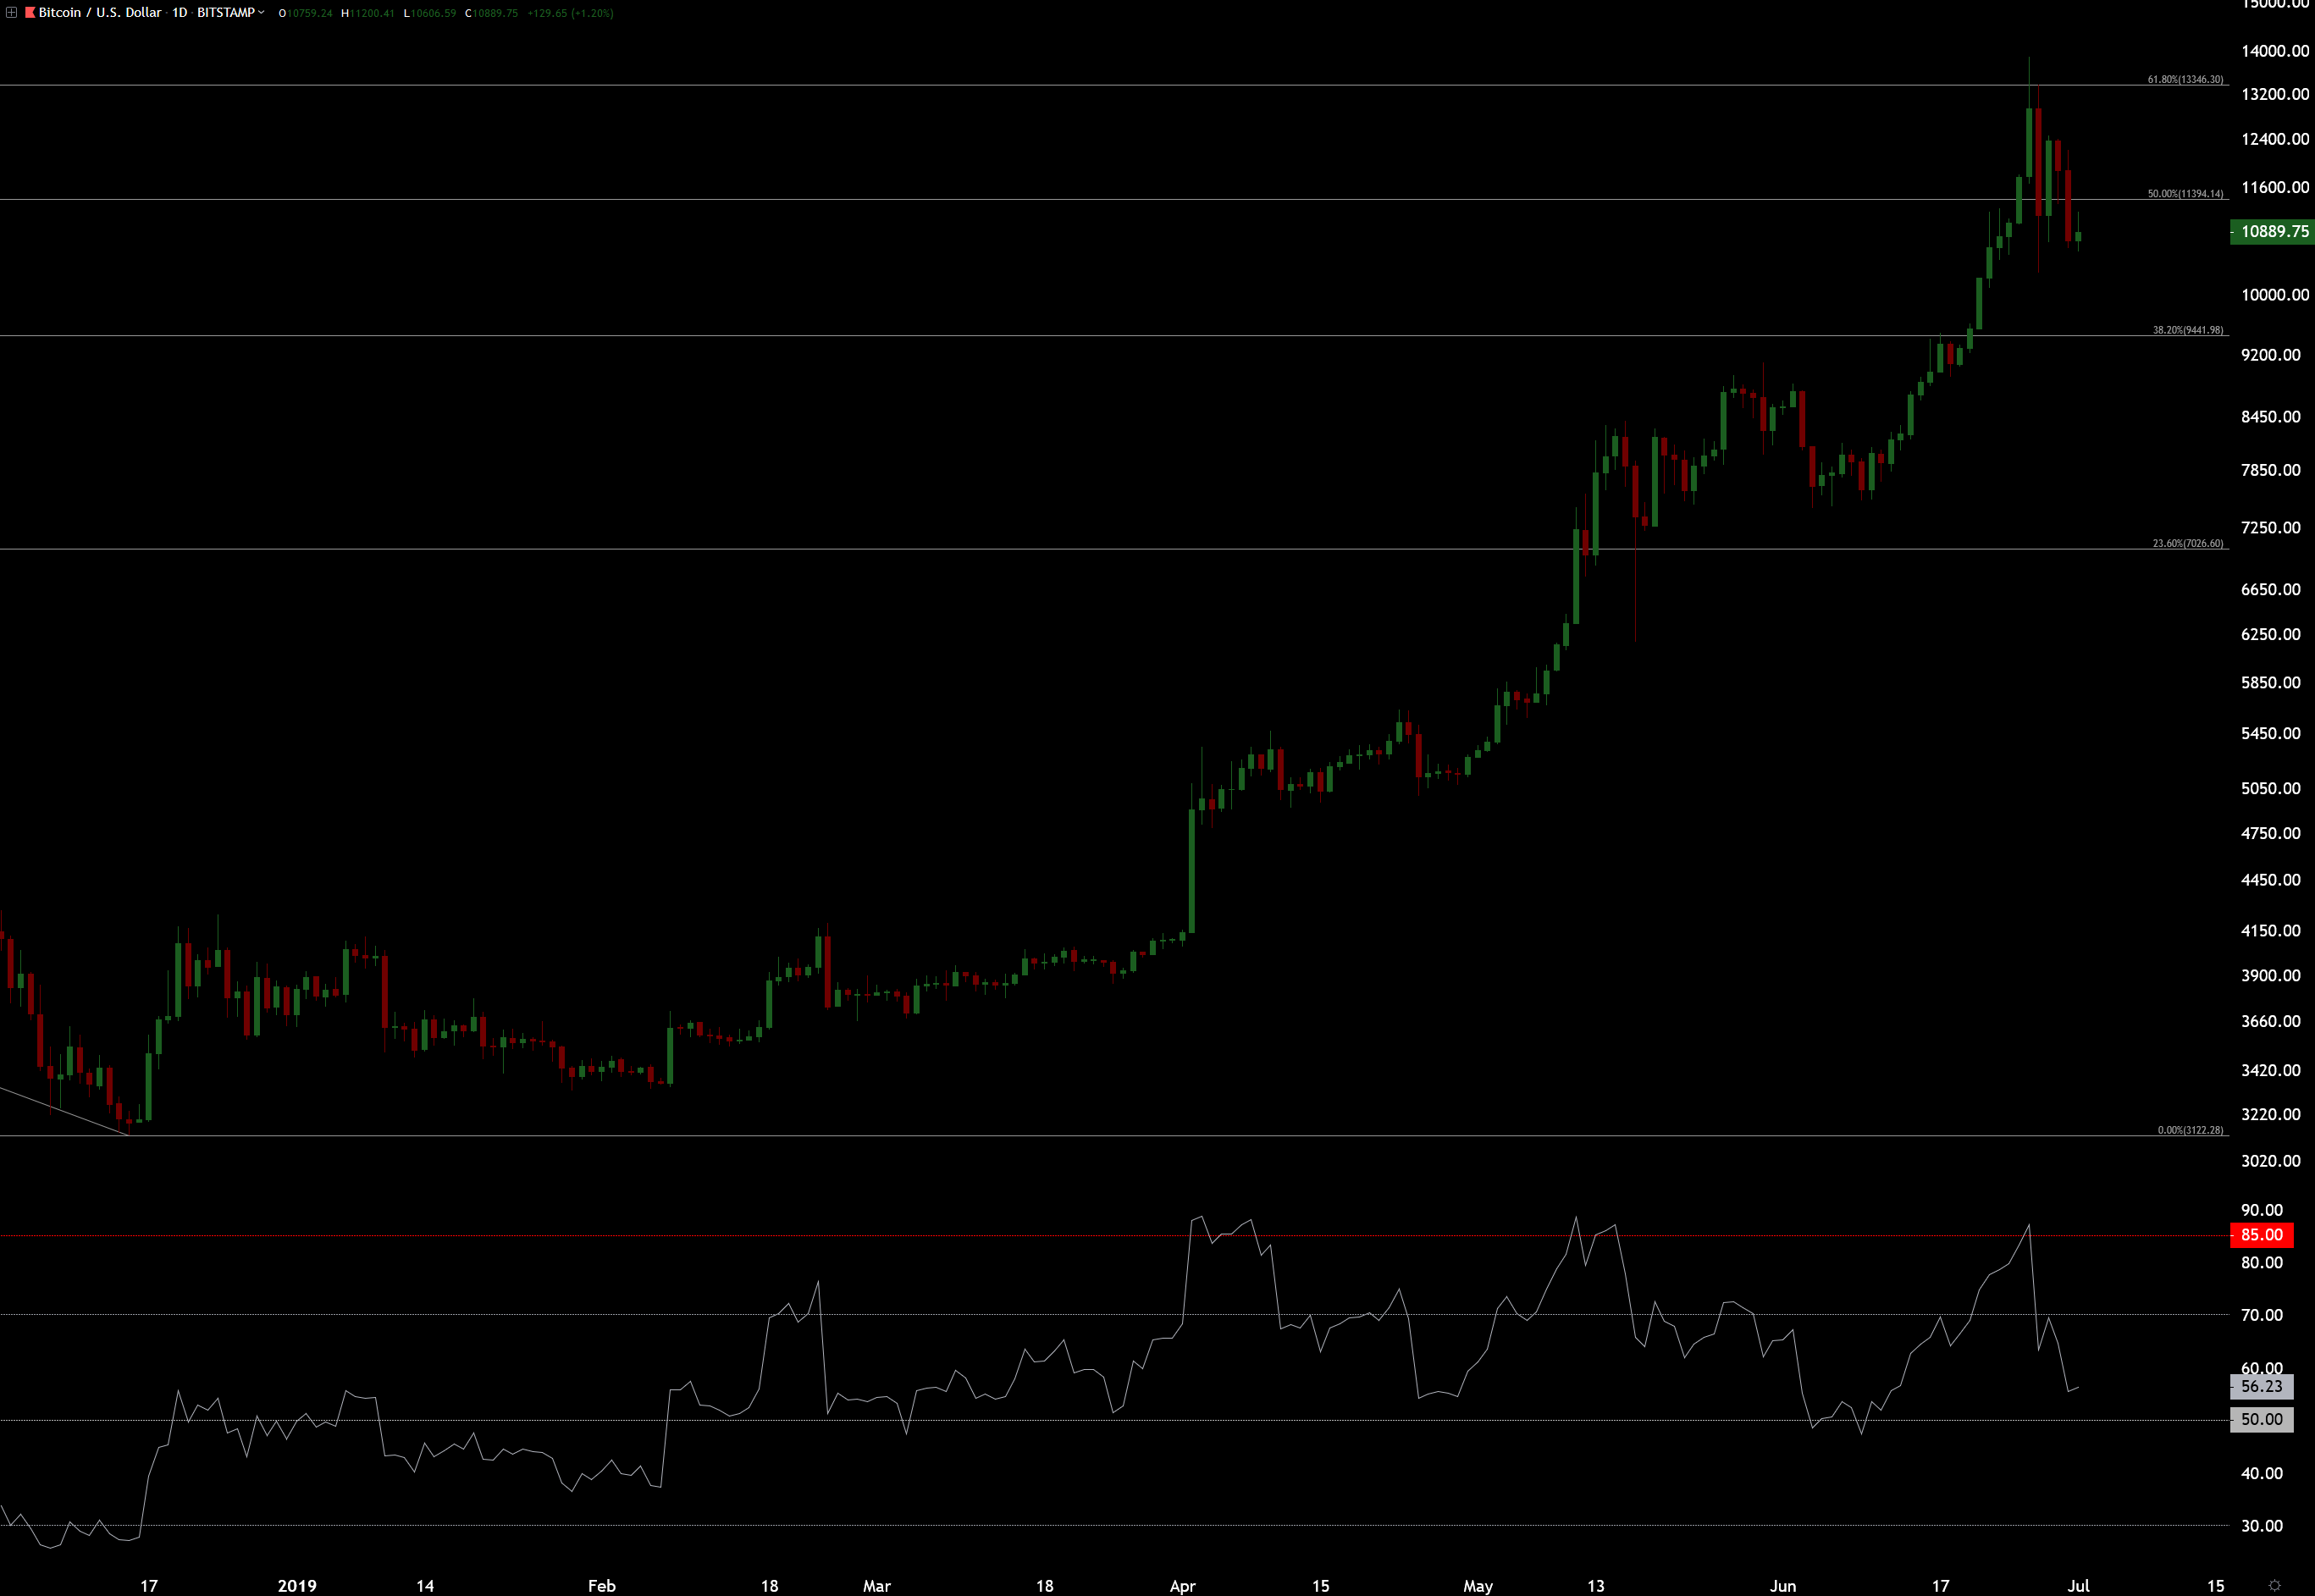
On the daily chart we can see that the RSI went over 85 which is getting pretty overbought. First red candle from the top was engulfing and the next green one wasn’t as big, just a retrace. After that we started to get more red ones.
Monthly, weekly and daily RSI with fibonacci levels and basic candle patterns are simple and very good ways to read the market, if one knows how to read them correctly.
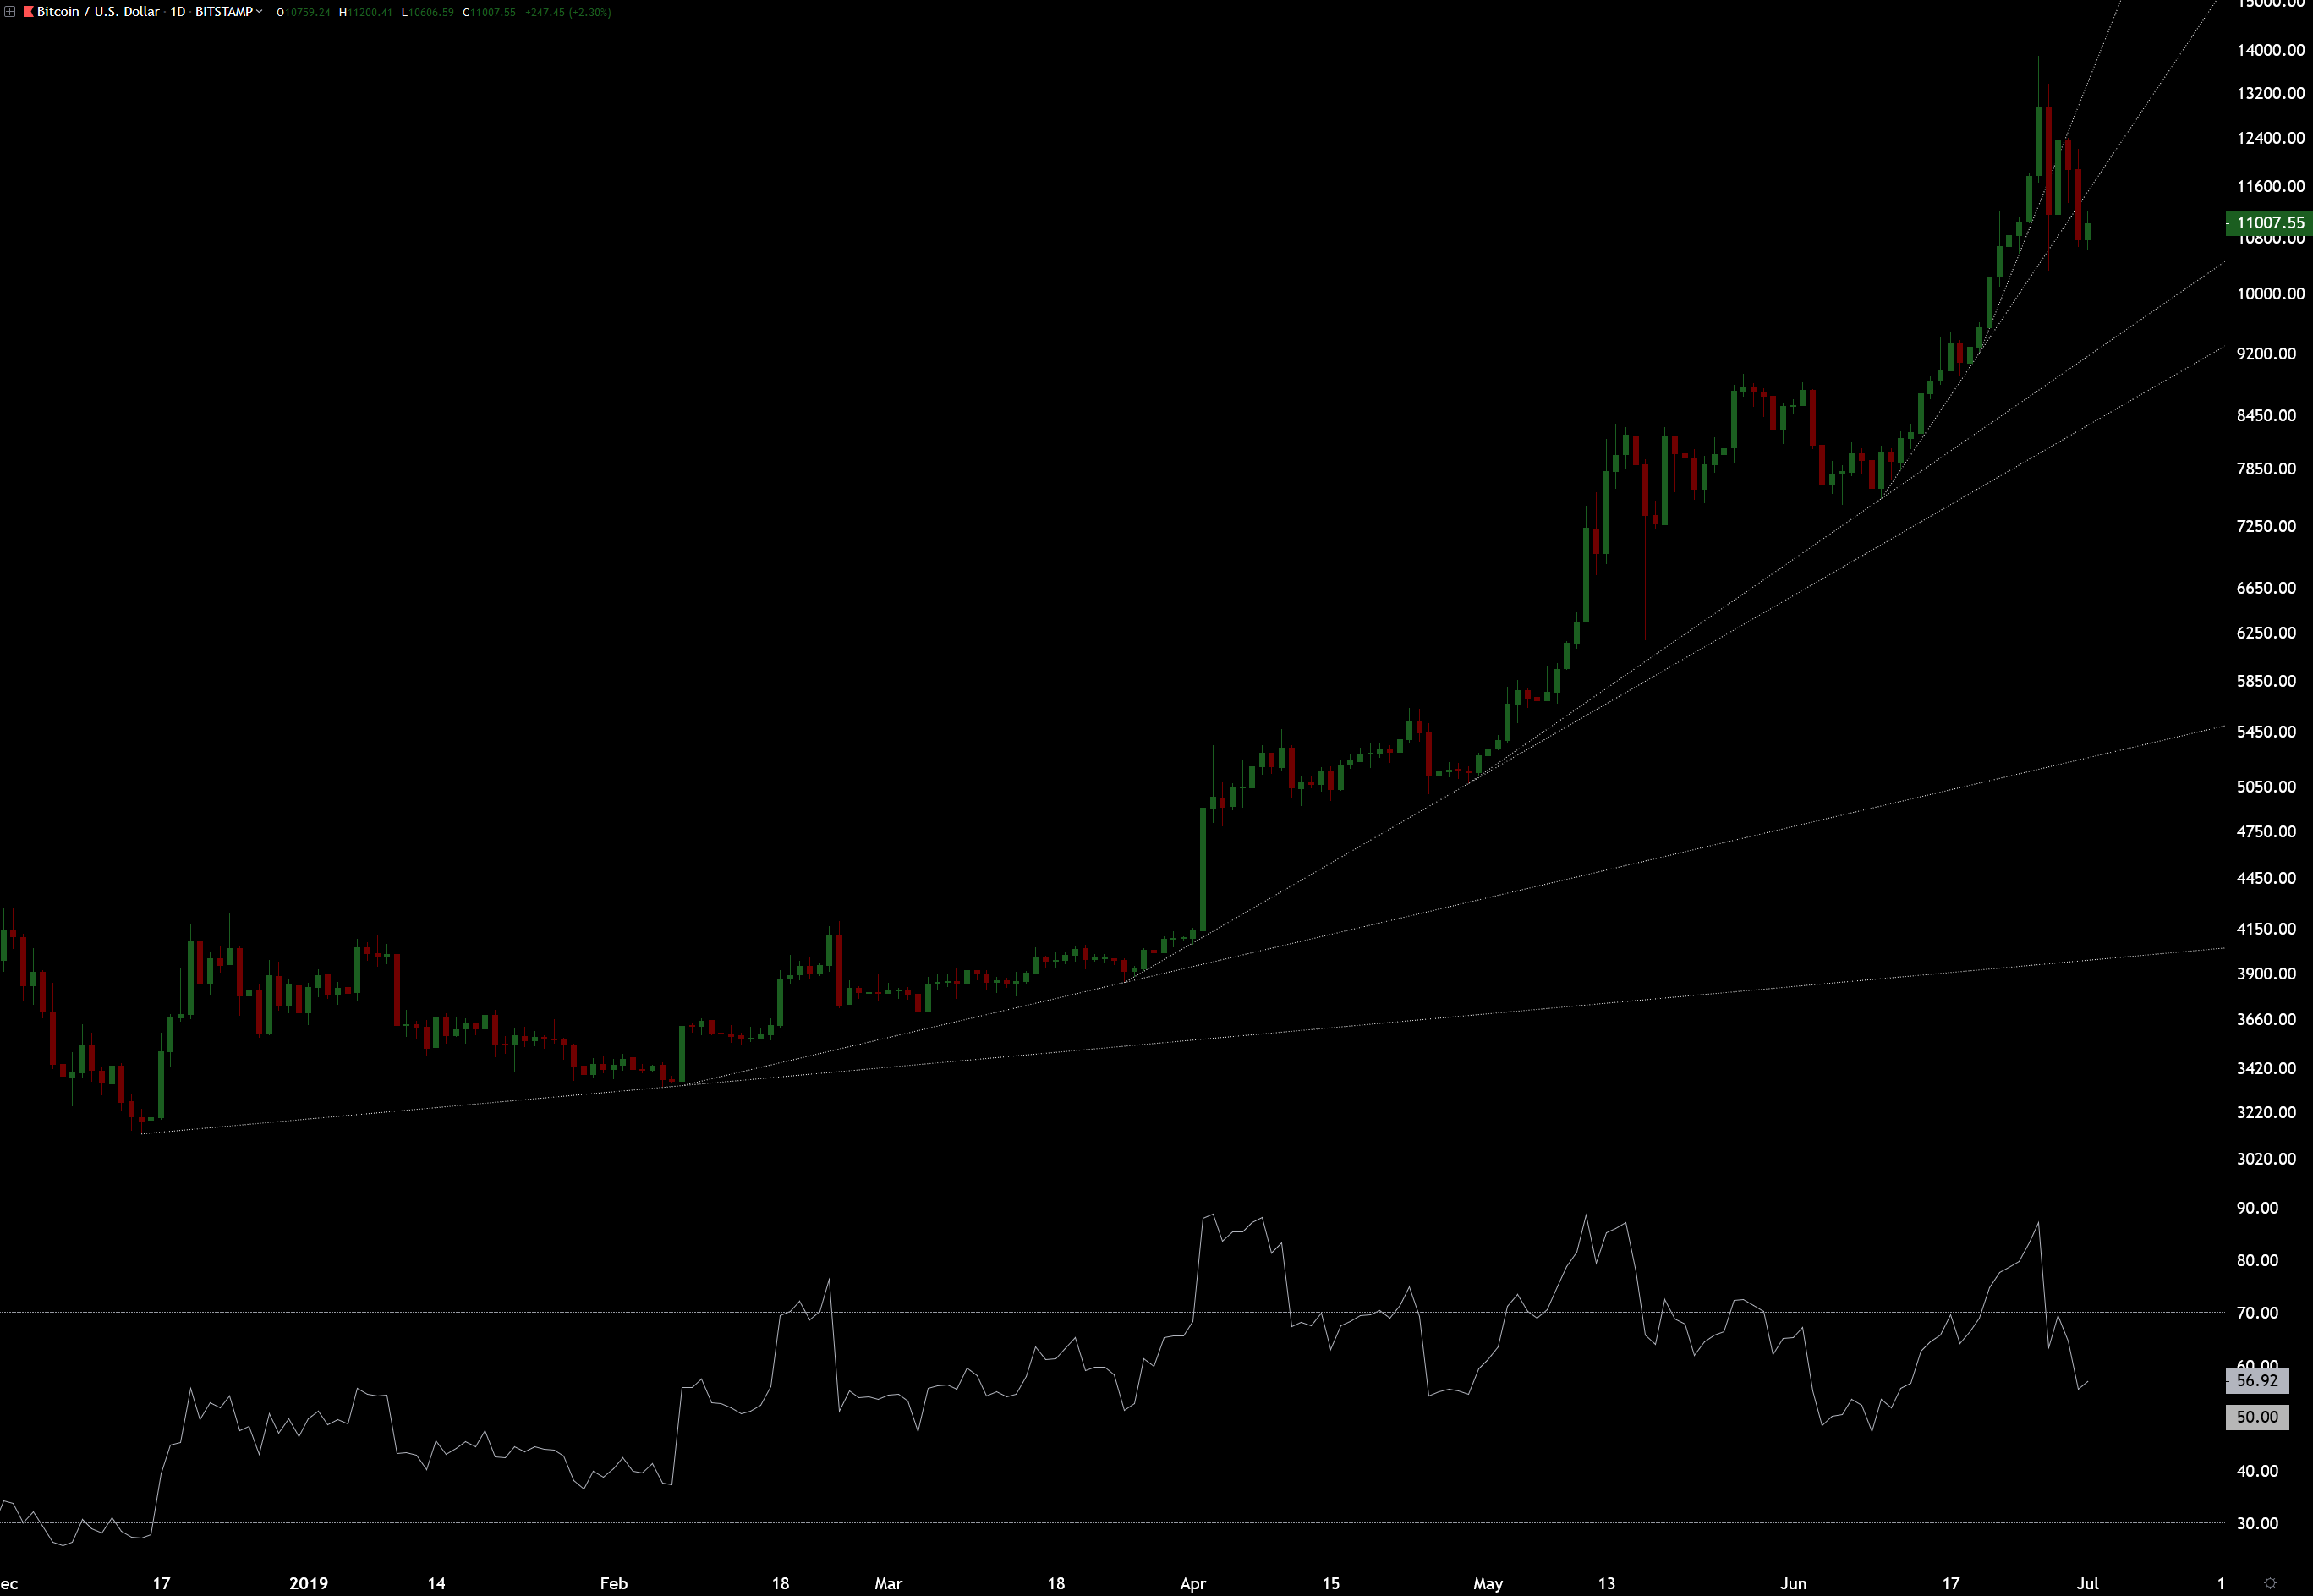
Trendlines drawn from daily candles.
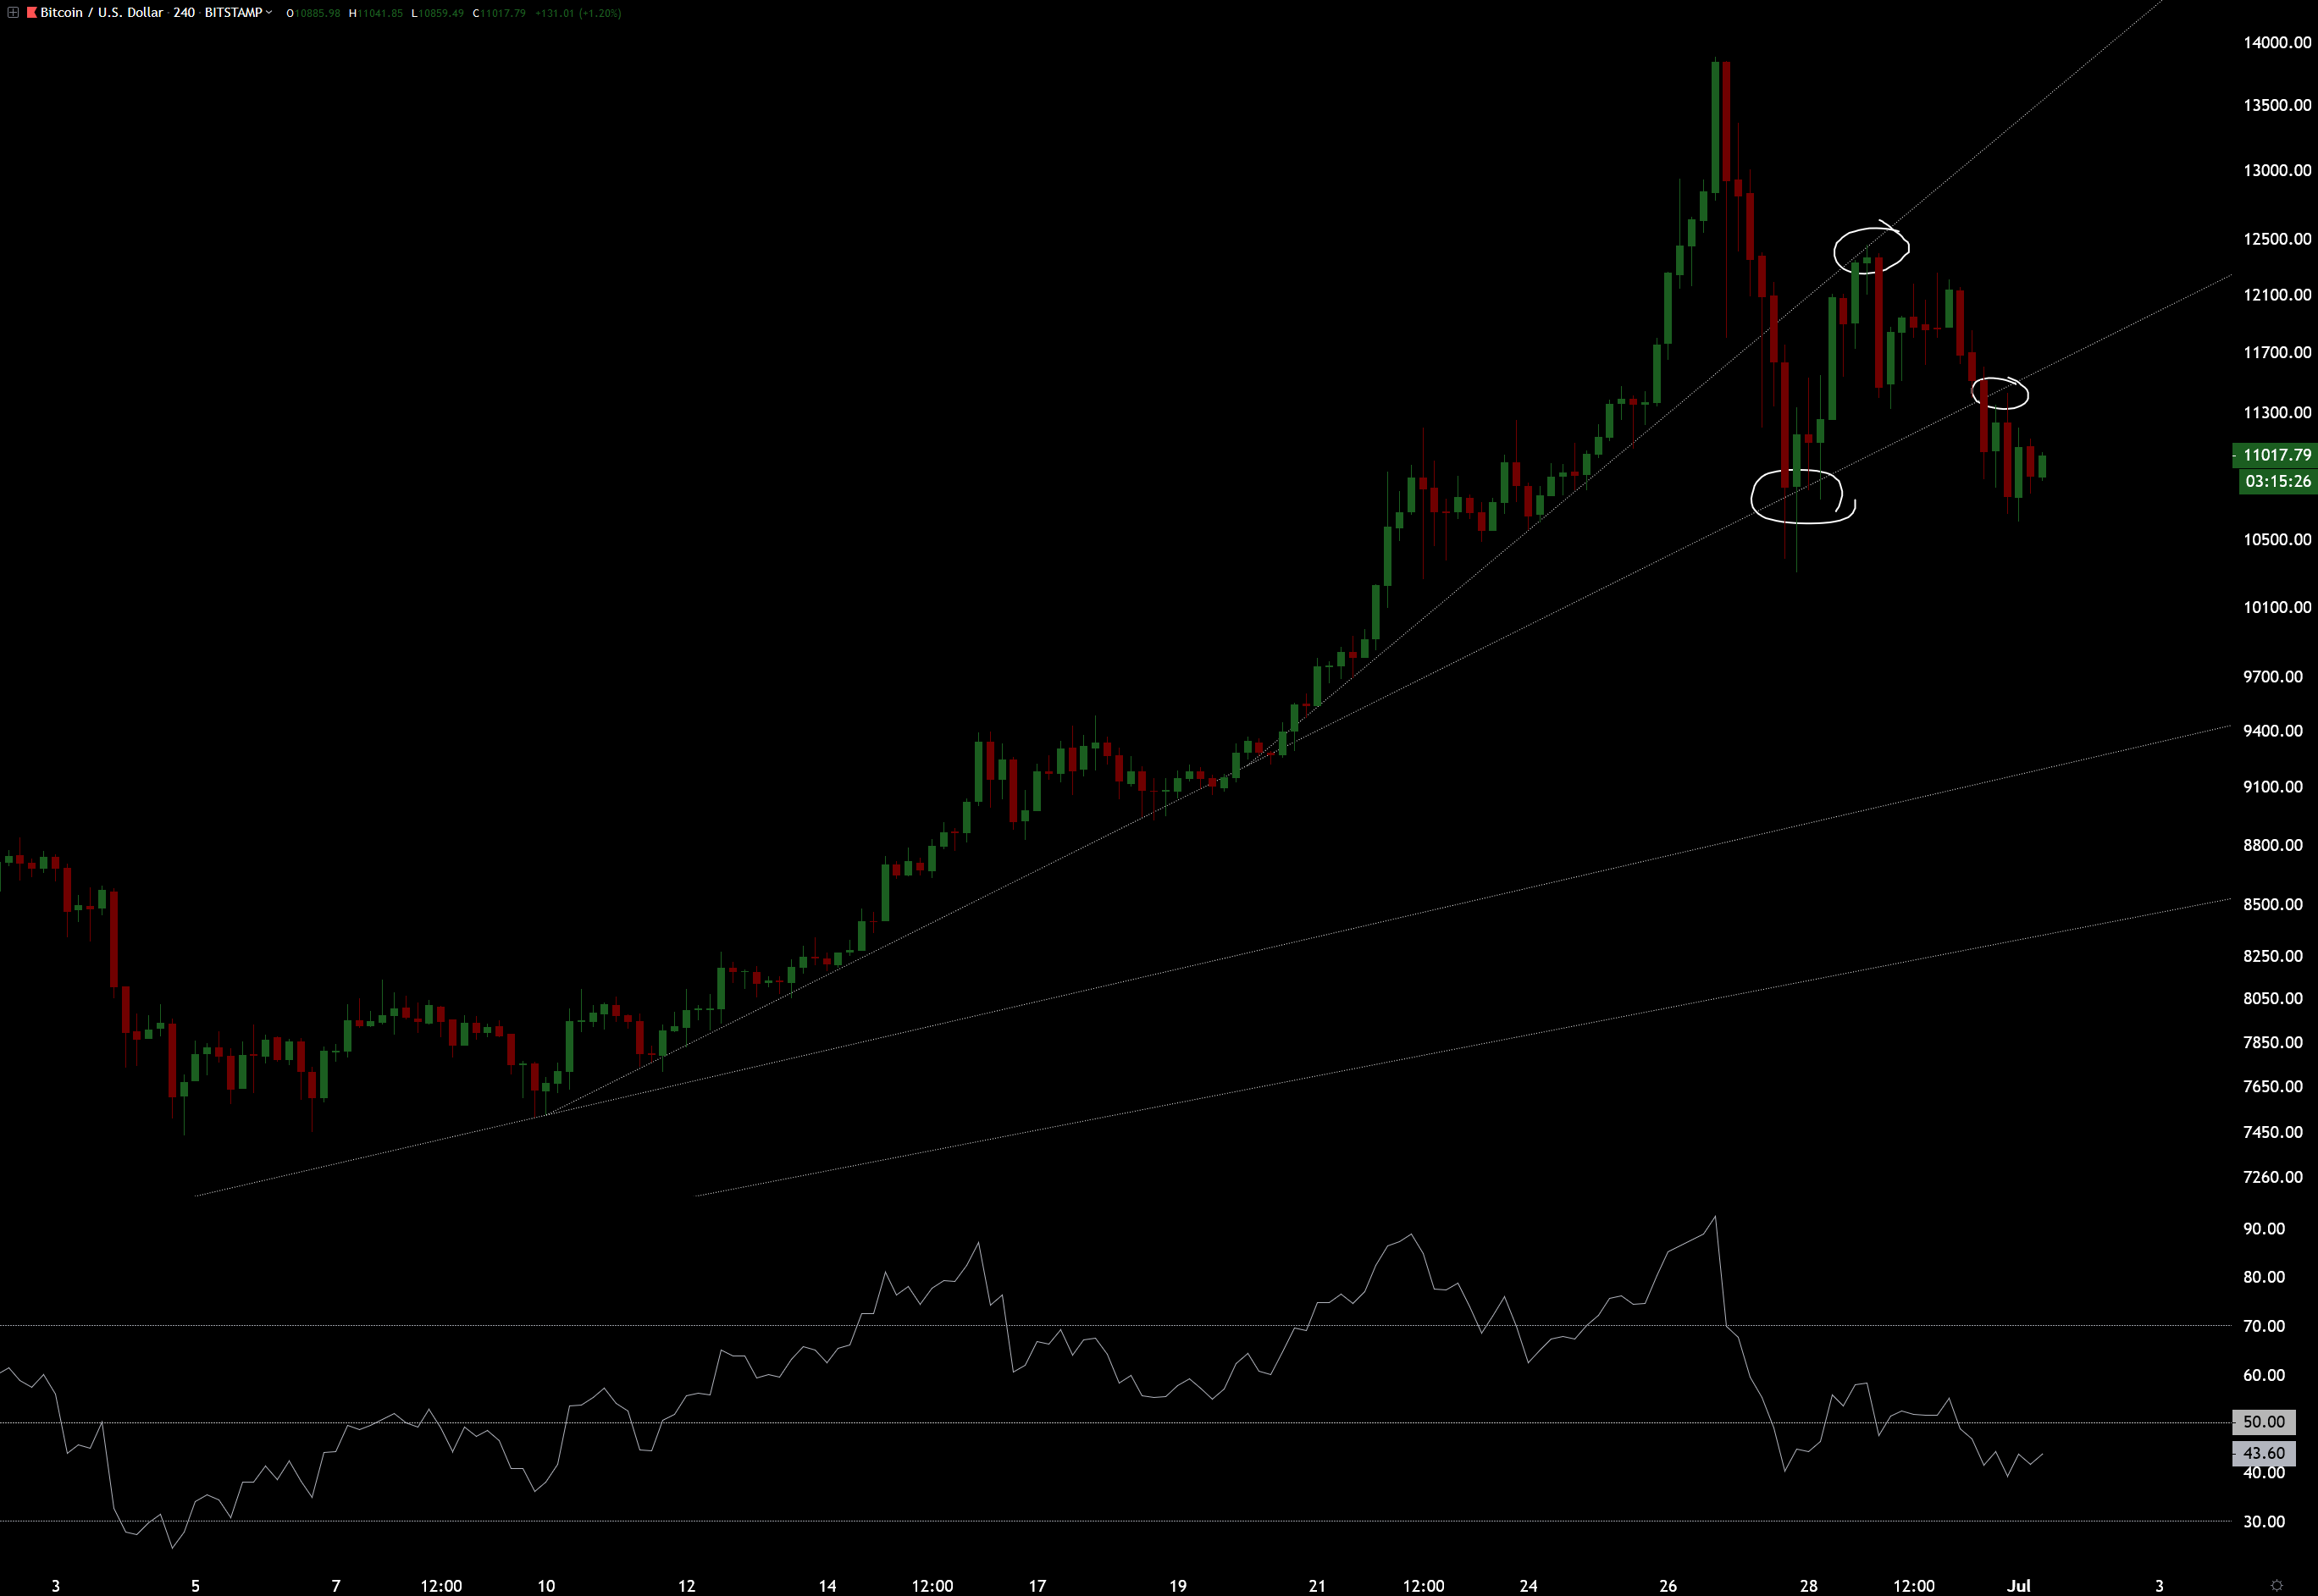
Same daily trendlines shown on four hour chart. These trendlines may help you, but also they may mess with your head. In trading it is important to concentrate to the right simple things that work and get rid of the noise. Usually beginners have their charts full of everything and they never know what to trust when the time comes to make the trade.
When these daily trendlines line up with the more important stuff then they can be valuable additions to the analysis. I have circled the meaningful points there on the chart. At first the drop stopped at the second trendline from the top and then the bounce stopped at the first one, now we have broken the second one and tested it from below.
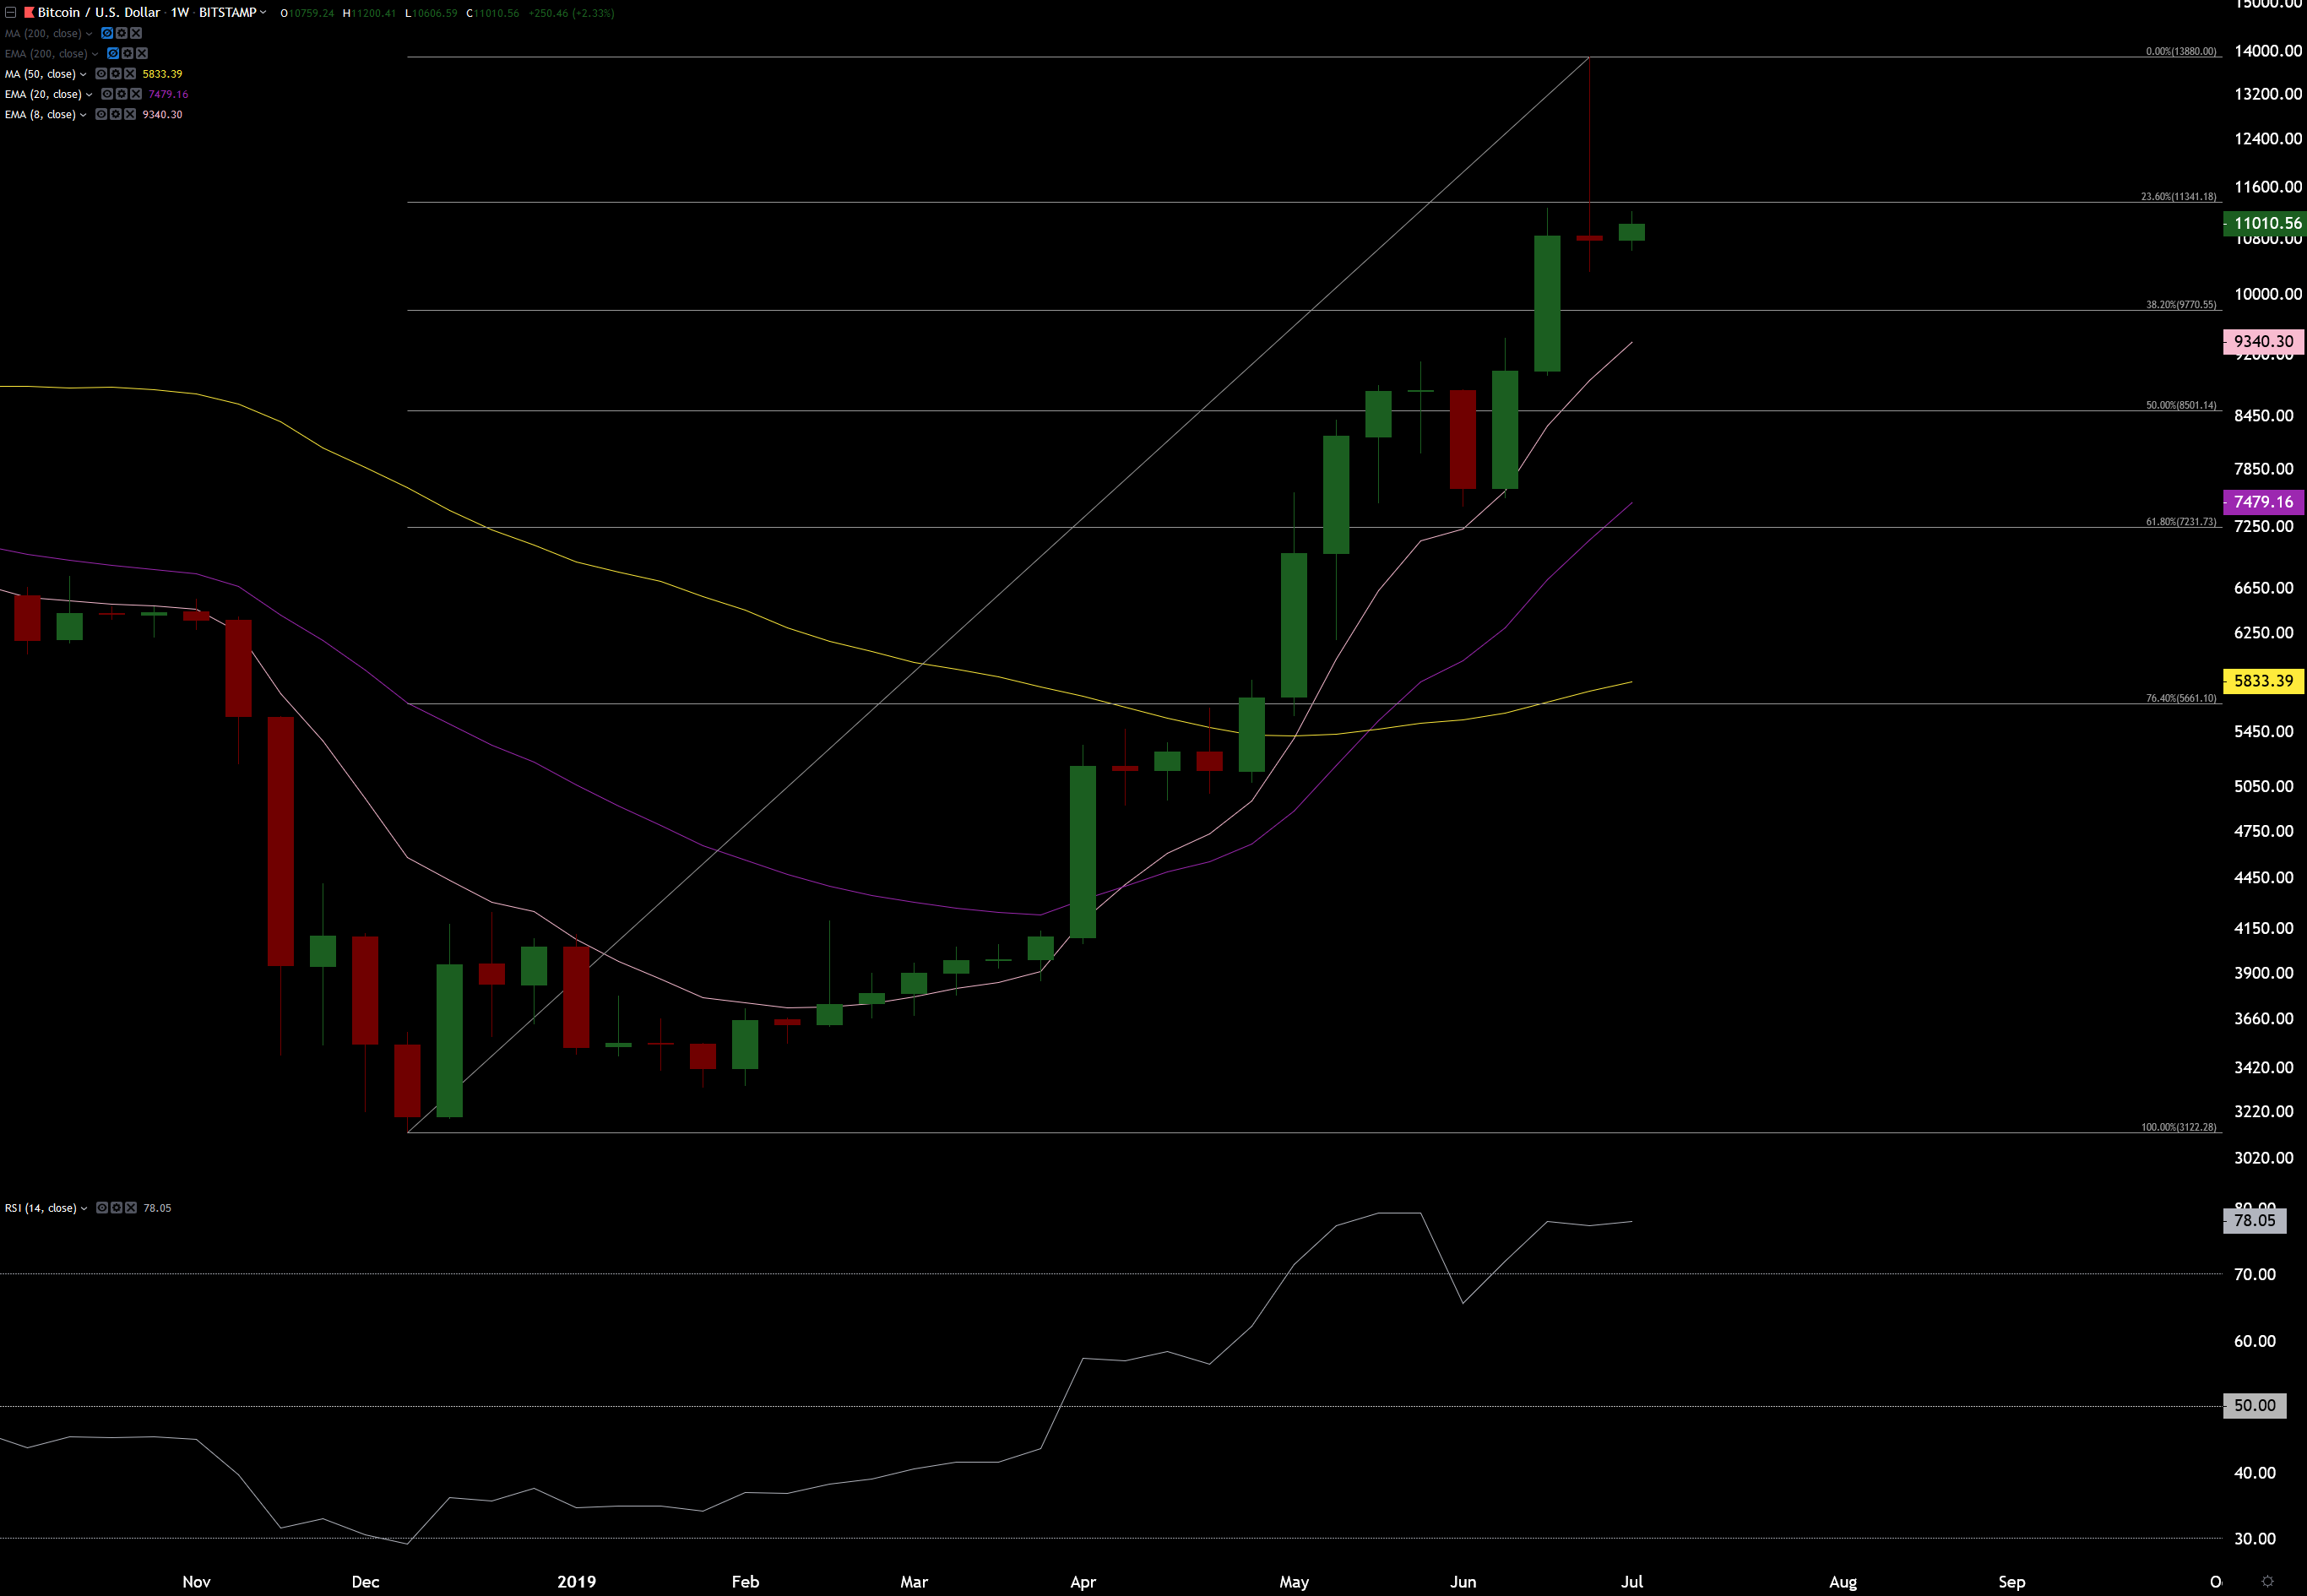
Okay so let’s try to figure out where could we be heading, if this is indeed bigger correction like I think at the moment. Here is the weekly chart again with pink EMA8, purple EMA20 and yellow SMA50. On the previous analysis I wrote why I use these moving averages.
Previous small correction (red candle from June 3rd) on the weekly chart ended up hitting only that pink EMA8 as you can see from the chart. Now we have this bearish red shooting star from important bear market 61.2% fibonacci level so I’m inclined to think that we have to go lower than the pink EMA8 this time.
Next support moving average is the purple EMA20. This EMA20 is also in the area of the previous small correction/ red candle, which is usually a good place to start to look targets for a correction.
This purple EMA20 may rise to the 50% fibonacci level at $8501 which could also be a good target. Short spike to 61.8% level at $7231 is also possible, but not as likely scenario as the purple EMA20 is already higher than that.
Yellow SMA50 is the separator between bear and bull market. If we close below that I would get worried, if this was the start of the new bull market after all. No reason to believe now that this would have not been. This is a very strong movement off from the bottom of the bear market and is likely to keep going up a lot more before any exhaustion on longer term.
$80k to $100k is my first longer term target at the moment, but can go a lot higher than that too, but I will write about this later.