

MARKET INSIGHTS
Table of Contents
BITCOIN EXCELS DESPITE THE CHALLENGING MARKET ENVIRONMENT
After a long macro-driven bull cycle from 2010 to 2021, we’re witnessing uncertainty spreading its dark clouds across markets again. The markets are seeing geopolitical, inflationary, and COVID-related risk going beyond expectations. The 2010 to 2021 cycle was characterized by low inflation and almost every asset class offered moderate to high returns, however those times might now be history.
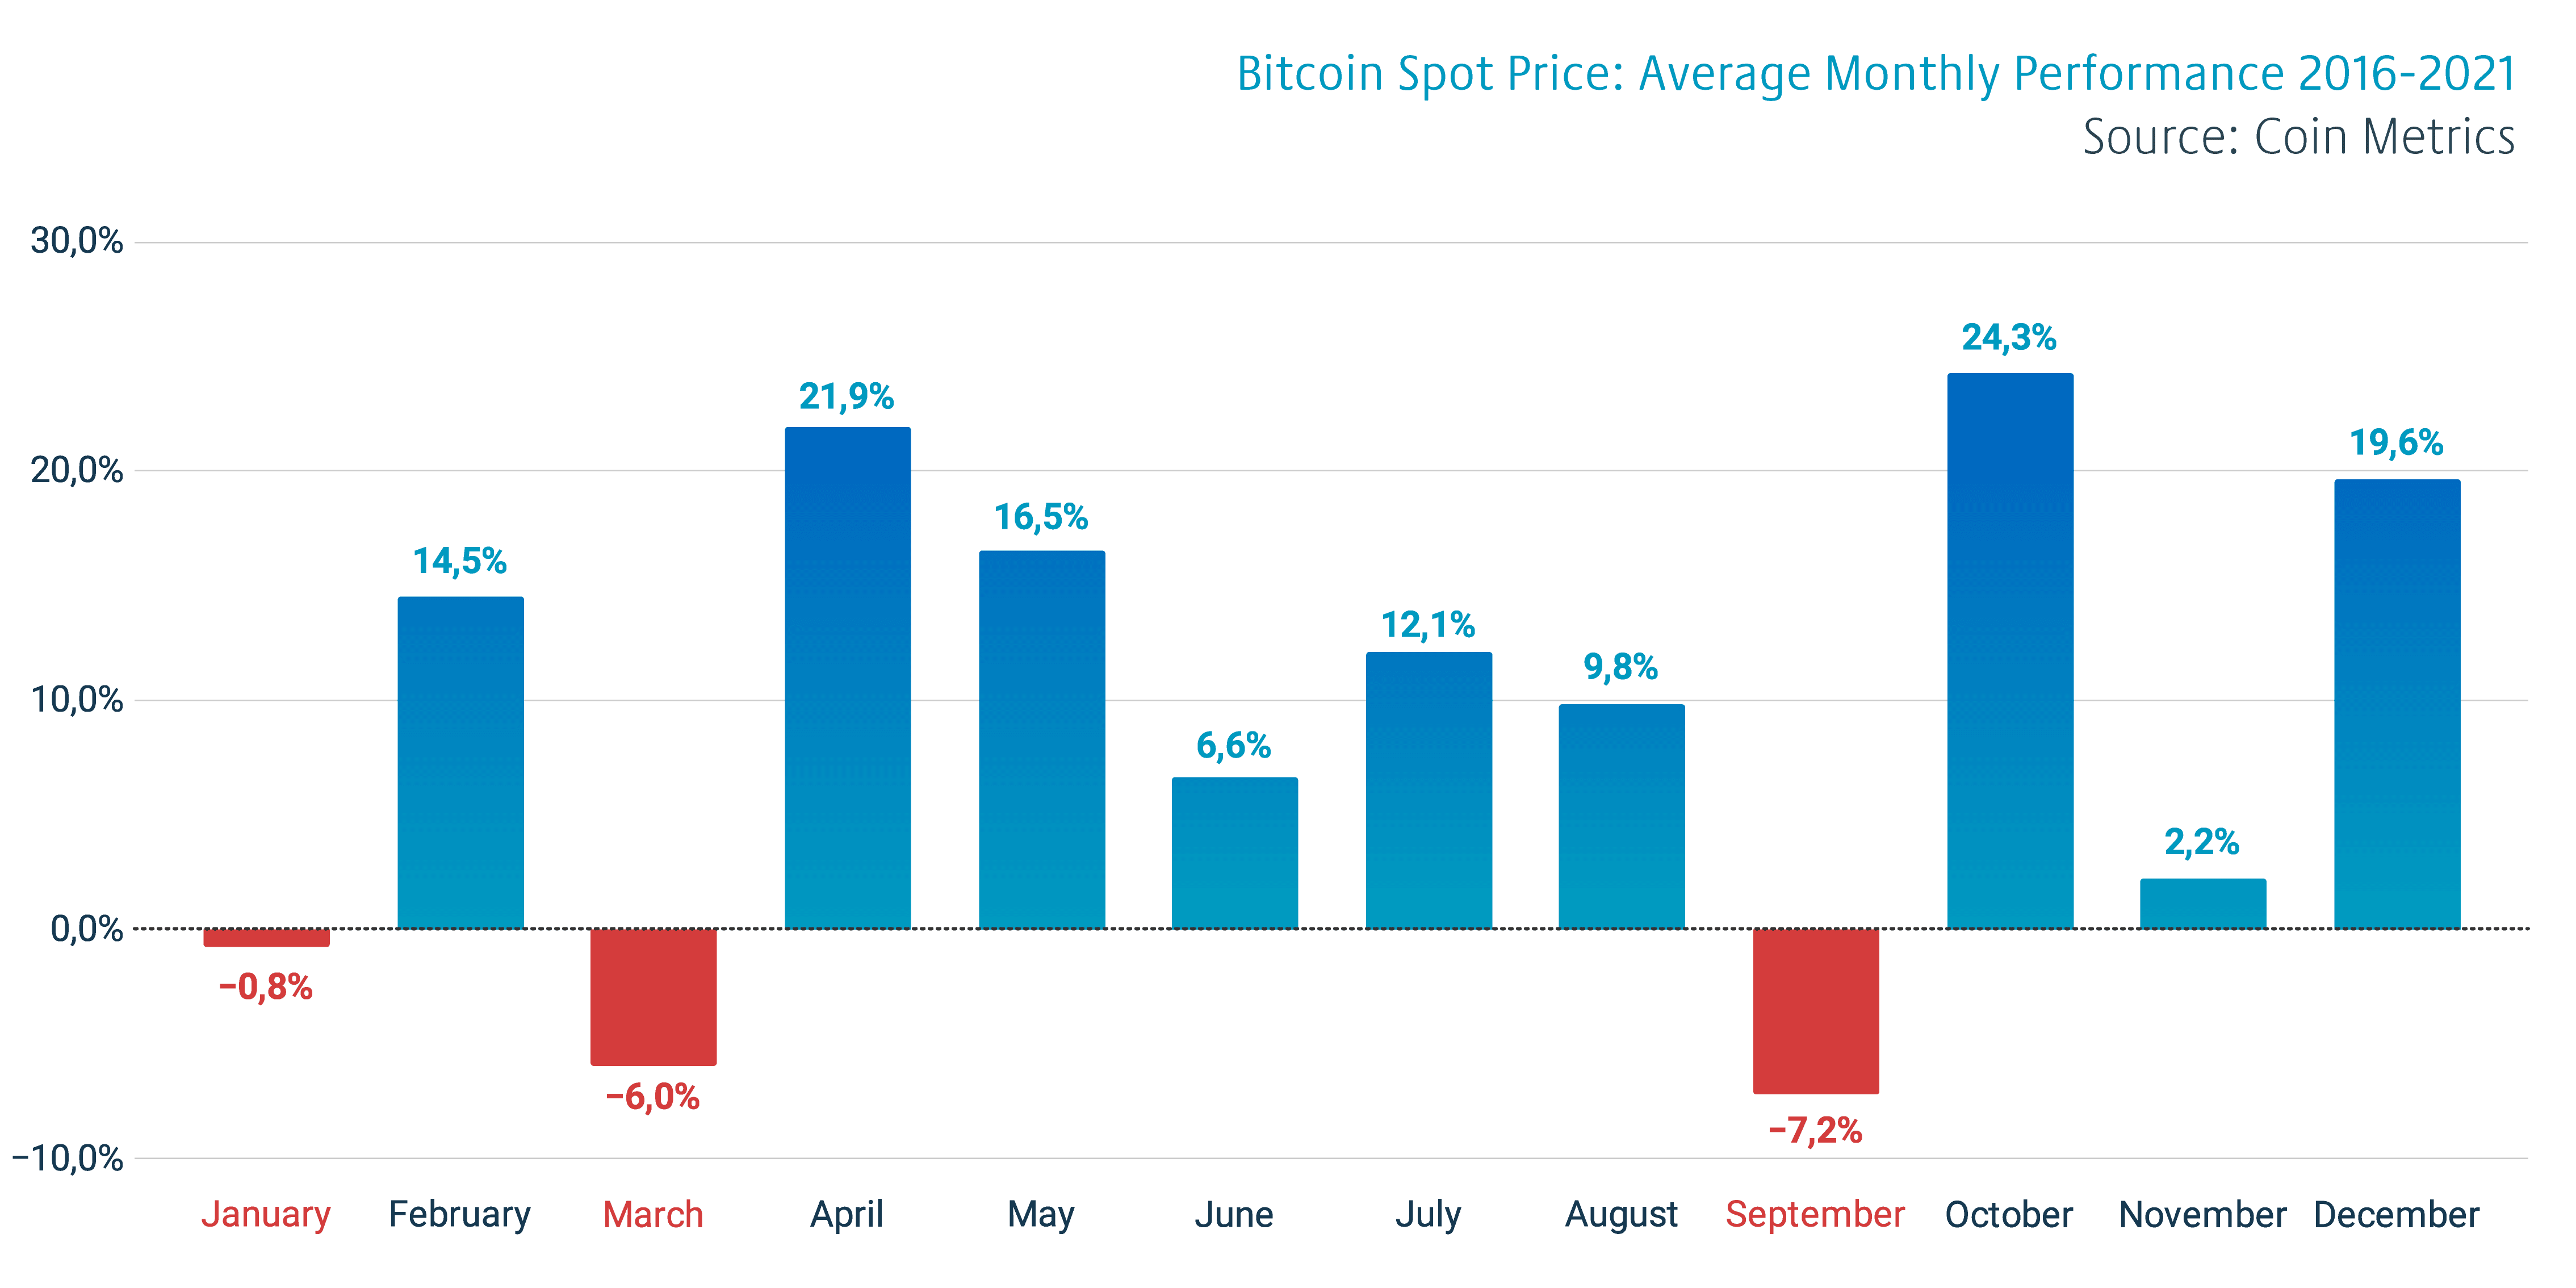
While bitcoin’s spot price only dropped -4,2 percent during the first quarter (Q1) of 2022, it is somewhat in line with the price performance of previous years. The data from 2016 to 2021 shows bitcoin’s average monthly performance being -0,8% for January, 14,5% for February, and -6% for March.
The price performance has usually ascended towards quarter two (Q2), as April historically had the second largest average price increase (21,9%) after October (24,3%). The price performance of second quarter months have systematically eclipsed Q1 and that gives us some statistical hope for Q2.2
”That’s the thing with network effects; there’s really no way to have network effects without having reflexive bubbles.”
– Alex Danco
SMALL-CAP TOKENS UNDER WATER
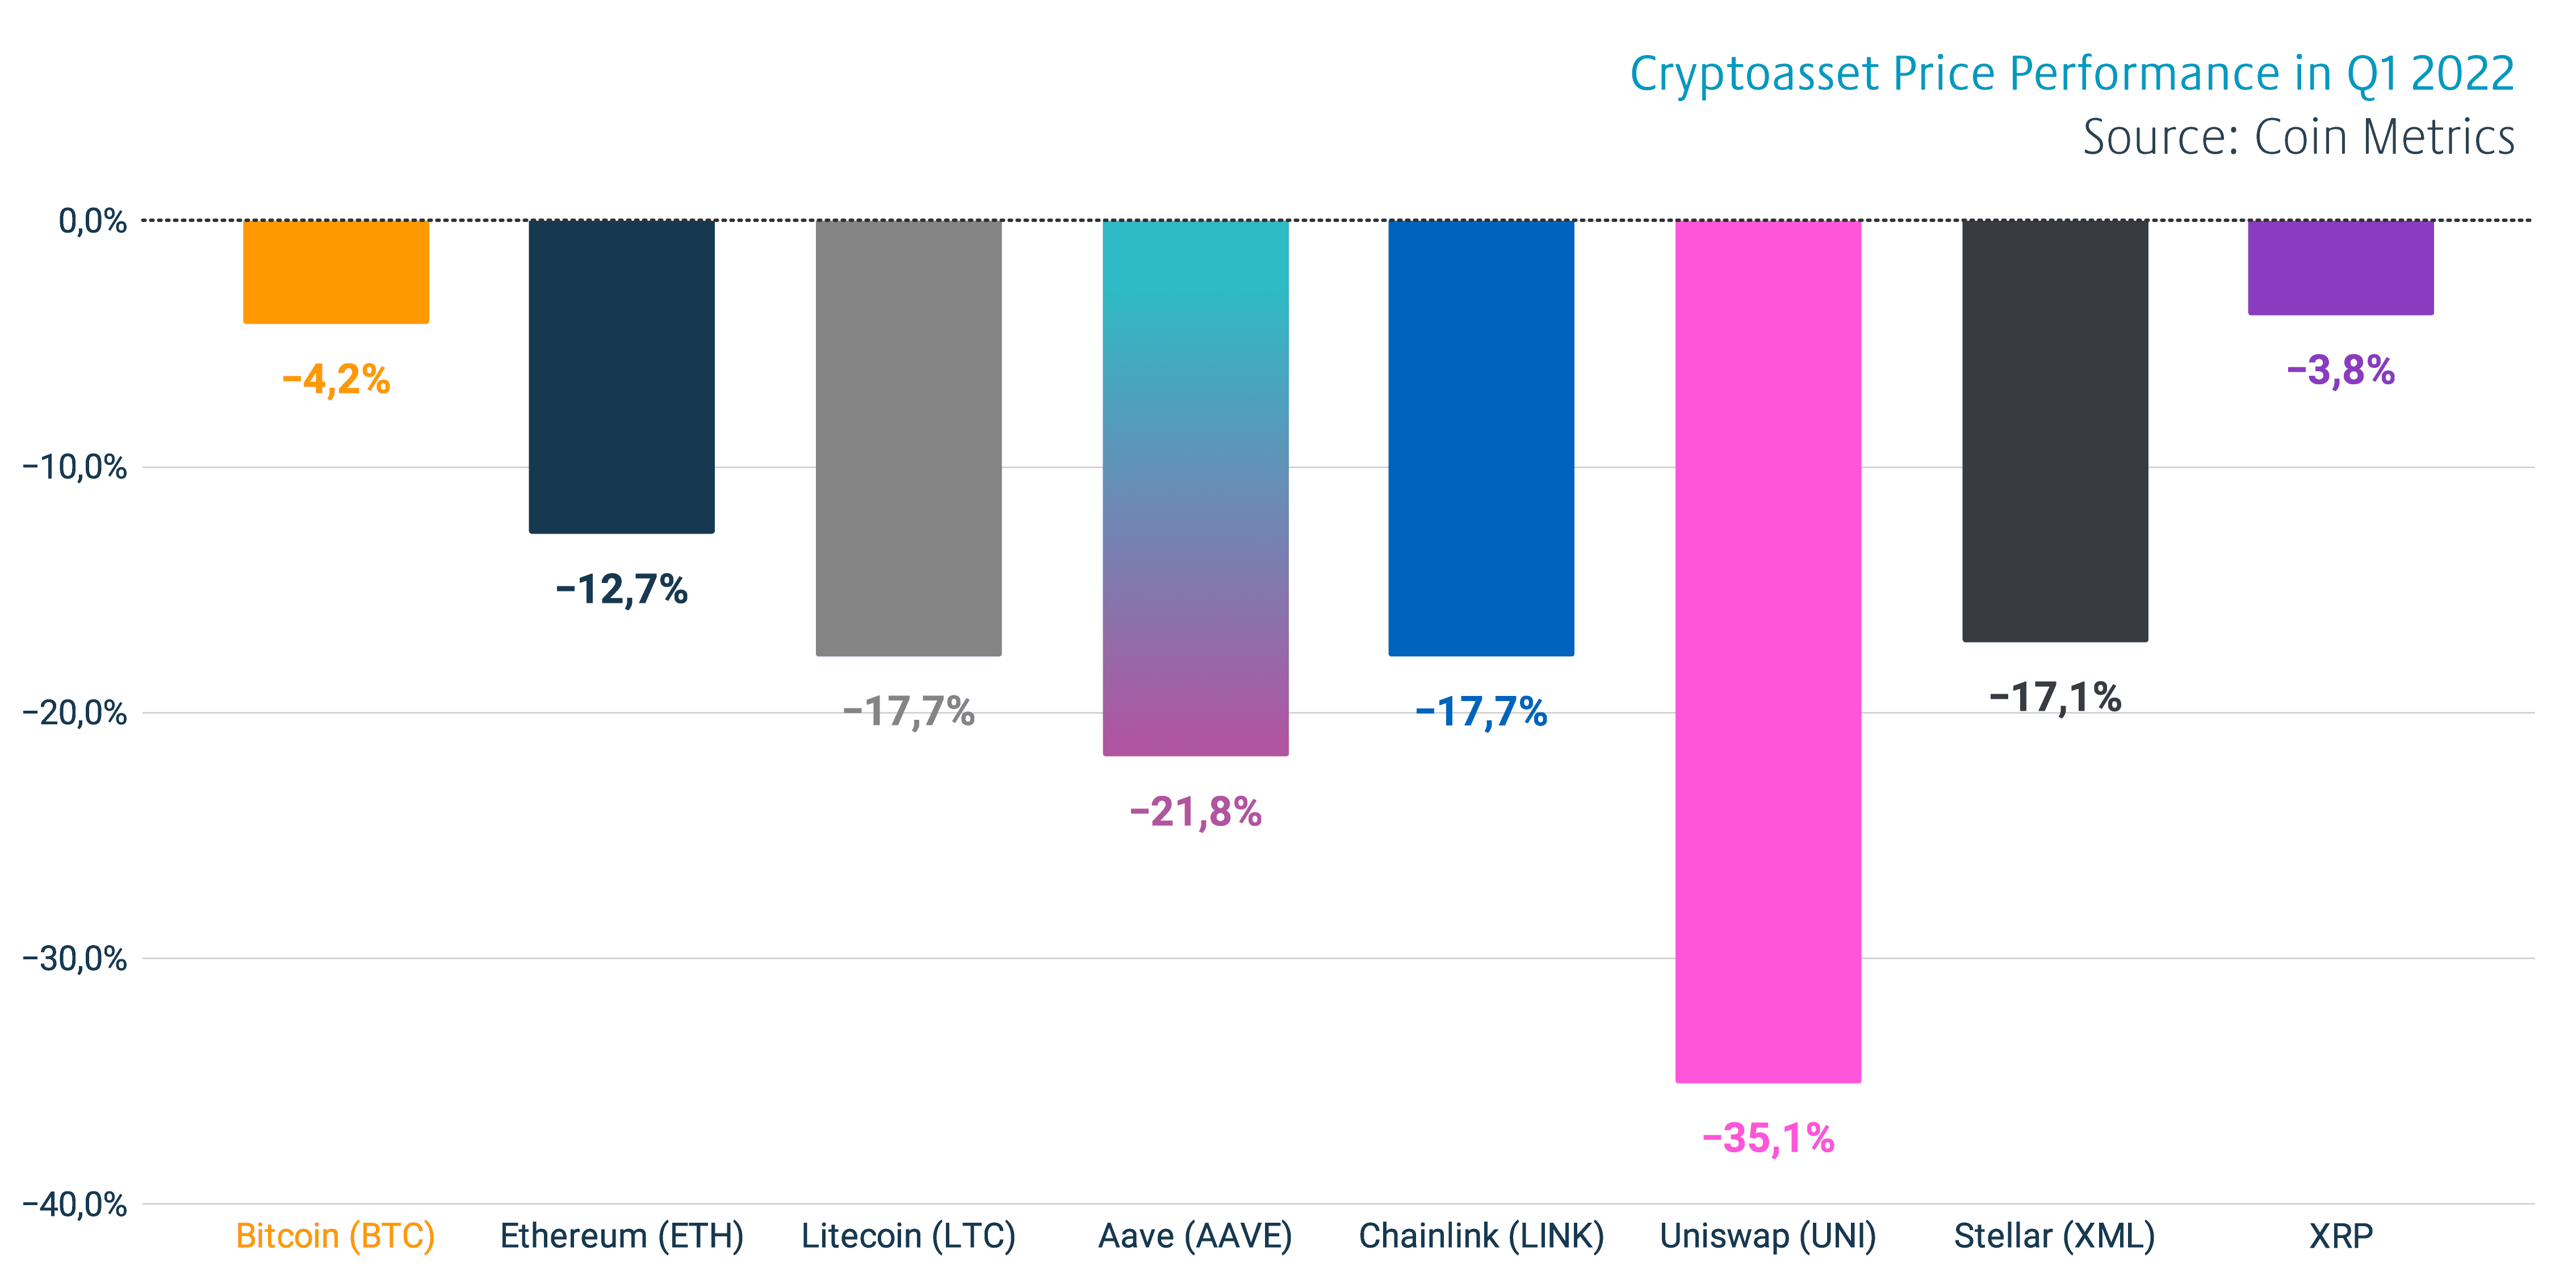
While bitcoin stayed well afloat during the Q1, smaller altcoins weakened considerably more. The leading decentralized finance (DeFi) platform Ethereum dropped -12,7 percent during the first quarter. Currencies like Litecoin, Chainlink, and Aave weakened in close proximity to -20%. The decentralized exchange (DEX) Uniswap descended -35%.
According to the historical data, altcoins and speculative decentralized finance (DeFi) tokens are more volatile than the leading cryptocurrencies Bitcoin and Ethereum. DeFi tokens like AAVE have higher beta than Bitcoin, as they have been offering higher returns combined with an increased risk profile.
RAW MATERIALS UP
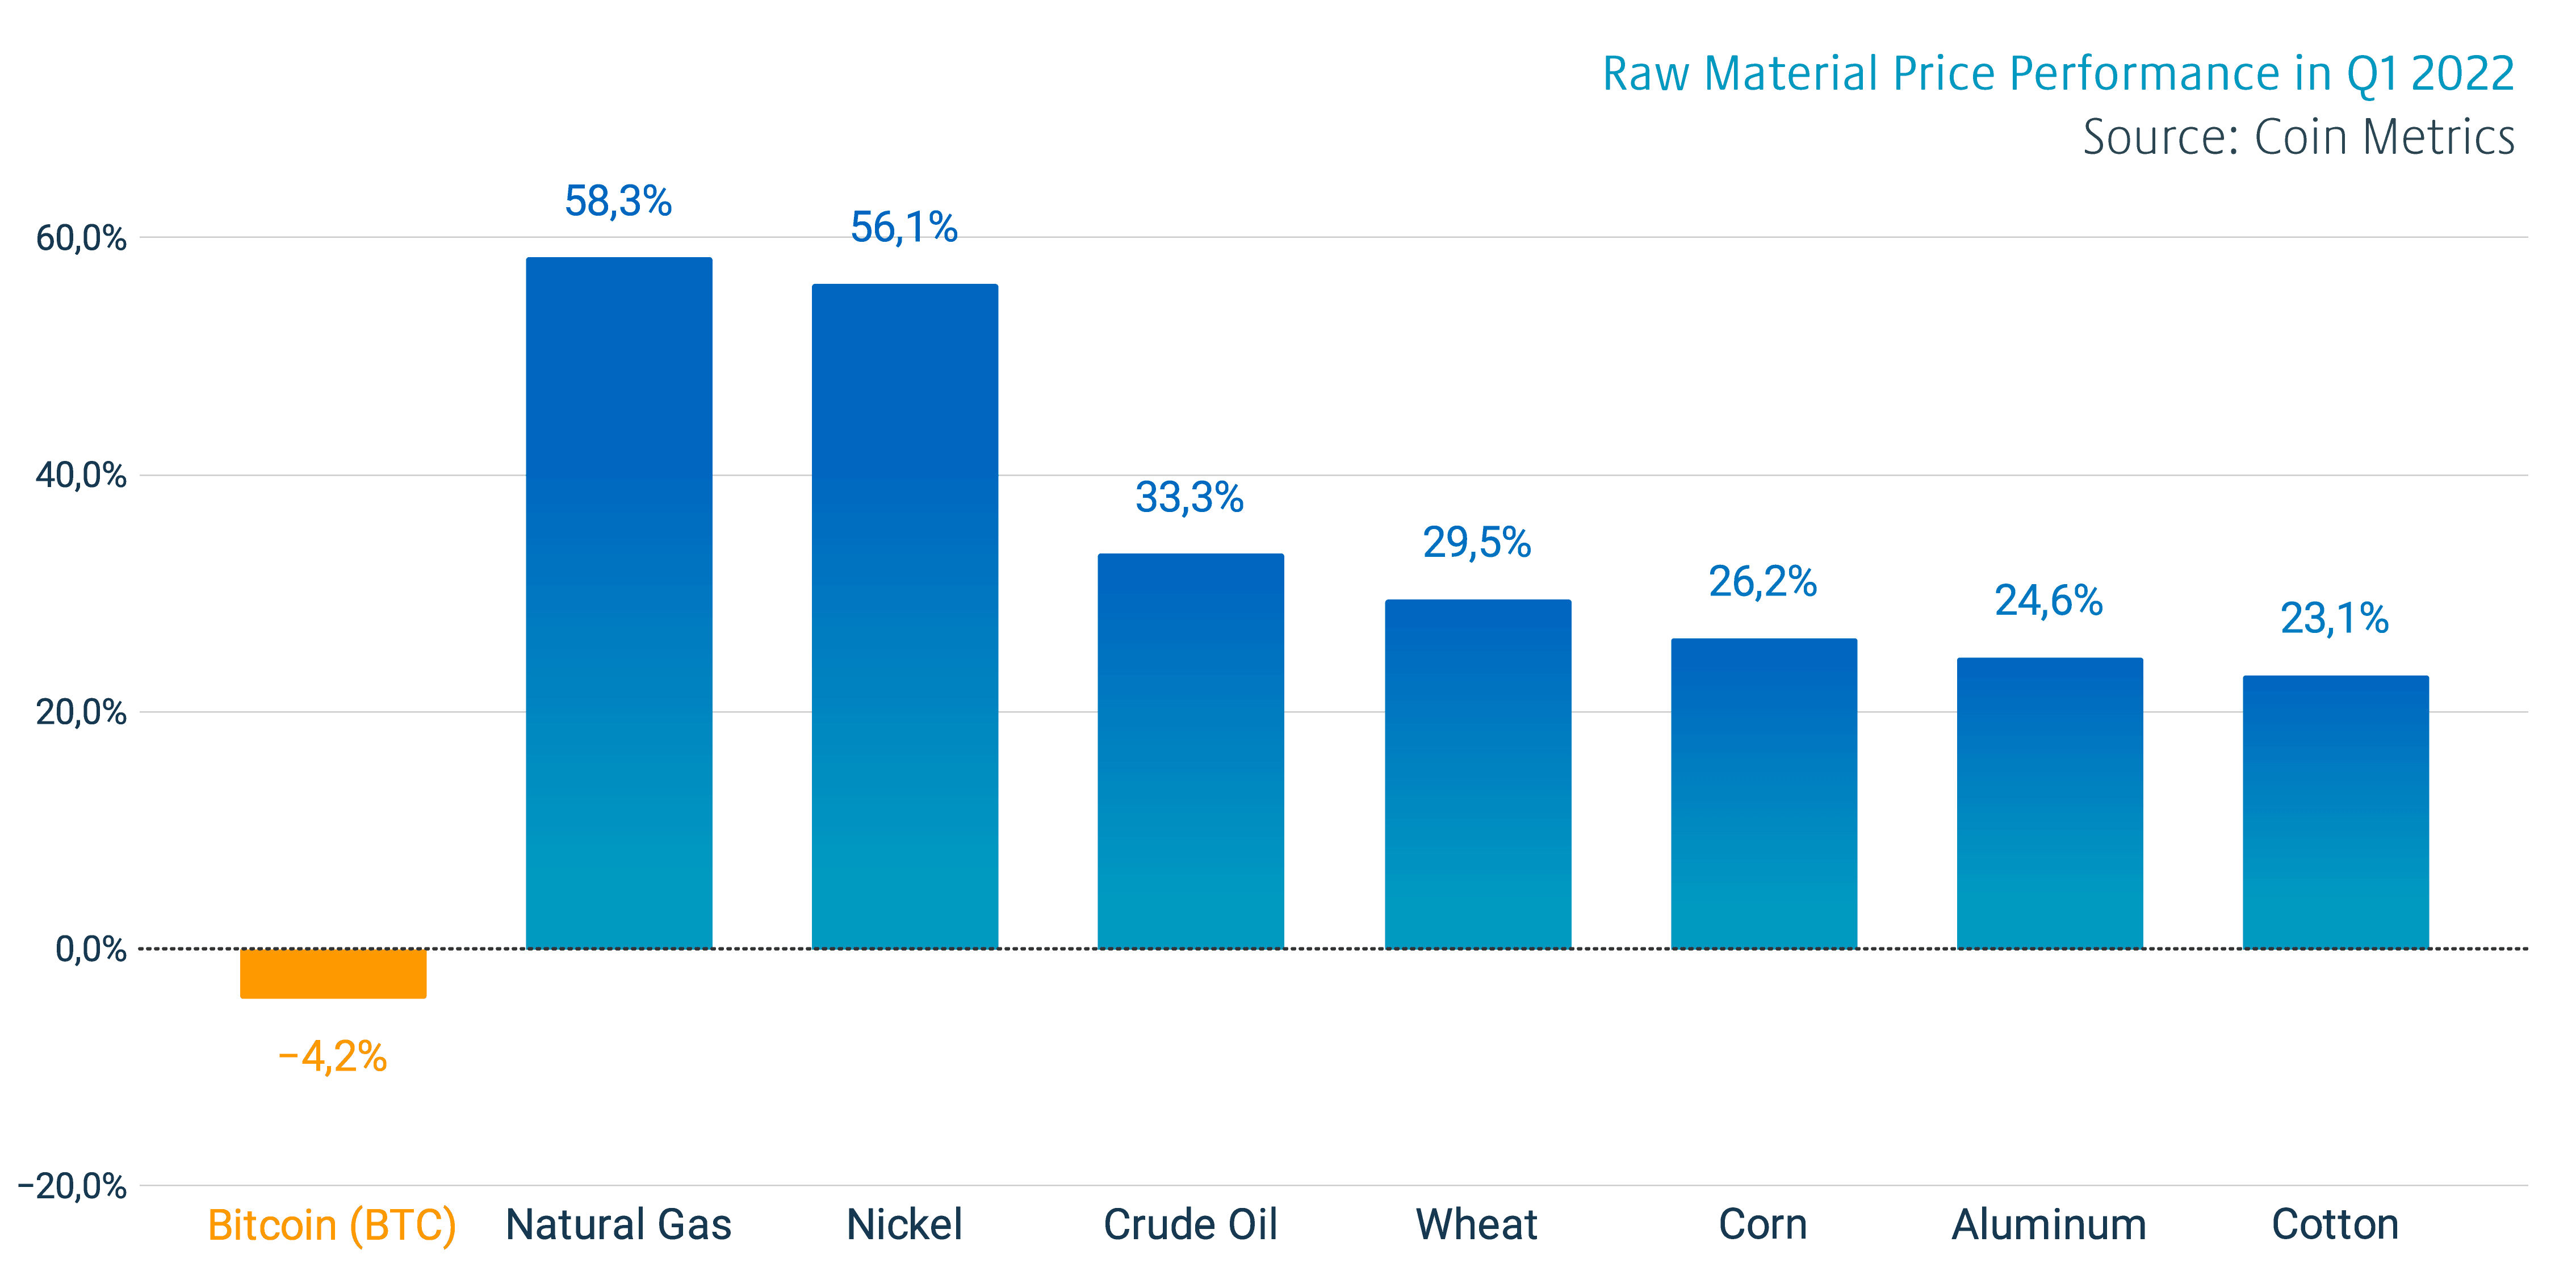
The current mainstream market is interpreting Bitcoin as a high beta asset and consequently it’s facing increasing selling pressure. Raw materials like natural gas, nickel, crude oil, and wheat are excelling in this environment. The combination of rising inflation, raw material scarcity, and supply chain issues is uplifting these physical assets.
The subprime mortgage crisis of 2008 was basically solved by drowning the whole market into new money. These exceptionally abundant monetary policies between years 2010 and 2022 uplifted many speculative asset classes in seemingly never ending bull cycle. If we consider this cycle as an epoch of leverage, it’s now heavily pivoting into a deleverage cycle. The post-Keynesian markets seem to favour raw materials and assets like Gold, other metals, and Bitcoin.
BITCOIN OUTPERFORMED MOST STOCK MARKET INDICES
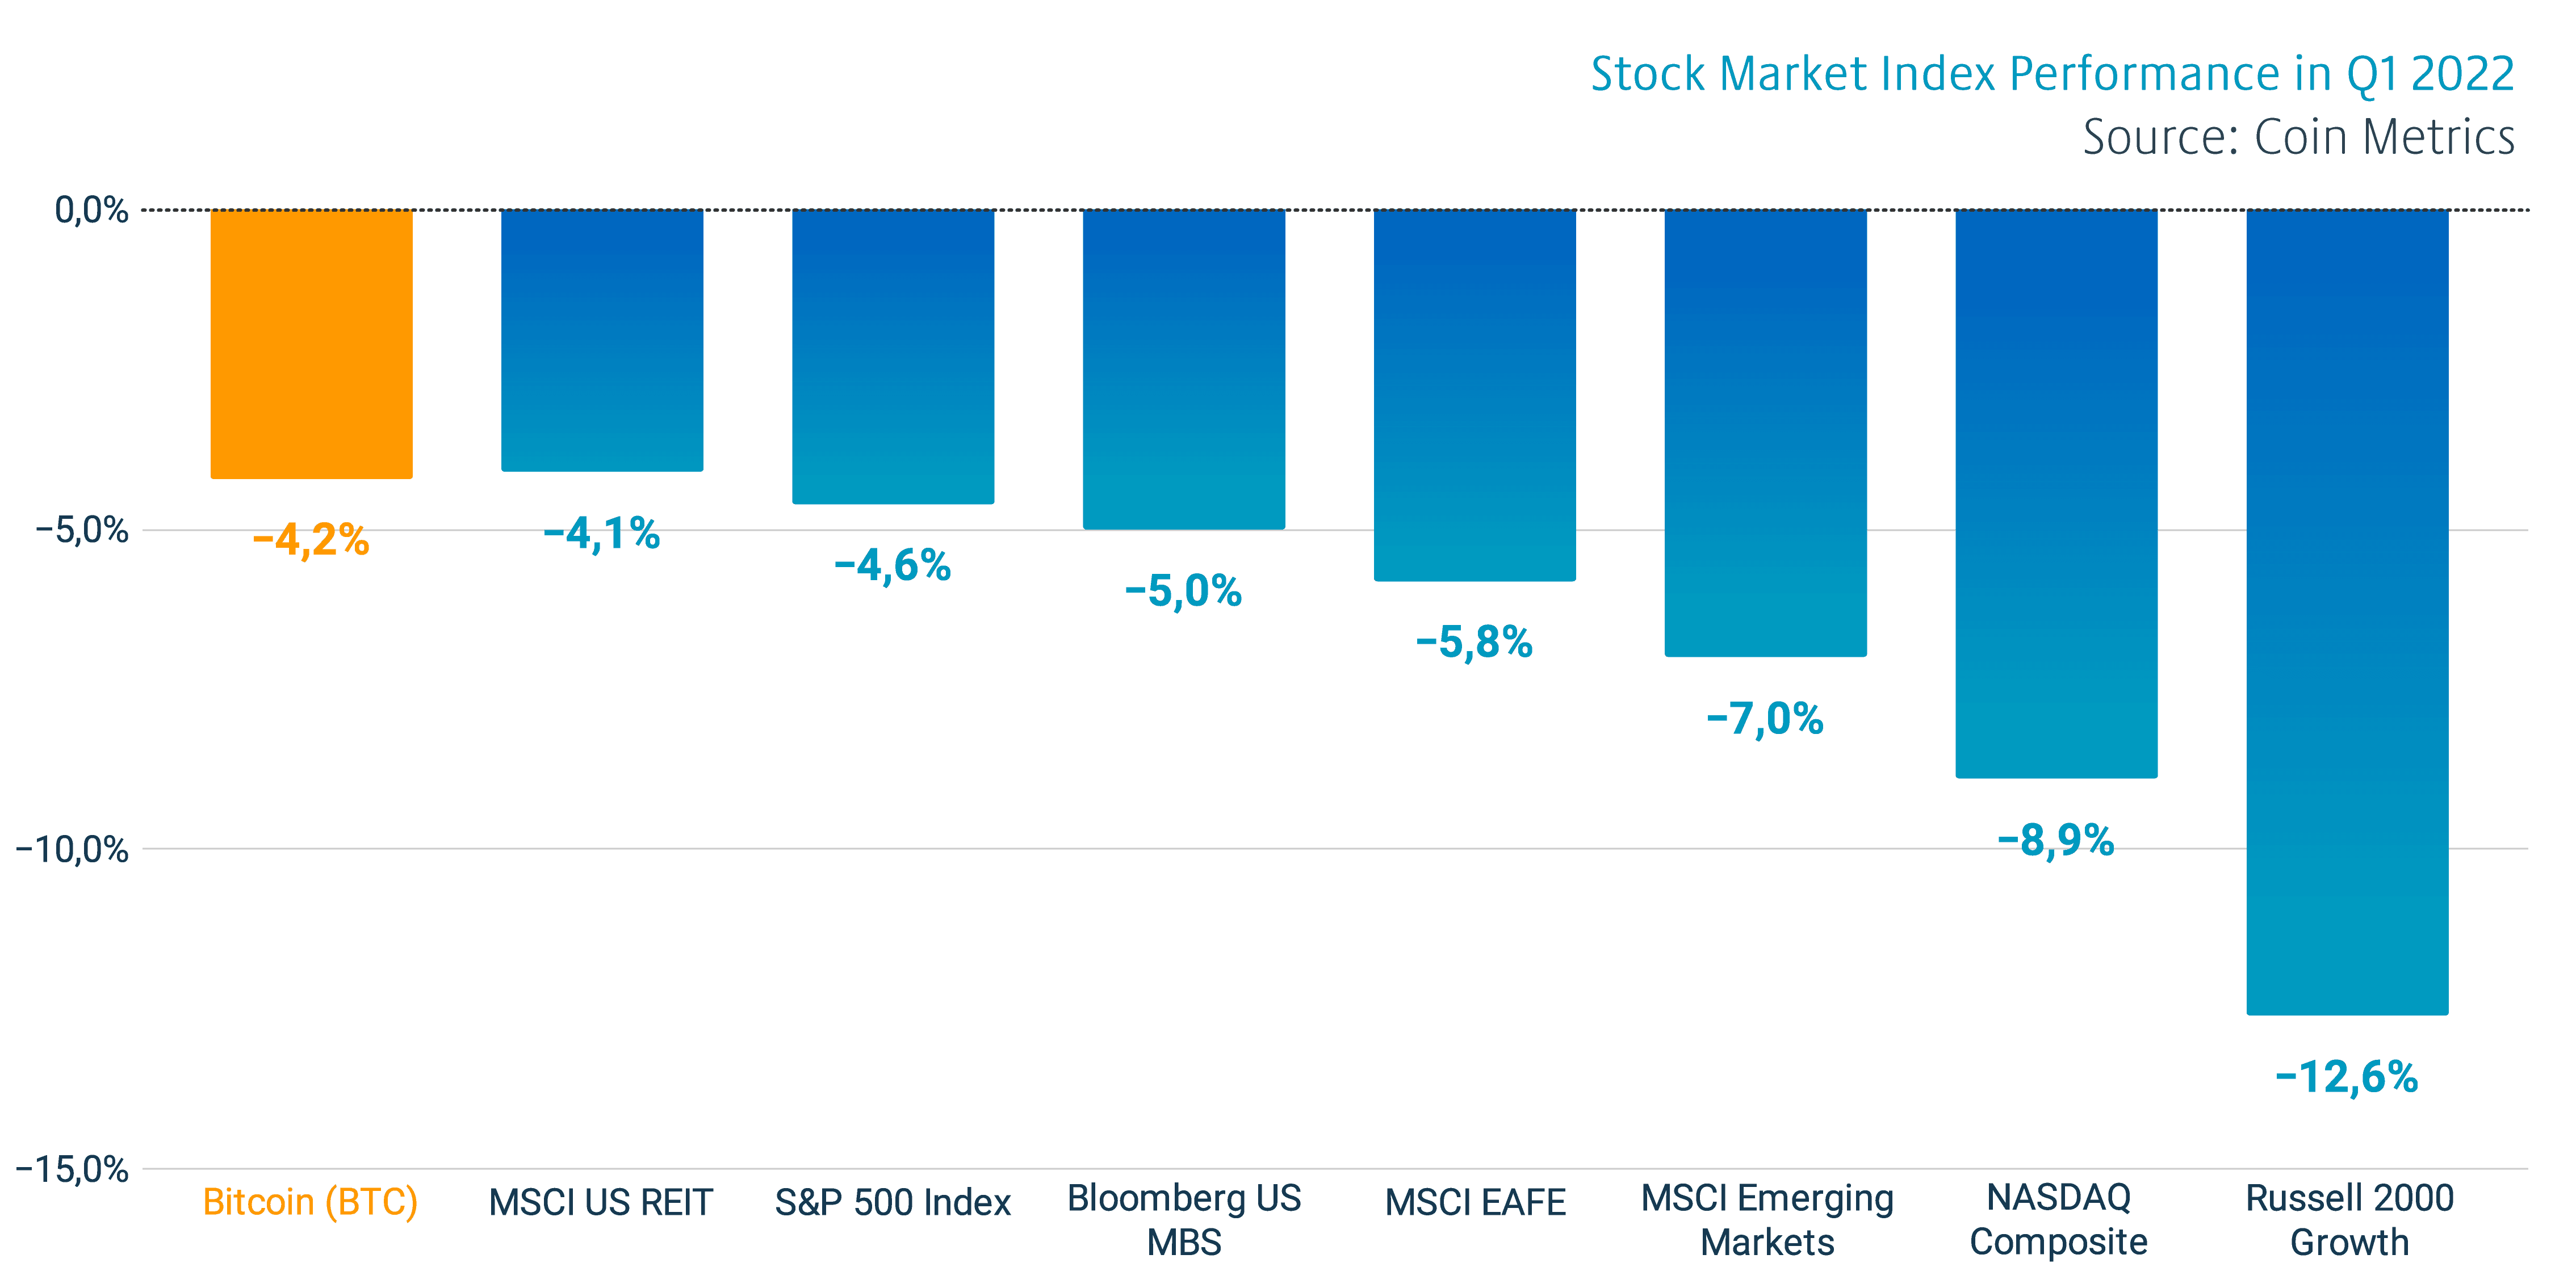
However when compared with technology stocks and other risk assets, bitcoin has fared fairly well. As bitcoin weakened -4,2 percent in Q1, S&P 500 Index dropped -4,6%. Nasdaq Composite weakened -8,9% in the same quarter, mirroring investors pulling out of the technology sector.
While Bitcoin has been relatively highly correlated with technology-related stocks, we’re expecting the correlation to weaken over time. Bitcoin will likely decouple from the stock market as more speculative money capitulates and exits the market. Historically Bitcoin’s correlation with the stock market has been low.
BITCOIN AS A REFLEXIVE ASSET
Although Bitcoin’s price has seen significant volatility during the first half of 2022, it’s important to remember reflexivity and volatility are part of Bitcoin’s very nature. Bitcoin is essentially held by multiple parties, either retail or institutional, and investment decisions are mostly made by humans. The investor behaviour itself creates strong reflexivity.
Reflexivity is a hypothesis that positive feedback loops between expectations and economic fundamentals can cause market trends that substantially and persistently deviate from equilibrium prices. George Soros, the main proponent of reflexivity, regards it as a source of success as an investor. Soros believes that reflexivity contradicts most of mainstream economic theory.
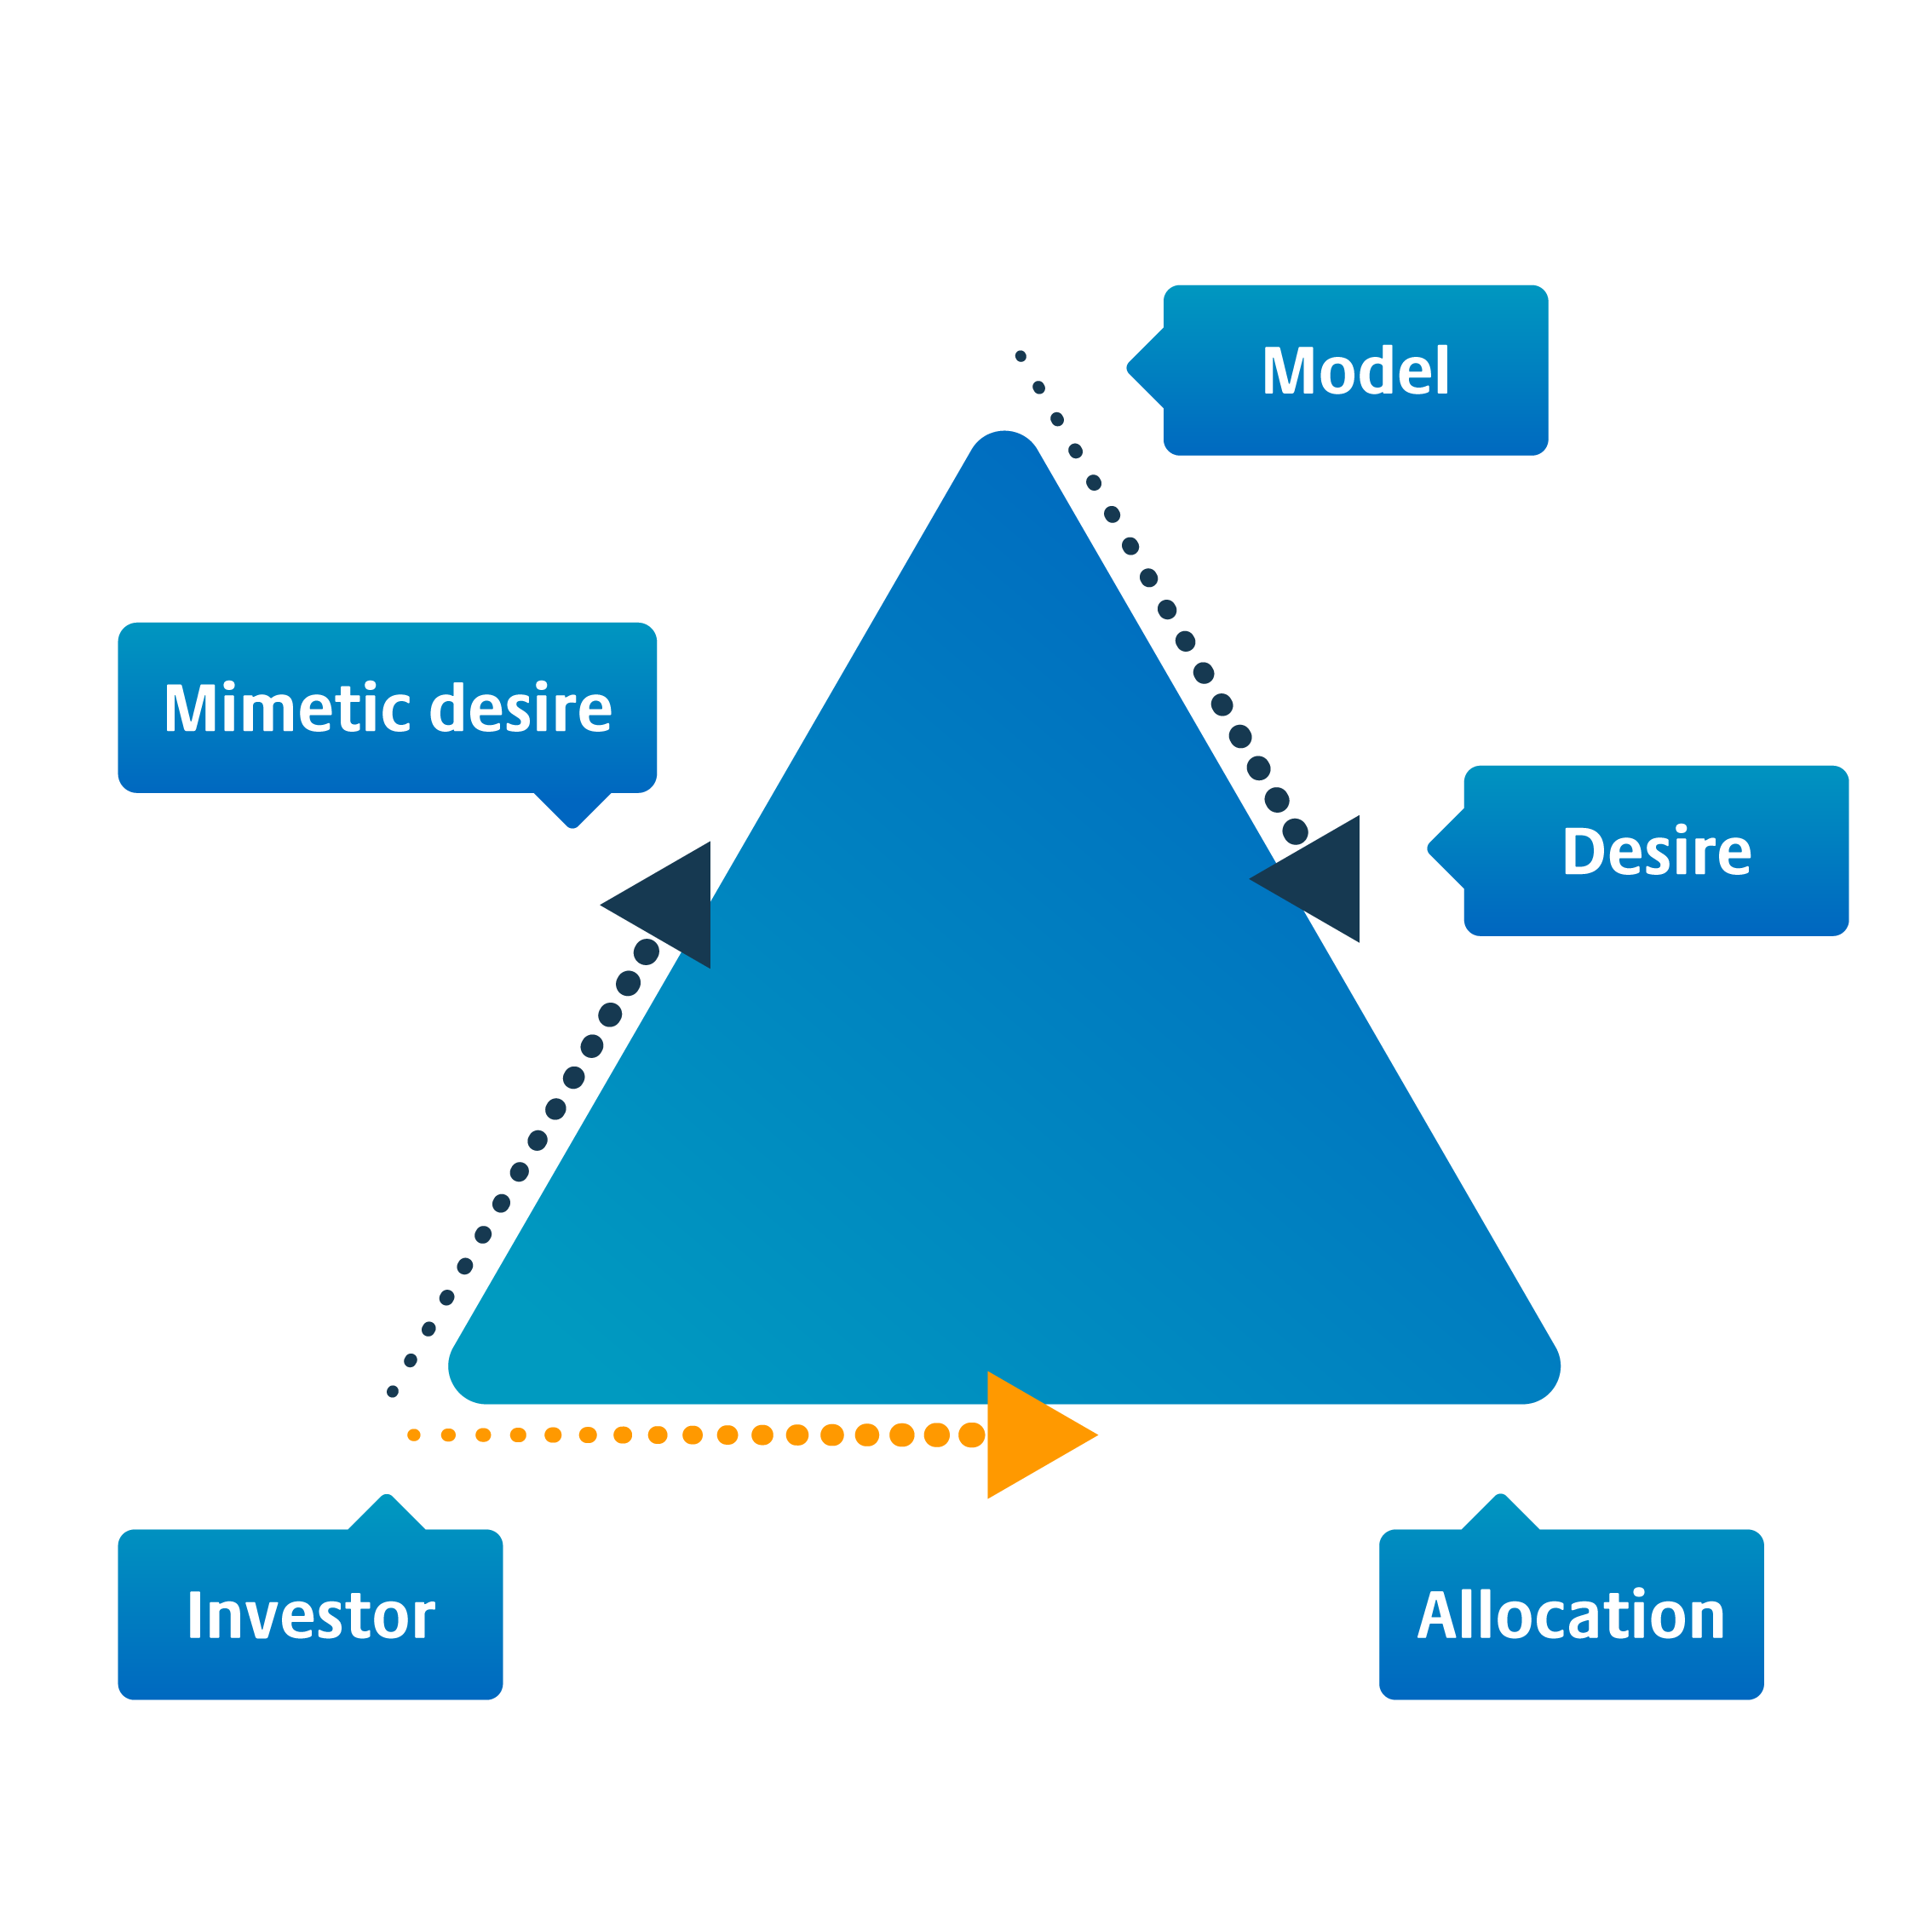
While the Bitcoin market is heavily reflexive, the recent institutional adoption has made it more mature. In 2020 Michael Saylor introduced his Institutional Bitcoin Thesis and paved the way for a new wave of demand. Smart money has a tendency to hold Bitcoin over longer time horizons, effectively curbing volatility.
COINMOTION RESEARCH’S CYCLE MODEL INDICATES ACCUMULATION
By using the block reward fee data, Coinmotion Research has built a model that divides the Bitcoin market into seven parts since 2015. The first obvious segment is the accumulation cycle from 2015 to 2016, when bitcoin was in three figures and extremely cheap to buy. In 2017 bitcoin started its parabolic advance and distribution phase, rising from January <$1000 to eventual >$19K in December. The parabolic advance attracted unprecedented investor attention, however it truly rewarded those who turned their accumulation mode on in early 2016.
The 2017 distribution phase was followed by a long accumulation period from 2018 to 2020, including a small distribution cycle during summer of 2019. The spot market really started to heat in mid-July 2020, following Michael Saylor‘s famous MicroStrategy purchases. Saylor and MSTR truly opened the flood gates for institutional appetite and following retail demand.
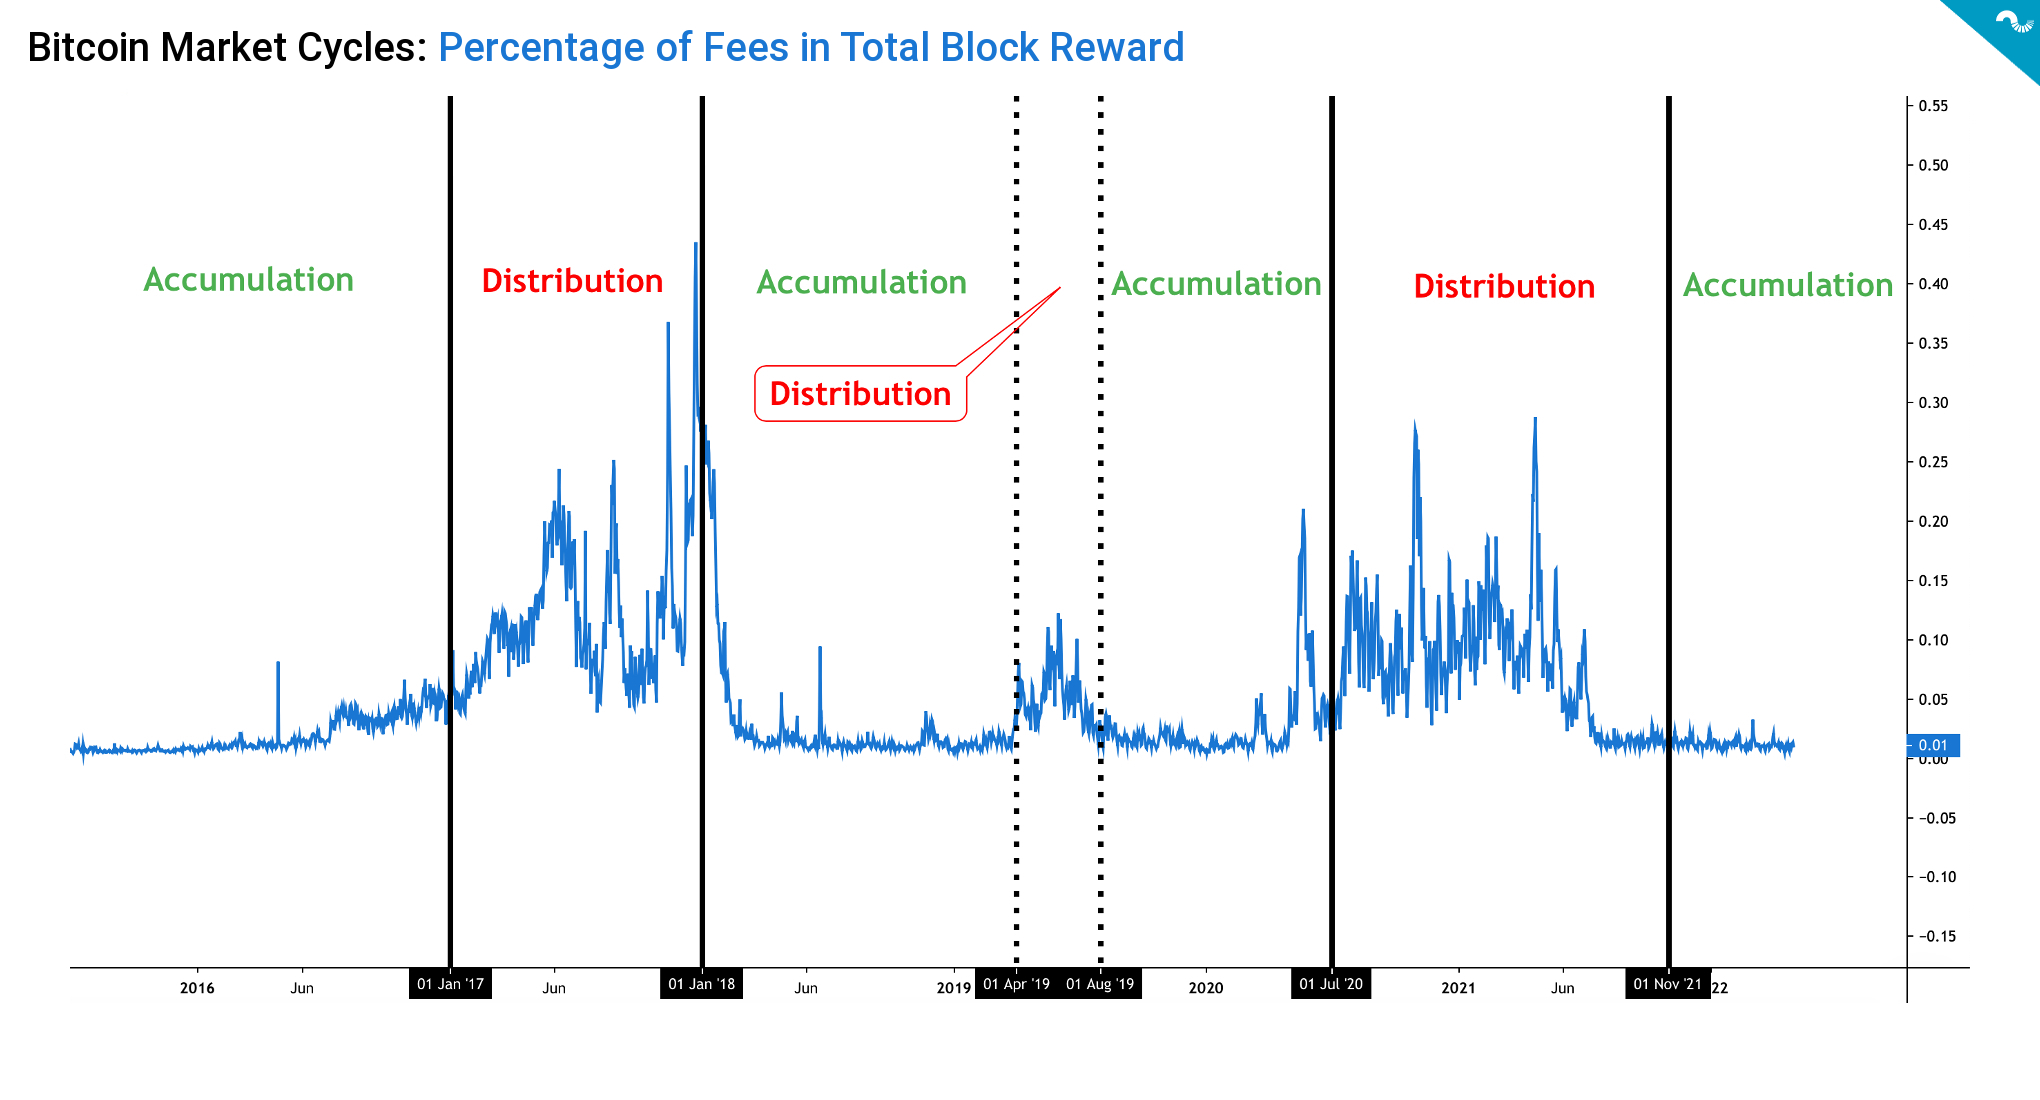
The next distribution phase was during the 2021 double-top spot market, heavily rewarding those who had accumulated in 2019 and 2020. As the model shows, we’re currently in an accumulation cycle again, lower spot price means cheaper coins for long-term game.
MICROSTRATEGY
The prominent Bitcoin institution MicroStrategy (MSTR) currently holds 129 218 bitcoin units, purchased using the dollar-cost averaging method (DCA). As the embedded chart shows MSTR has been consistently buying BTC since summer 2020. Michael Saylor recently announced that MicroStrategy plans to take on a $205 million loan to buy more bitcoins.
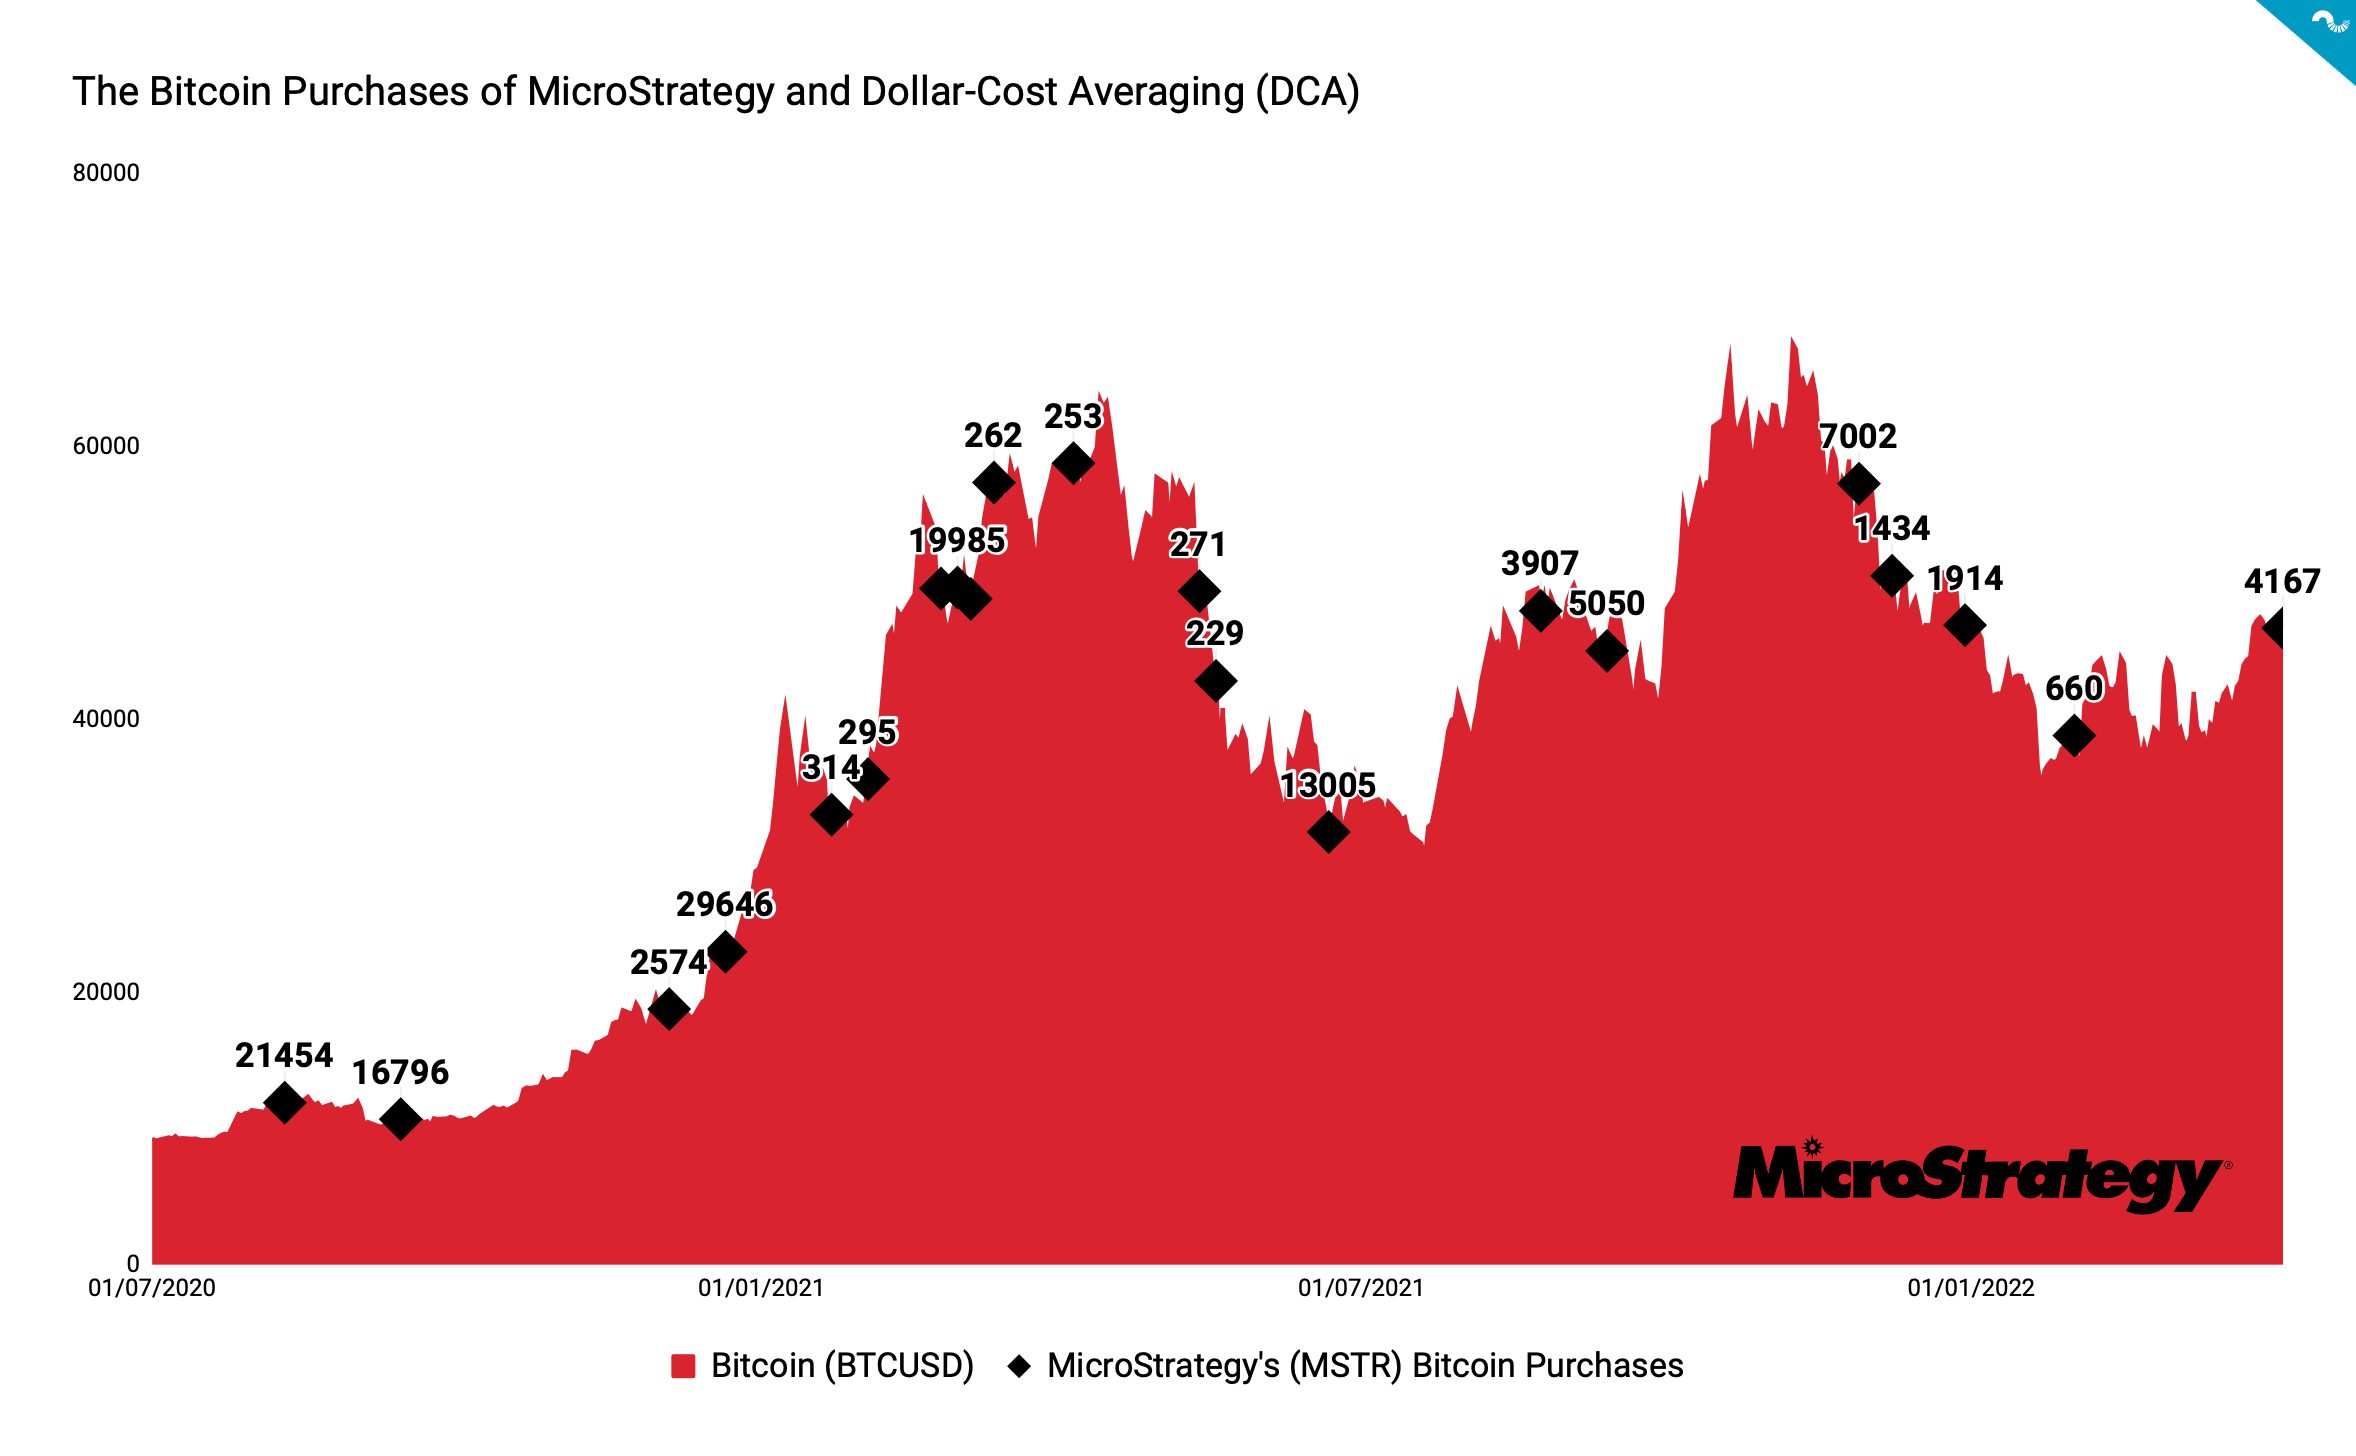
MicroStrategy is seen as the pioneering Bitcoin institution and it started its journey back in the summer of 2020, when CEO Michael Saylor announced a new strategy to replace USD-based reserves with alternative assets. Saylor has since published his famous Institutional Bitcoin Thesis, which highlights defensive, opportunistic, and strategic aspects.
WHALES
The cryptoasset markets are heavily influenced by whales, who by the common definition own at least 1000 native bitcoin units. Whales are known to make smart entries and exits compared with the retail investor segment and many analysts try to interpret their behavior.
Looking back at the year 2021, whale activity heavily increased in the parabolic spot price advance of quarter one (Q1). The amount of native bitcoin units in whale addresses peaked in early February 2021 at 8,06 million BTC. Then the whales started a sudden de-risk campaign, reducing their exposure to 7,78 million units in mid-April. This means that whales front-runned retail again and anticipated the overheated market and subsequent correction in May. The whales de-risked well before May’s huge spot correction.
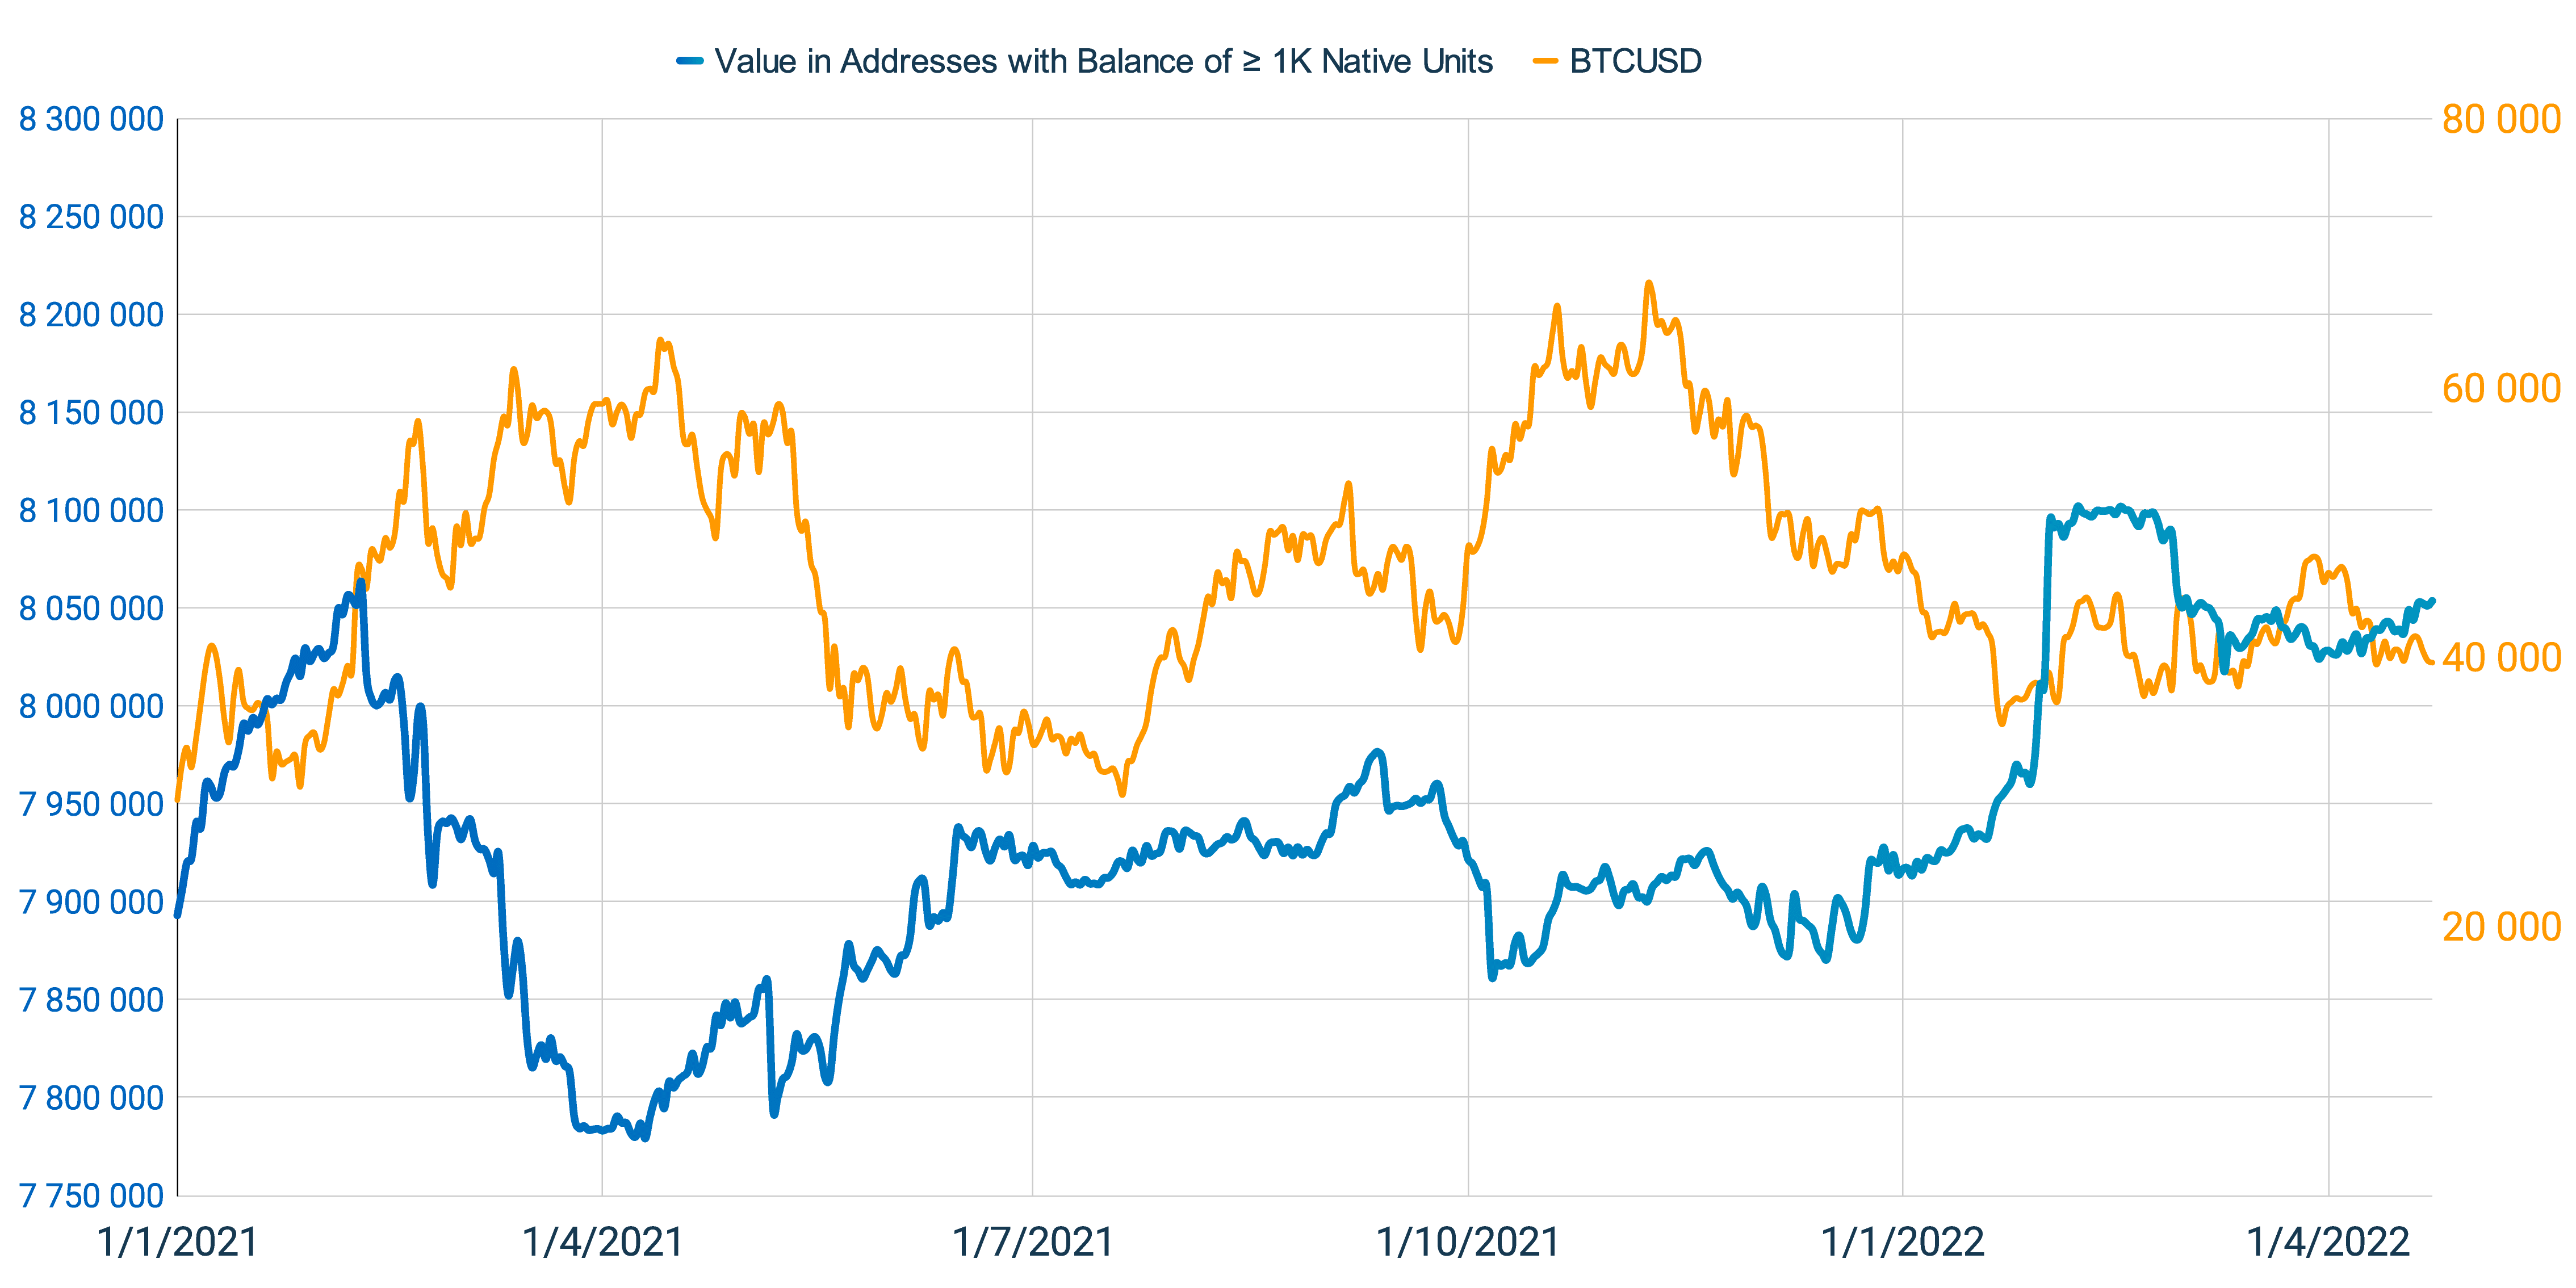
The whales started to accumulate against falling spot price during summer of 2021 and continued buys until late September. In early October whales de-risked mildly and have continued to buy again in early weeks of 2022. Whales are currently in re-accumulation mode, despite the heavily weakening spot price.
LONG & SHORT TERM INVESTORS
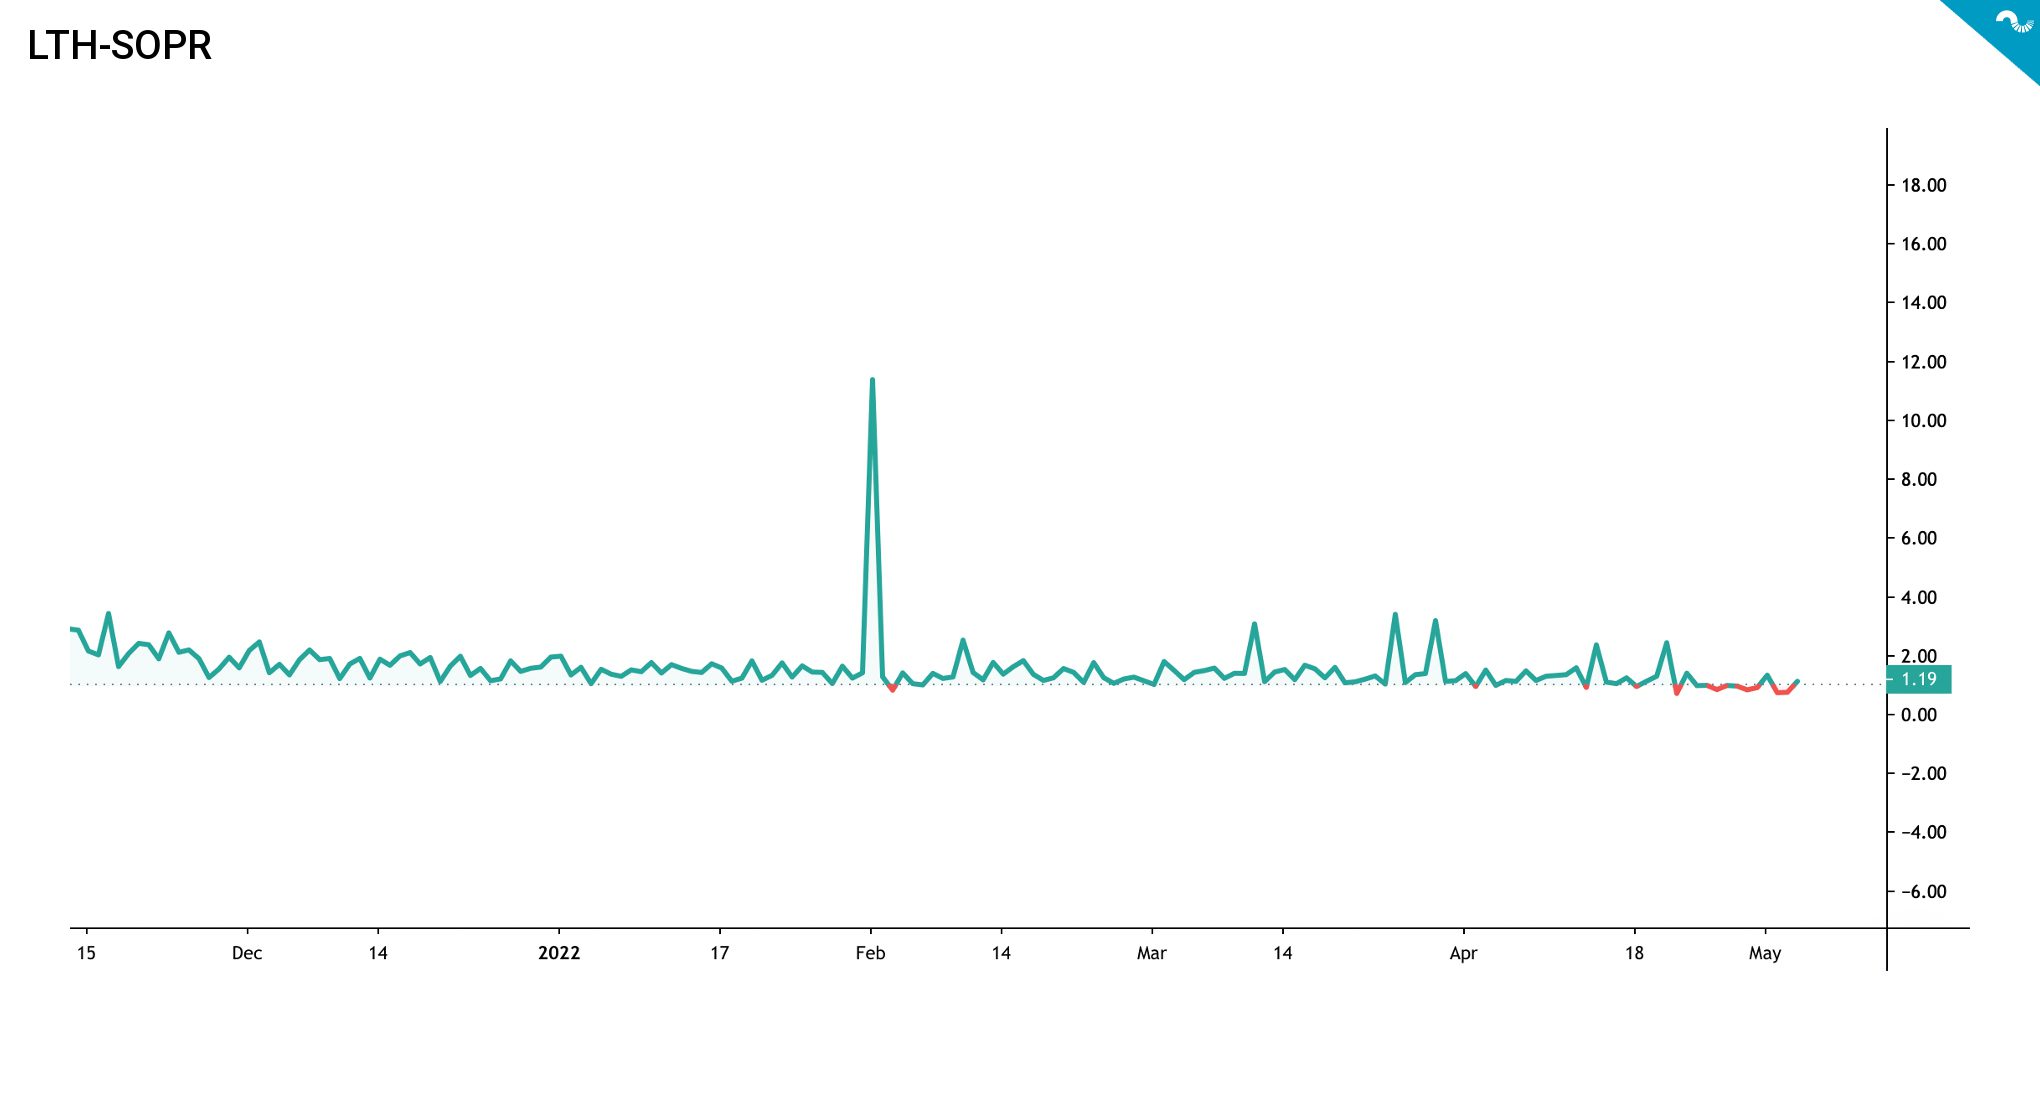
As we know Bitcoin favours long-term holders as an asset. On a long enough time horizon Bitcoin can always be seen to be in a bull market. The success of long-term strategy is more than just an investment narrative and it can be proven by Spent Output Profit Ratio (SOPR).
The SOPR indicator, originally created by Renato Shirakashi, is calculated by dividing the realised value (USD) by the value at creation of the output. SOPR indicator is usually divided into Short-Term Holder SOPR (STH-SOPR), and Long-Term Holder SOPR (LTH-SOPR), indicating if long and short term investors are at profit or loss. Or more simply: Price sold divided by price paid. SOPR indicator can be interpreted by following logic:
SOPR > 1 = Sellers at Profit
SOPR < 1 = Sellers at Loss
As we can see, the long-term holders are still largely in profit, although LTH-SOPR momentarily dropped below one in April. The SOPR indicator mirrors if sellers are at loss, meaning that long-term holders are still unaffected.
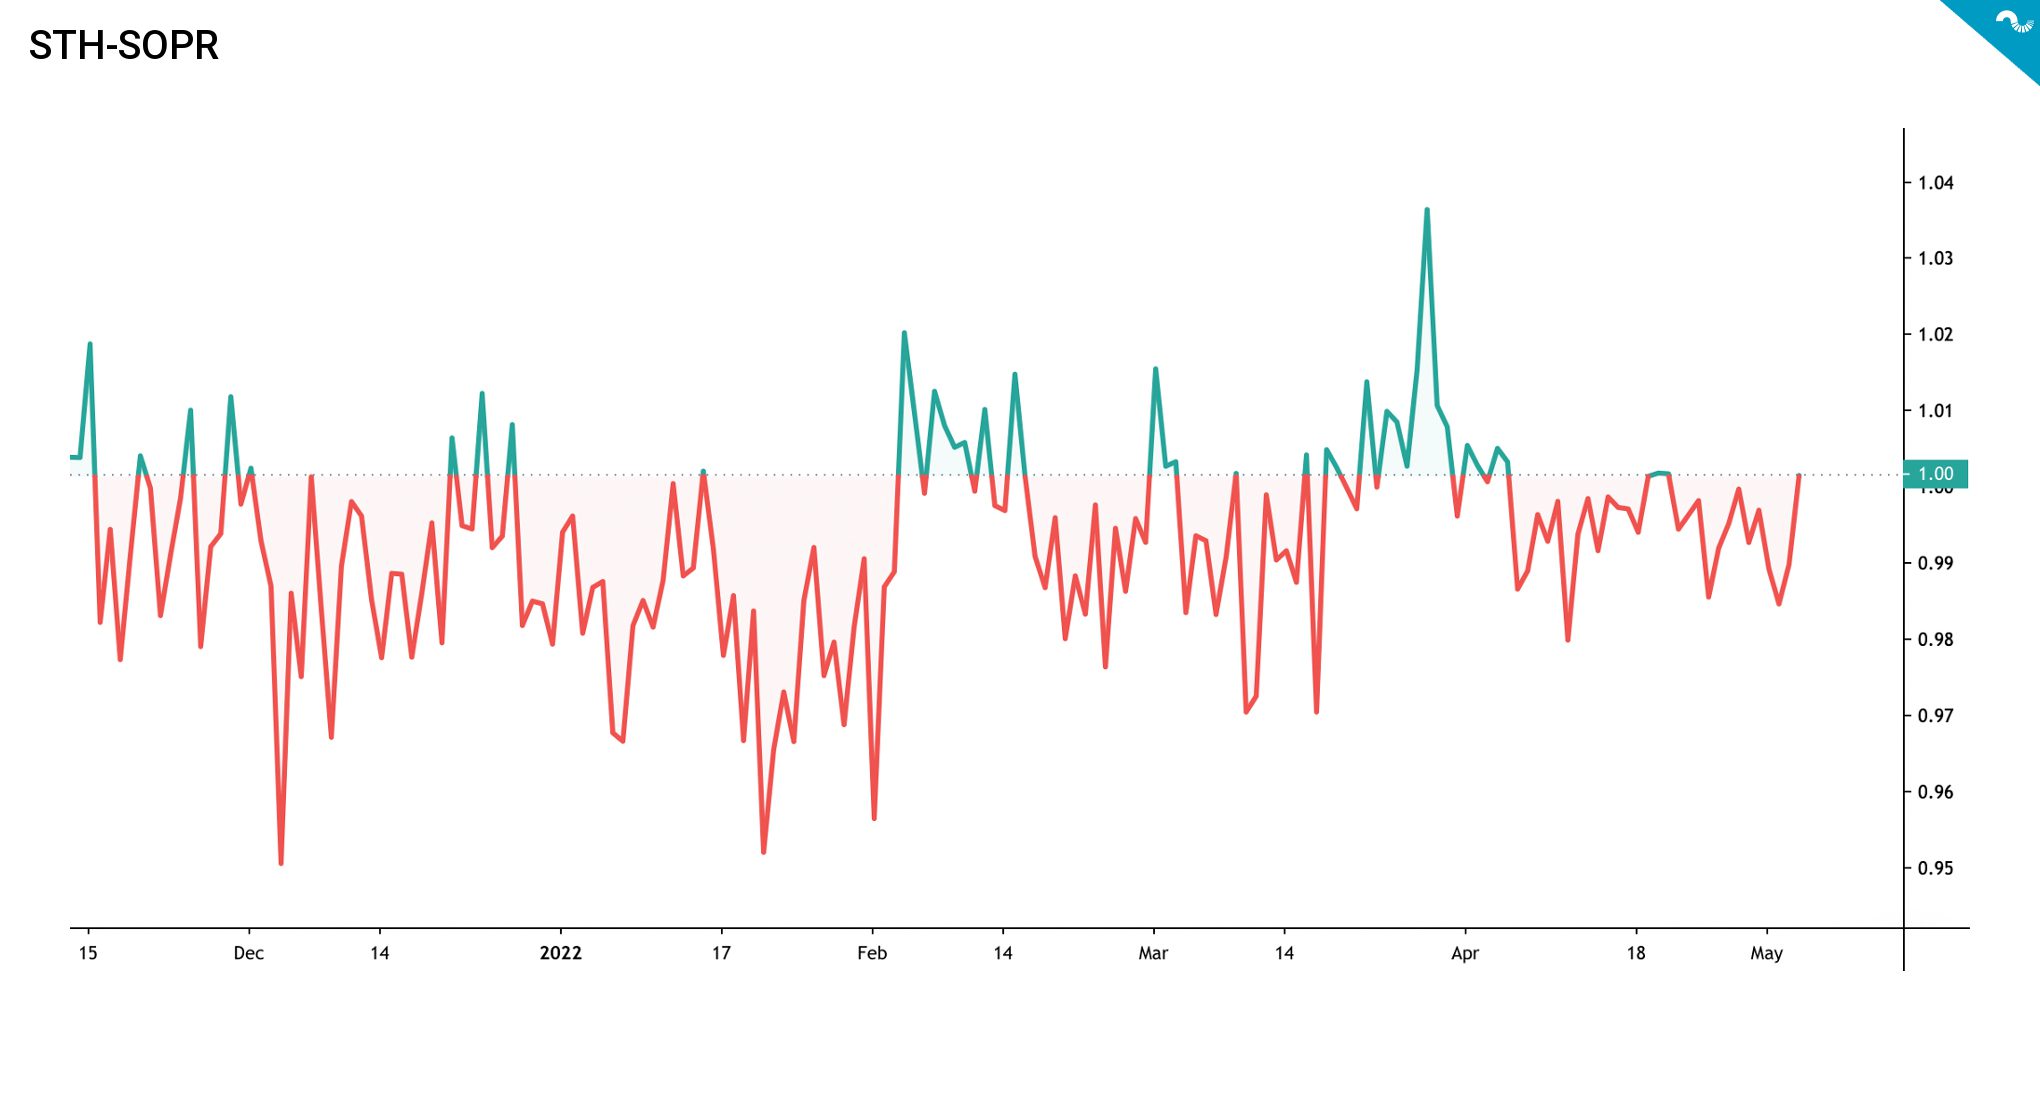
The SOPR data of short term holders looks fundamentally different. As we can see the chart is largely painted in red, indicating losses and below one SOPR. Short-term holder SOPR even climbert to 1,03 during late March relief rally, however the big picture seems rather negative. The data clearly supports our thesis of holding over short term trading.
”Crypto sits at the intersection of 3 mega trends:
1. Financial: rise of alts, decline of 60/40
2. Tech: software eating old industries, proliferation of open source
3. Social/organizational: declining trust in govt & private institutions, concern over privacy”
– Hunter Horsley, Bitwise
BITCOIN HODL WAVES (UTXO AGE DISTRIBUTION)
When Satoshi Nakamoto created Bitcoin, he built a structure that required a significant amount of work (PoW), unlike traditional currencies that can be minted from thin air. In contrast to traditional currencies, the Bitcoin blockchain is also transparent, allowing anyone to see what’s happening under the surface. This transparency allows us to examine the active supply and unconfirmed transaction output, called UTXO. The active supply metric tracks the fraction of supply active in the trailing period specified, allowing for interpretation of how active given cryptocurrency tranches are.
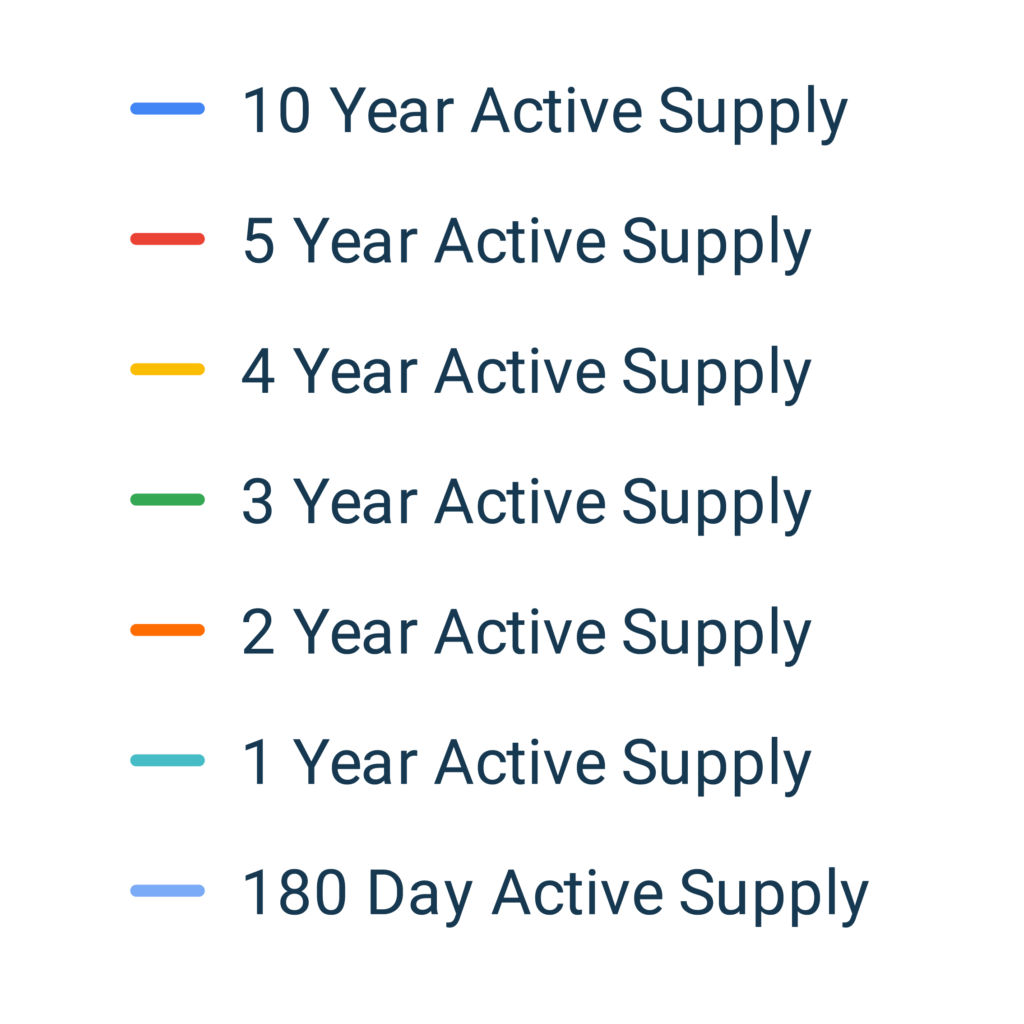
Let’s explore the following UTXO bands. There’s clear accumulation in 10-year active supply, showing long-term holders keeping the line. The second longest UTXO band also shows accumulation, as it mirrors institutional accumulation. The 4 and 3 year bands
10Y Active Supply: Accumulation
5Y Active Supply: Accumulation
4Y Active Supply: Selling Pressure
3Y Active Supply: Moderate Selling Pressure
2Y Active Supply: Accumulation
1Y Active Supply: Selling Pressure
180D Active Supply: Moderate Selling Pressure
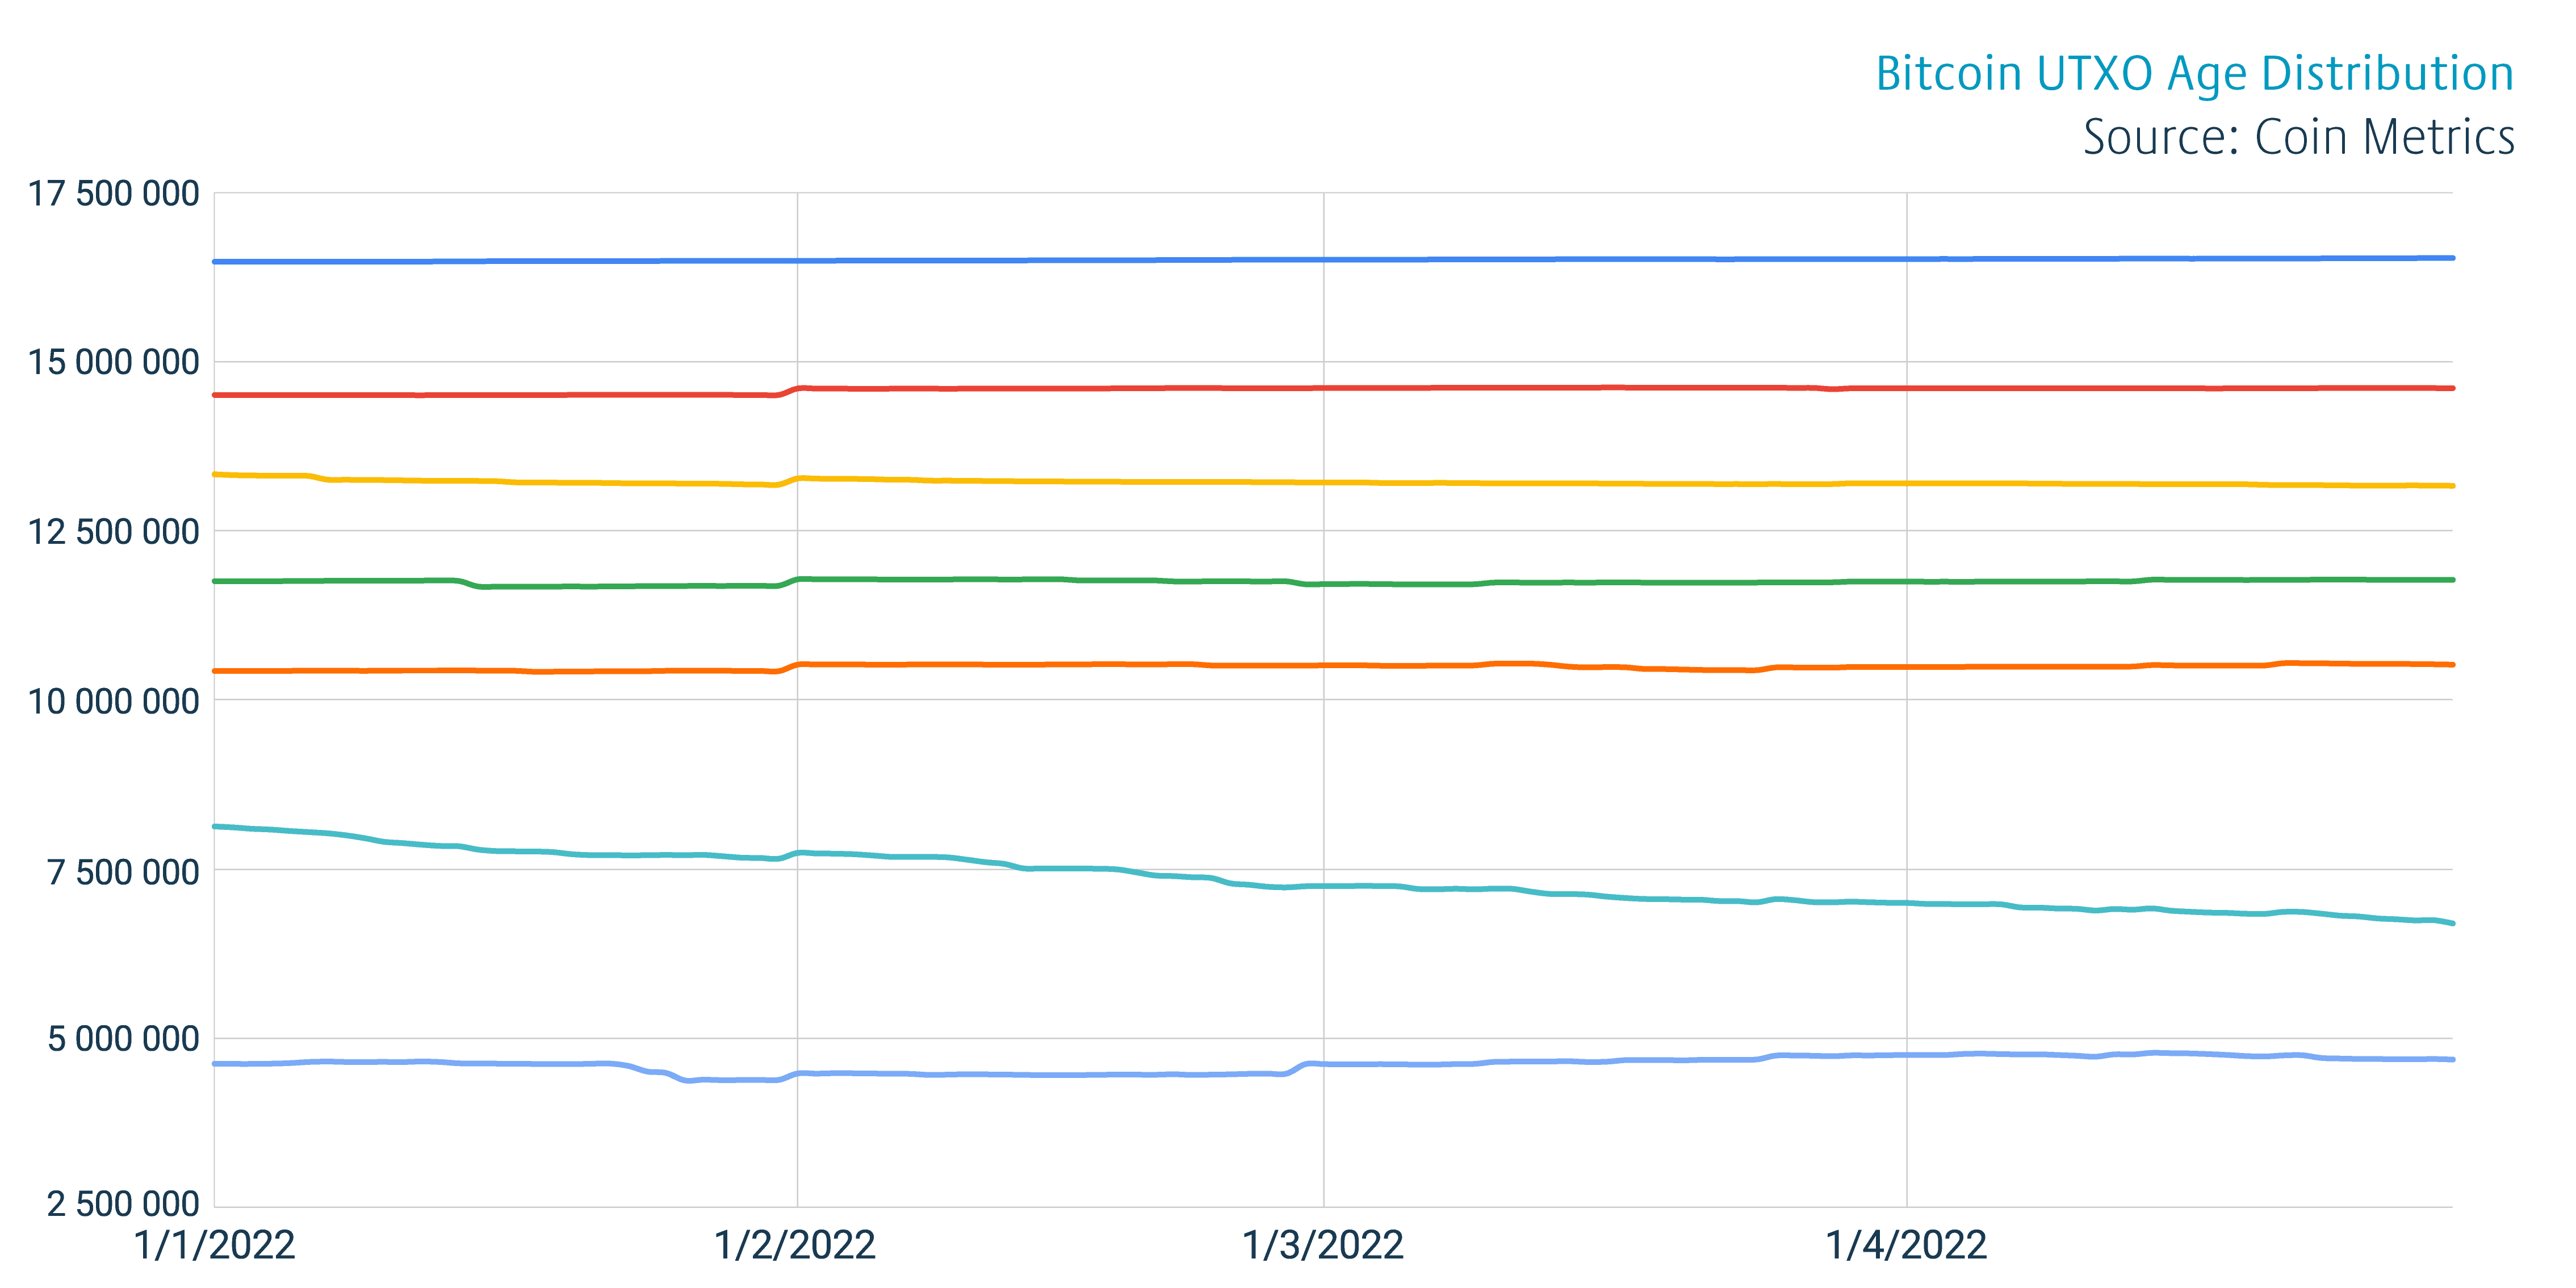
As we can see the UTXO data supports the current paradigm of long-term holder accumulation and growing weakness in shorter term cohorts. The 10 year active supply wave has been going sideways for years, presenting no significant change in ultra long-term investor behaviour. These bitcoin investors are “holders of last resort” and they likely just hold regardless of the spot price. The 3Y-5Y waves are showing steady holding combined with slight selling pressure, these waves represent long-term holders and also institutional investors. The 2 year (2Y) active supply looks particularly promising, mirroring coins moving to long-term hands. Shorter cohorts show de-risking and increasing selling pressure.
BITCOIN DOMINANCE
Bitcoin’s dominance was inching below 40 percent at the turn of 2021 and 2022, effectively ending a multi-year trend of Bitcoin market capitalization dominance. The index hasn’t been this low for years and last time Bitcoin dipped below 40% happened during summer of 2018. Bitcoin momentarily crossed above 70% dominance in early 2021’s bull cycle, but has been losing relative market share to other digital assets since.
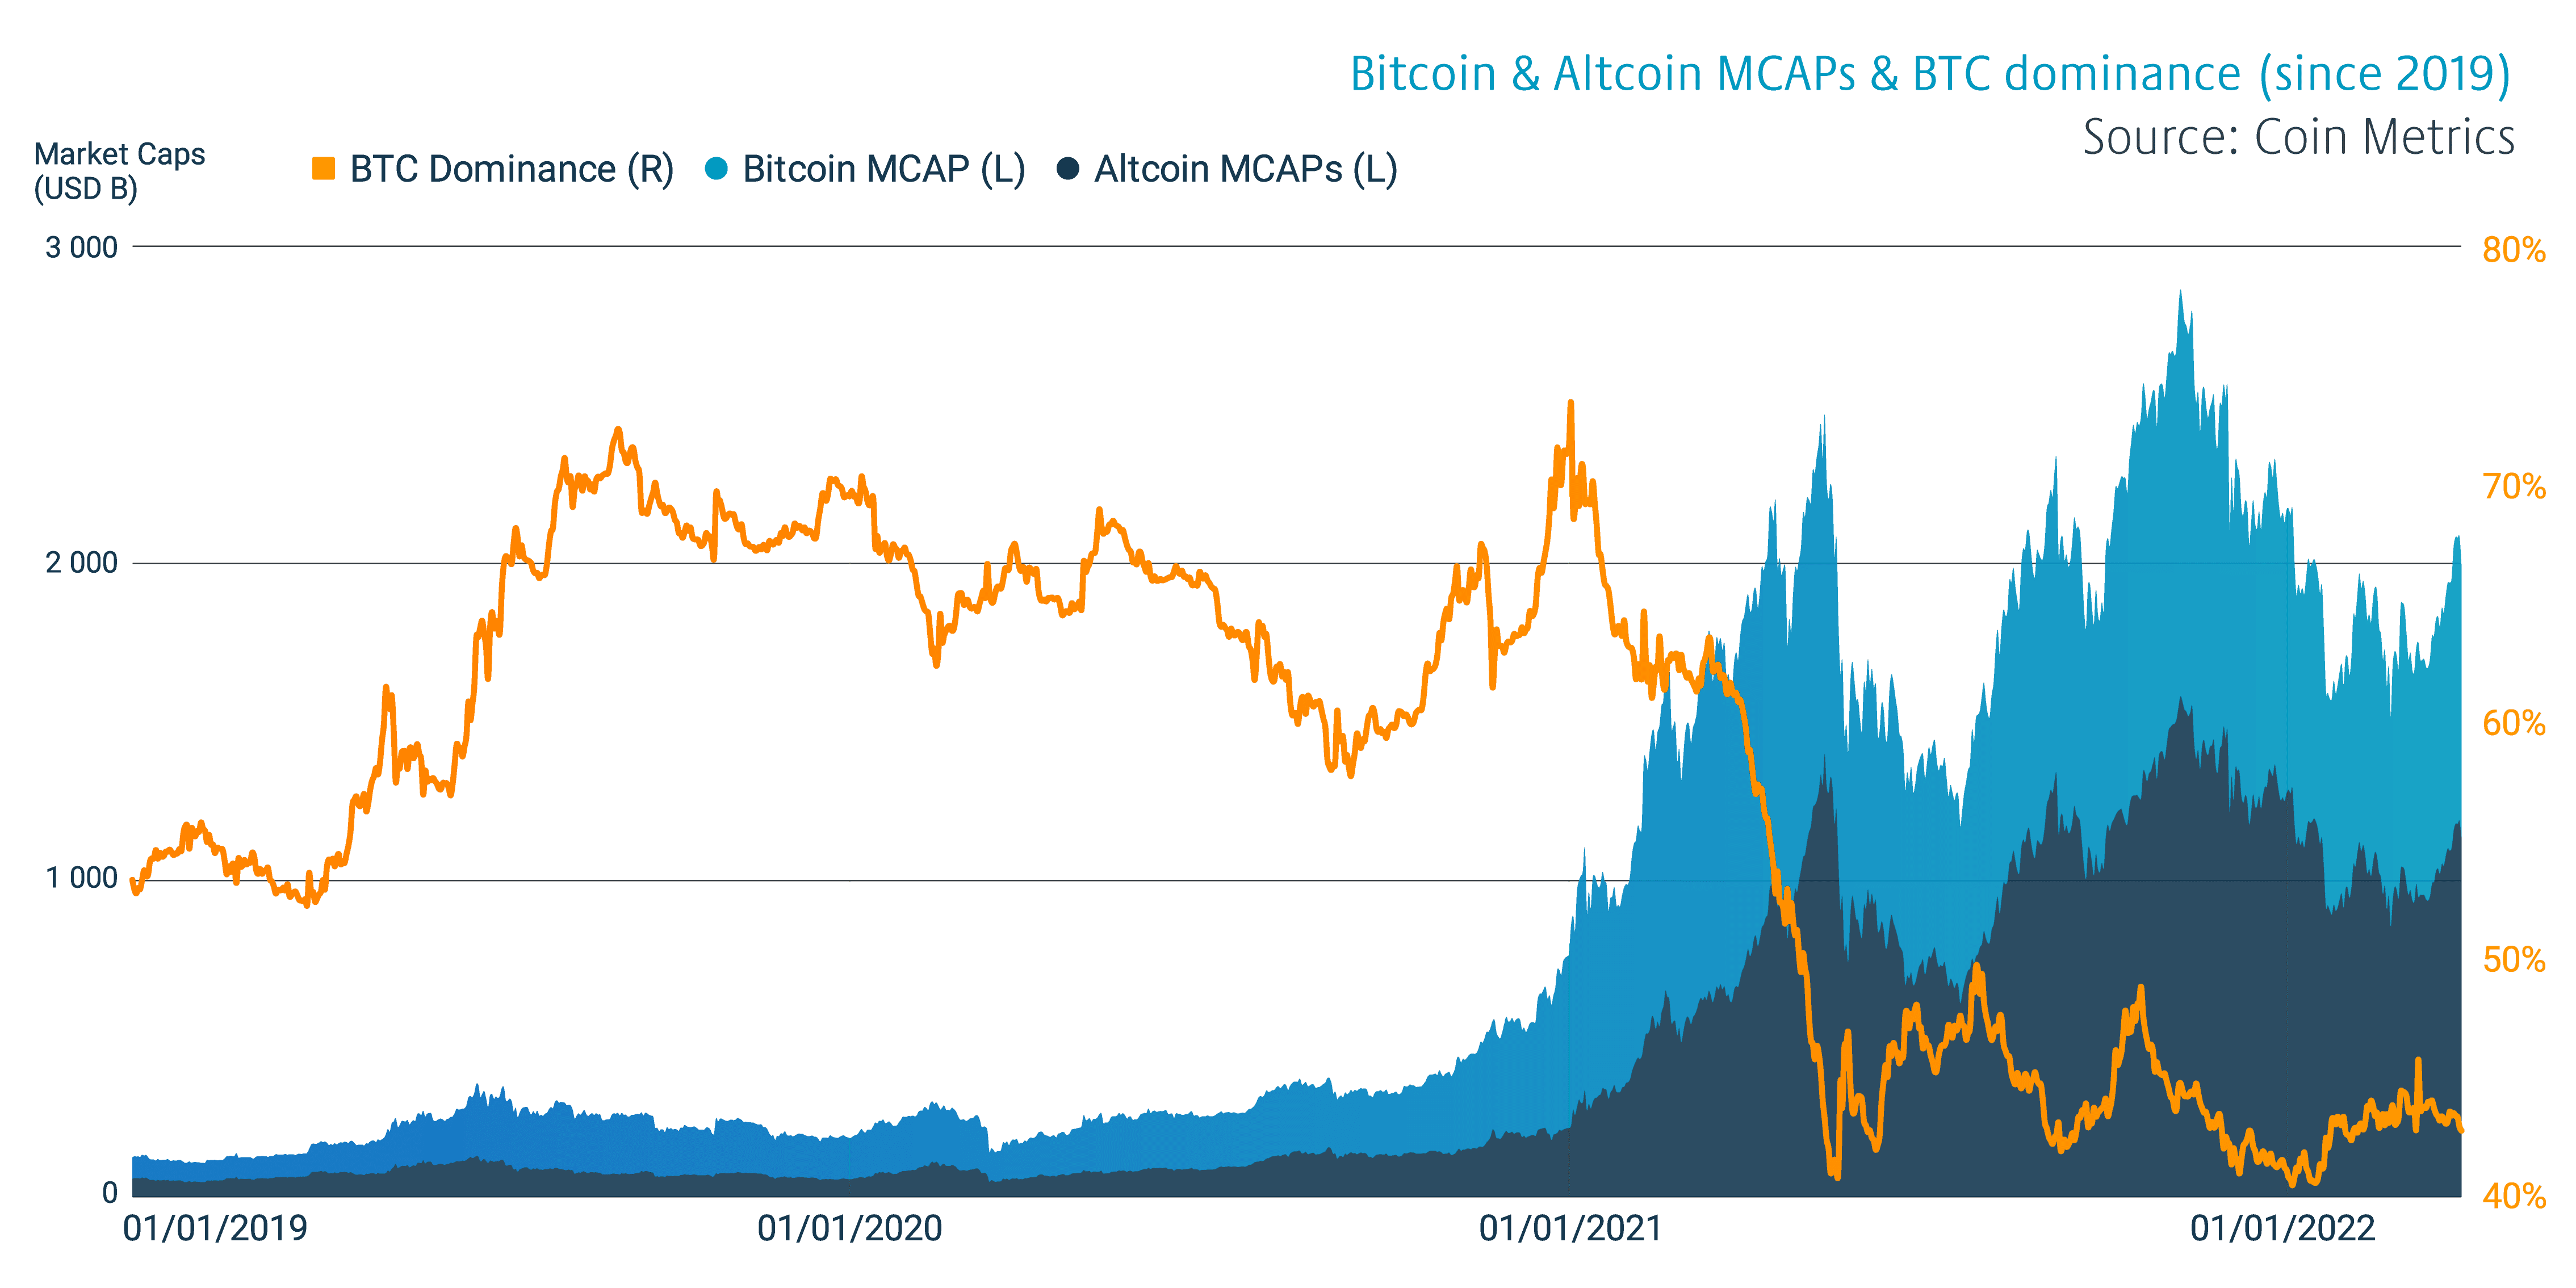
As Bitcoin’s dominance seems to have entered a secular downtrend, what are the factors behind this paradigm shift? While Bitcoin remains as the de facto leading cryptocurrency, other digital assets are outpacing Bitcoin in growth and quantity. Additionally new sectors like decentralised finance (DeFi) and non-fungible tokens (NFTs) are gearing up and gaining market share. However the new cryptoassets are not directly competing with Bitcoin, so it’s hard to see them as an existential threat to Bitcoin itself.
“I could potentially see Bitcoin to become the 21st century gold”
– Marion Laboure, Deutsche Bank Research
CORRELATIONS: MACRO
As may investors have noticed, Bitcoin has been highly correlated with the stock market during the first half of 2022. Bitcoin has been particularly correlated with technology-related stocks and indices like Nasdaq Composite. Bitcoin’s correlation with the leading stock market index S&P 500 has been escalating, reaching 0,6 in late quarter one.
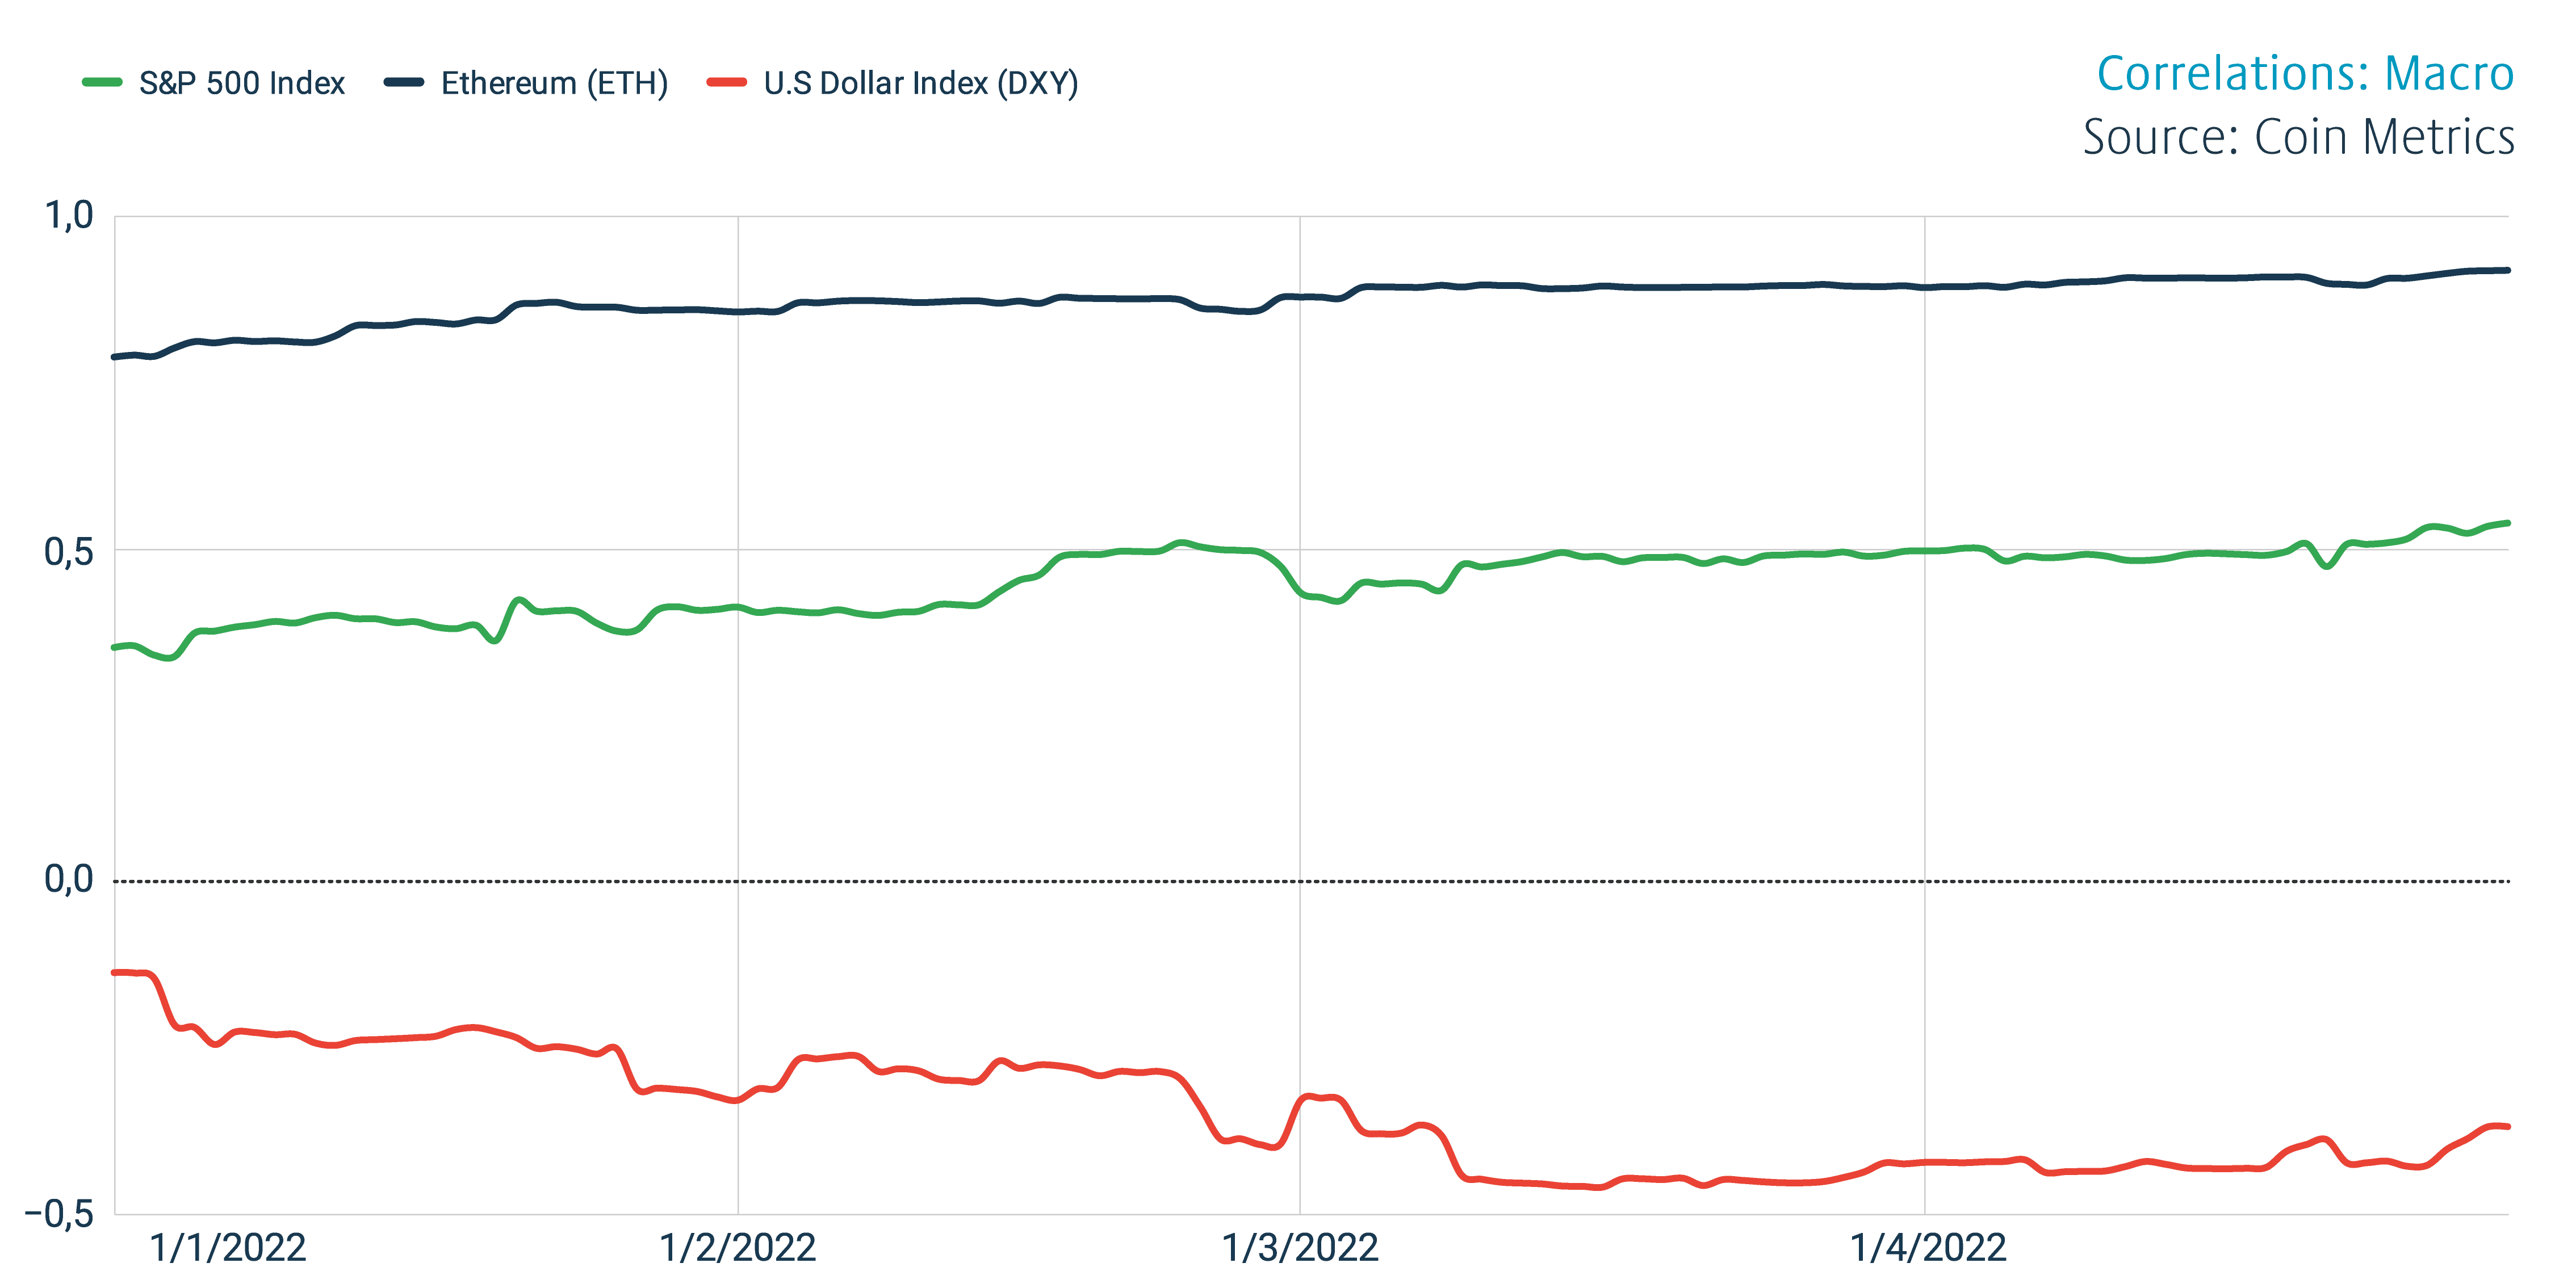
The Bitcoin narratives have changed over the years and it’s often described as an “uncorrelated asset class”. Well is Bitcoin really uncorrelated? The thesis might be true and untrue at the same time.
The U.S. Dollar Index (DXY) has been inversely correlated with Bitcoin, reaching a negative relationships up to -0,5. In historical context Bitcoin has been flourishing during the times of weak DXY and strong DXY has been bearish for Bitcoin, vice versa. The DXY seems to have peaked in the spring of 2022, which is good news for Bitcoin.
CORRELATIONS: CRYPTO
The cryptoassets have continued their mutual correlation as 30-day correlation data shows values ranging from 0,73 to 0,93. The correlation with Bitcoin and Ethereum is particularly strong at 0,93, mirroring almost 1:1 relationship. Decentralized Finance (DeFi) tokens are less correlated with Bitcoin, as they are higher beta assets. XRP is the least correlated asset with Bitcoin in this reference group.
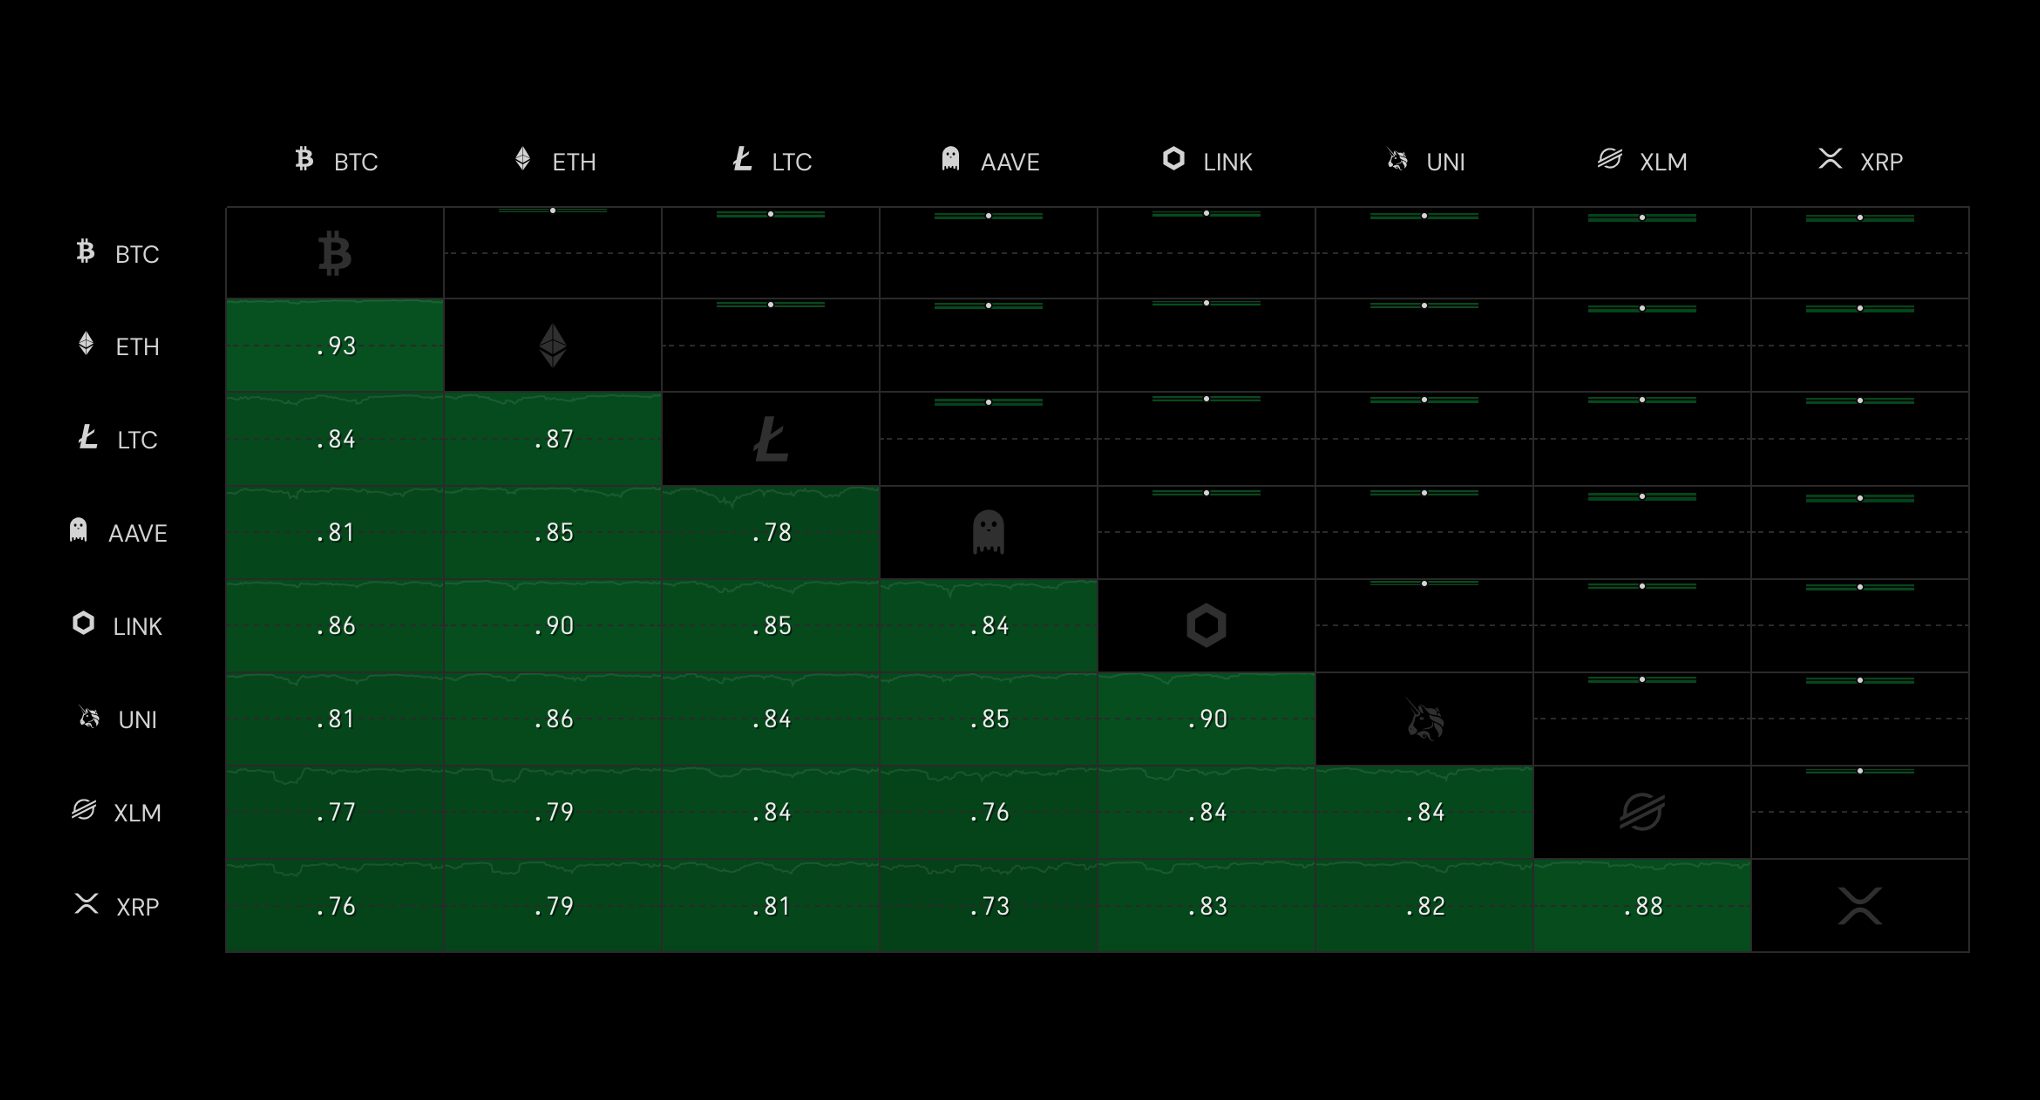
All asset classes, either in macro or crypto field, have a tendency to go towards one (1) during corrections. Bitcoin is a reflexive asset and particularly the retail sector makes emotional investment decisions.
ETHEREUM
Ethereum is one of the assets in Coinmotion’s repertoire that has been able to withstand the current selling pressure. That raises a question why Ethereum seems to be diverging from other digital assets? One fundamental factor would be the upcoming merge, which is a protocol-level shift from Proof of Work (PoW) to Proof of Stake (PoS). The shift to PoS is tightly followed by market participants and it attracts retail & institutional money.
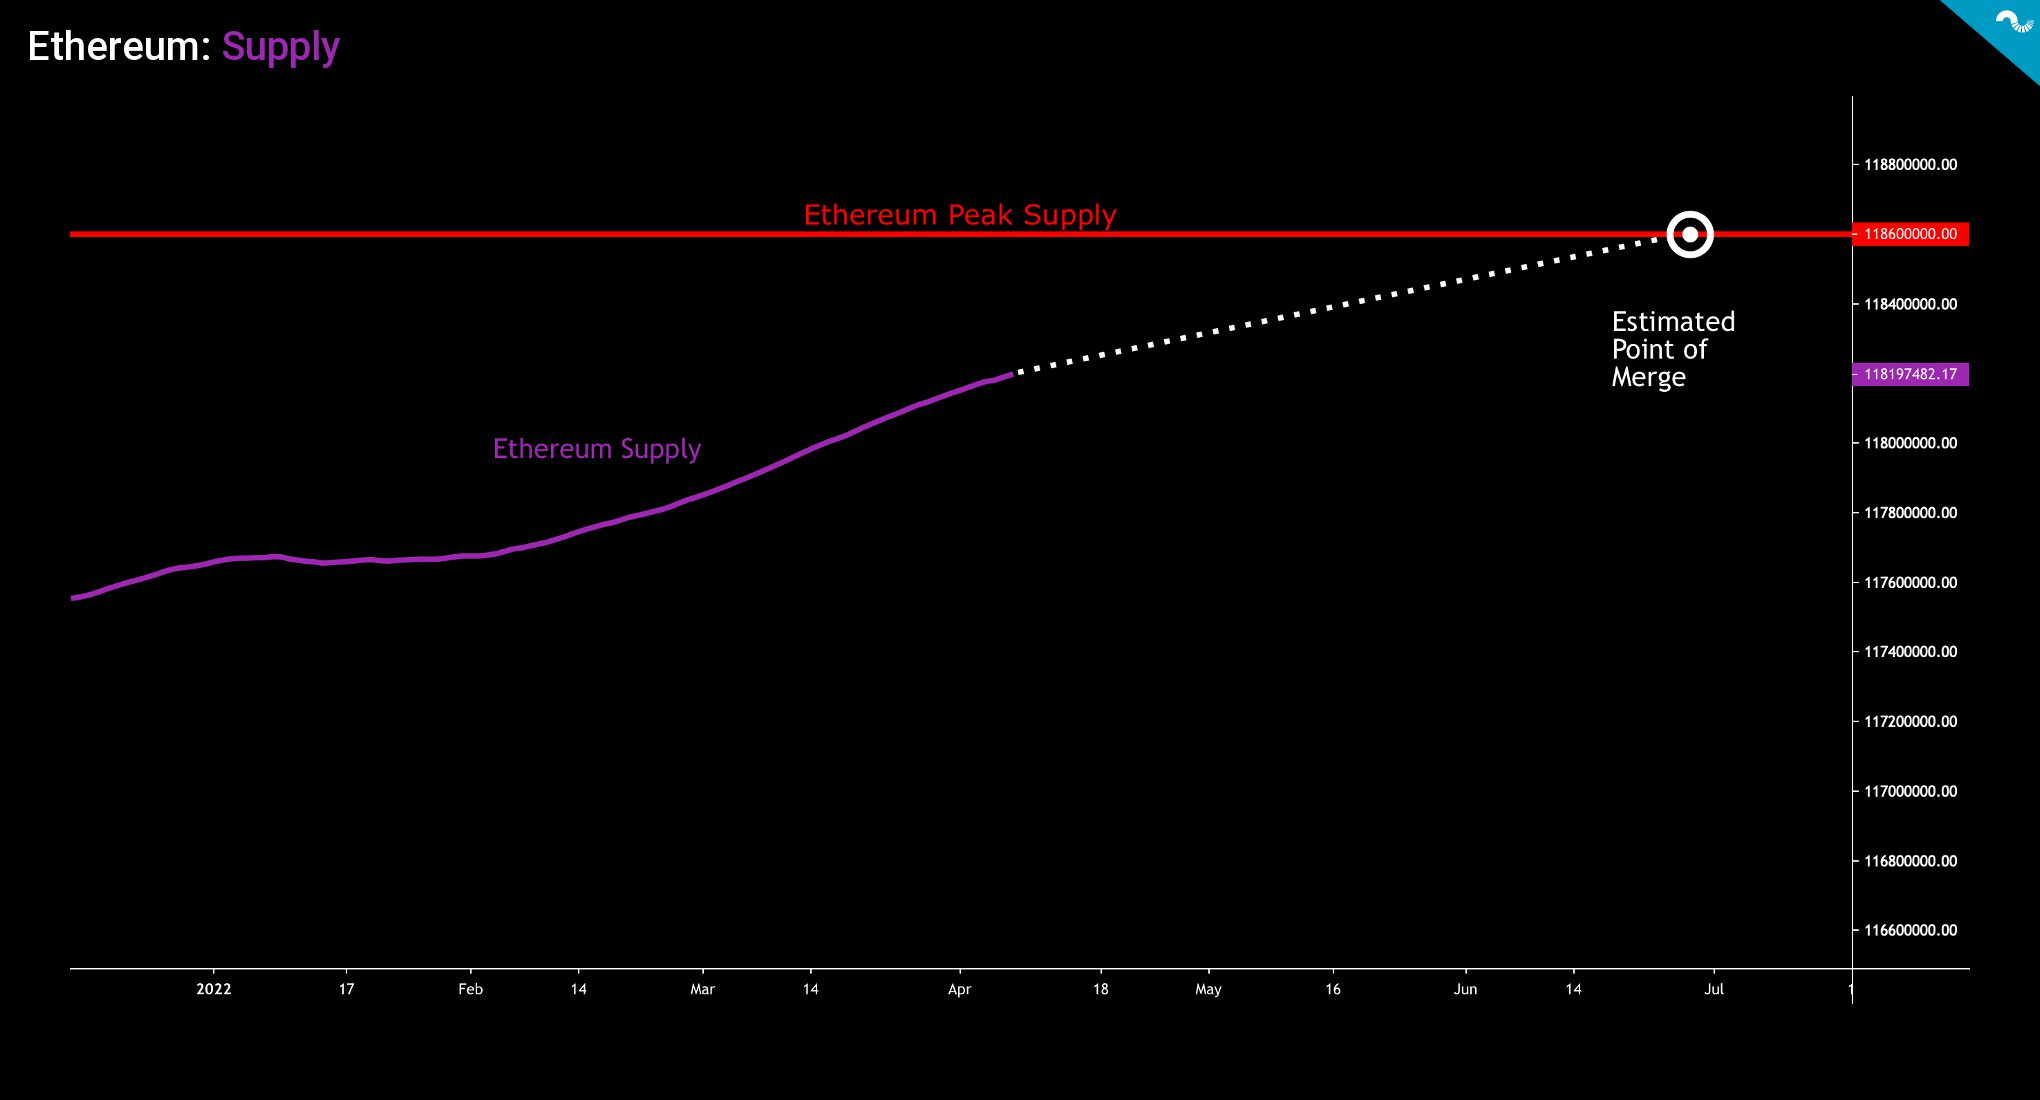
In addition to the protocol shift, Ethereum is about to reach its peak supply in June-July by current estimates. The EIP-1559 started to render Ethereum more scarce by burning transactional fees. The diminishing supply will make Ethereum more desirable, as everyone wants a piece of increasingly scarce asset. As Michael Saylor said: ”The rational strategy in the face of escalating inflation & taxation risk is to construct a portfolio of scarce, desirable, and portable assets that you can hold forever.”
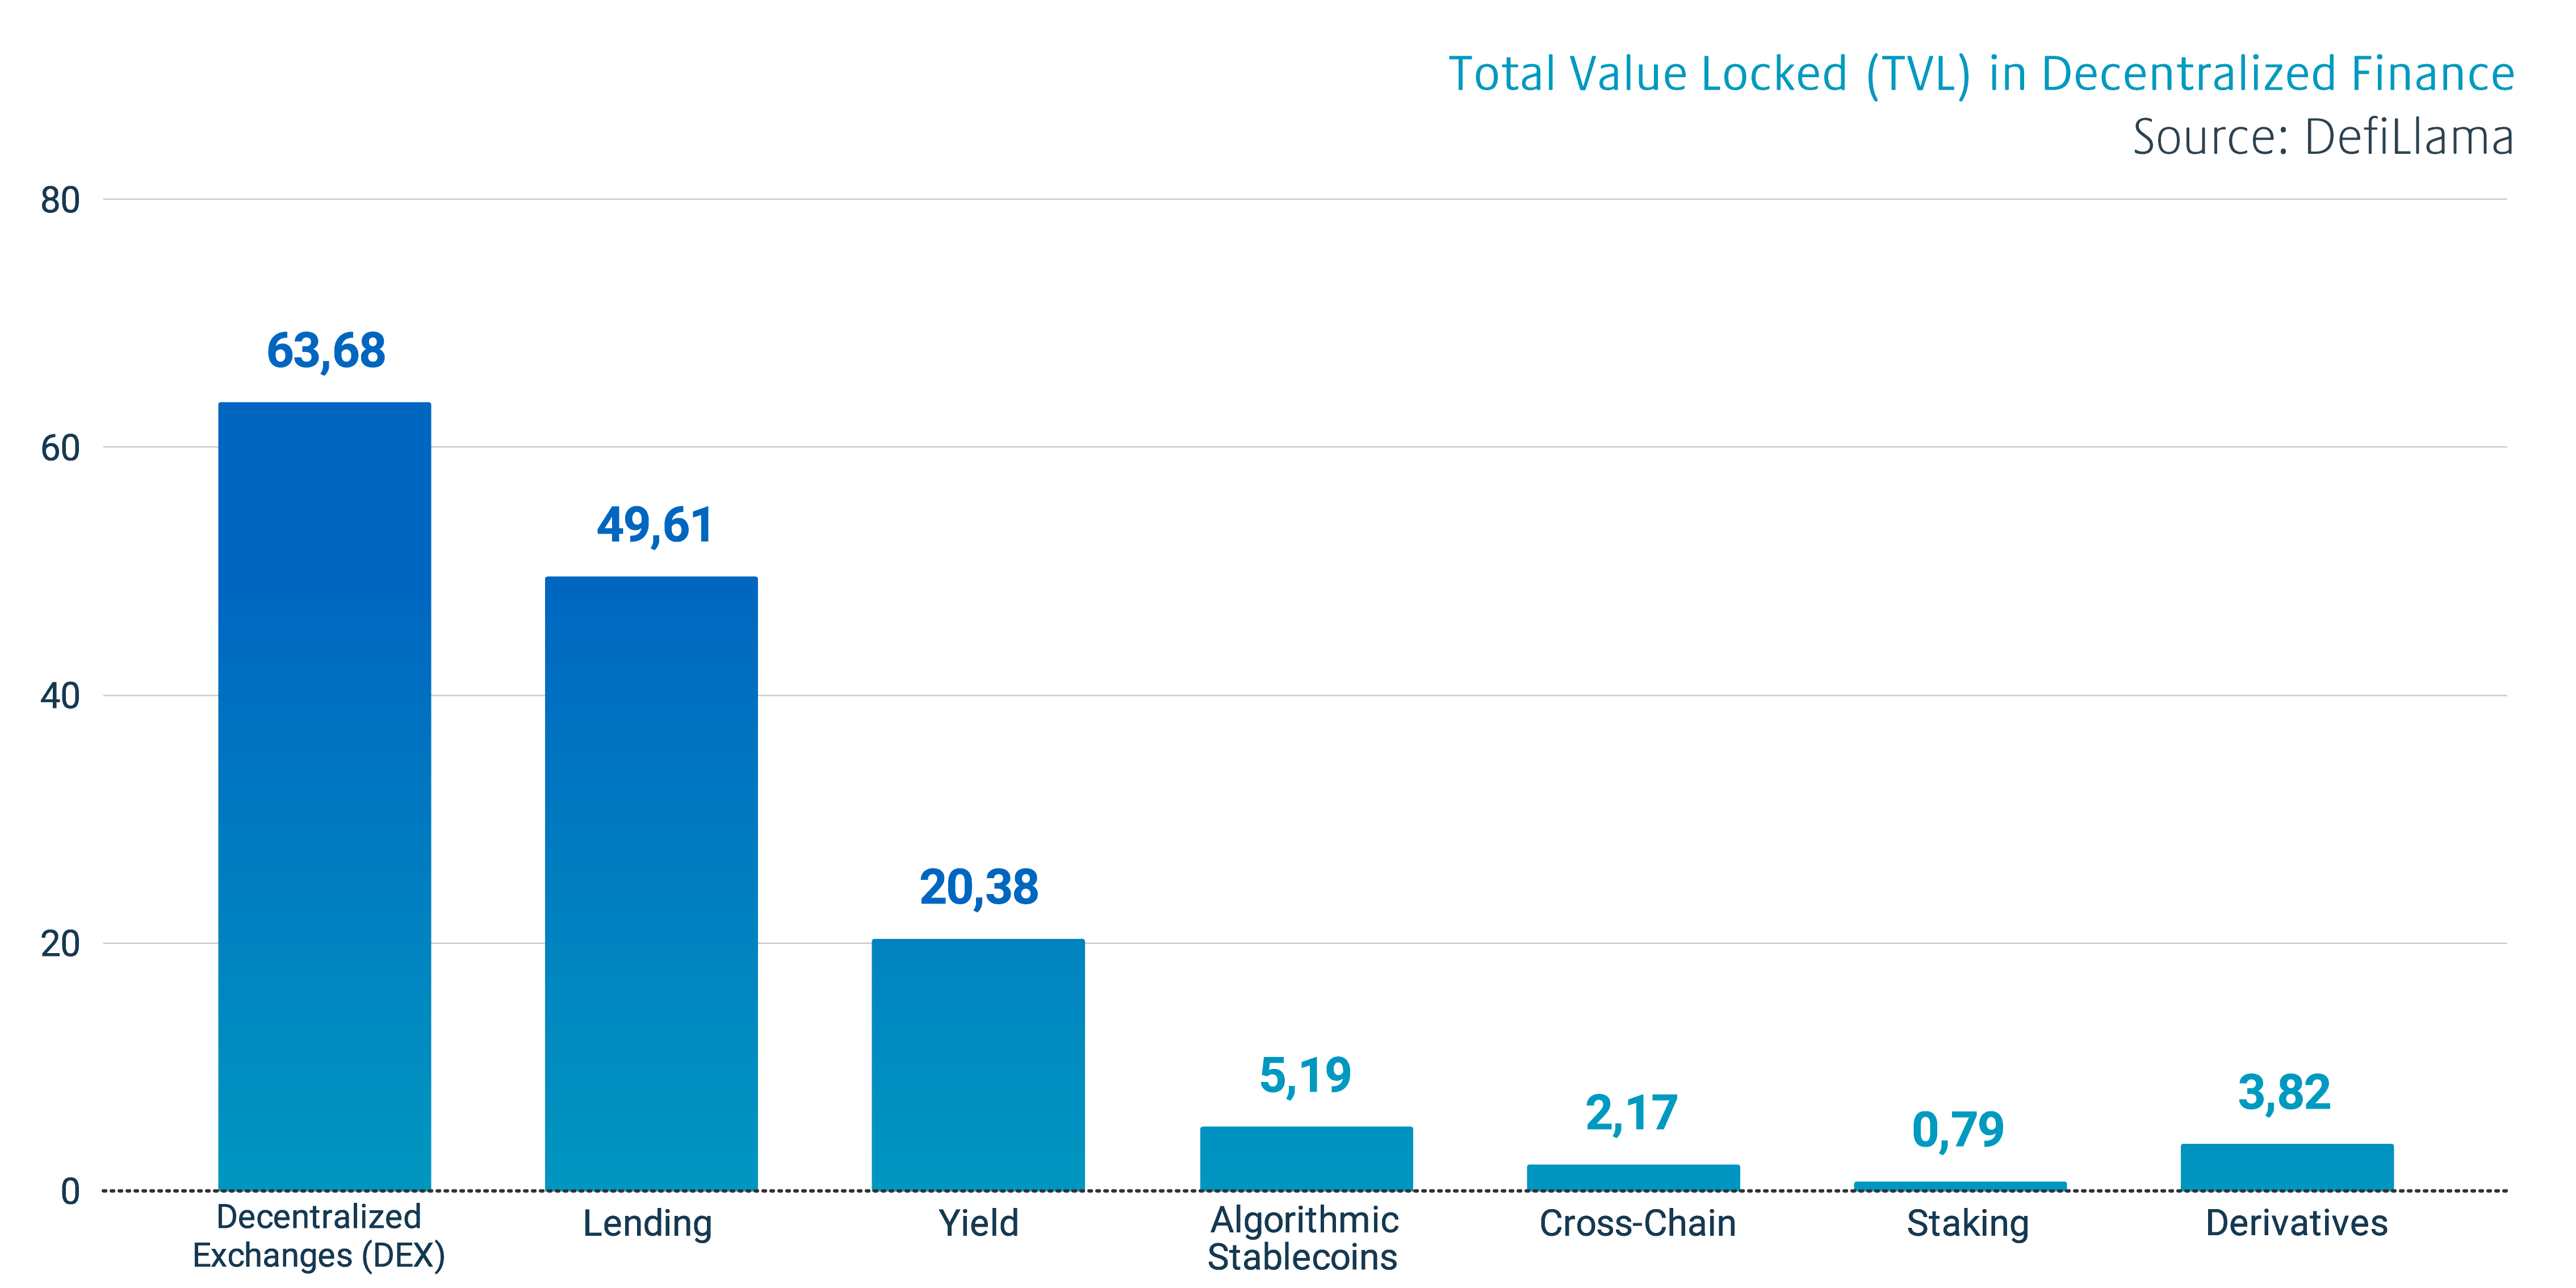
DECENTRALIZED FINANCE (DEFI)
Decentralized Finance (DeFi) has evolved into the main driver of growth in the blockchain industry during recent years. Decentralized finance can be described as a cluster of decentralized applications (dapp), that are built on blockchain technology.
Compared with traditional centralized financial services, the value proposition of decentralized finance is to solve the inherent challenges within the legacy financial field. The biggest challenges within traditional finance are considered to be single points of failure, abuse of control, monopoly of power, and bureacracy.
The decentralization is achieved by using smart contracts, where the rules of the contract are embedded into code and implemented automatically. All transactional data is saved into a distributed ledger. The process makes sure that no single party has unilateral control over transactions, which would potentially allow censorship and disruption.
The growth momentum of cryptocurrencies and blockchain applications has been massive and the market capitalization of Bitcoin alone has climbed from 2016’s couple of billion US dollars into current > 800 billion. The rising transaction amount moves the focus into network scalability and effective supply to growing user base.
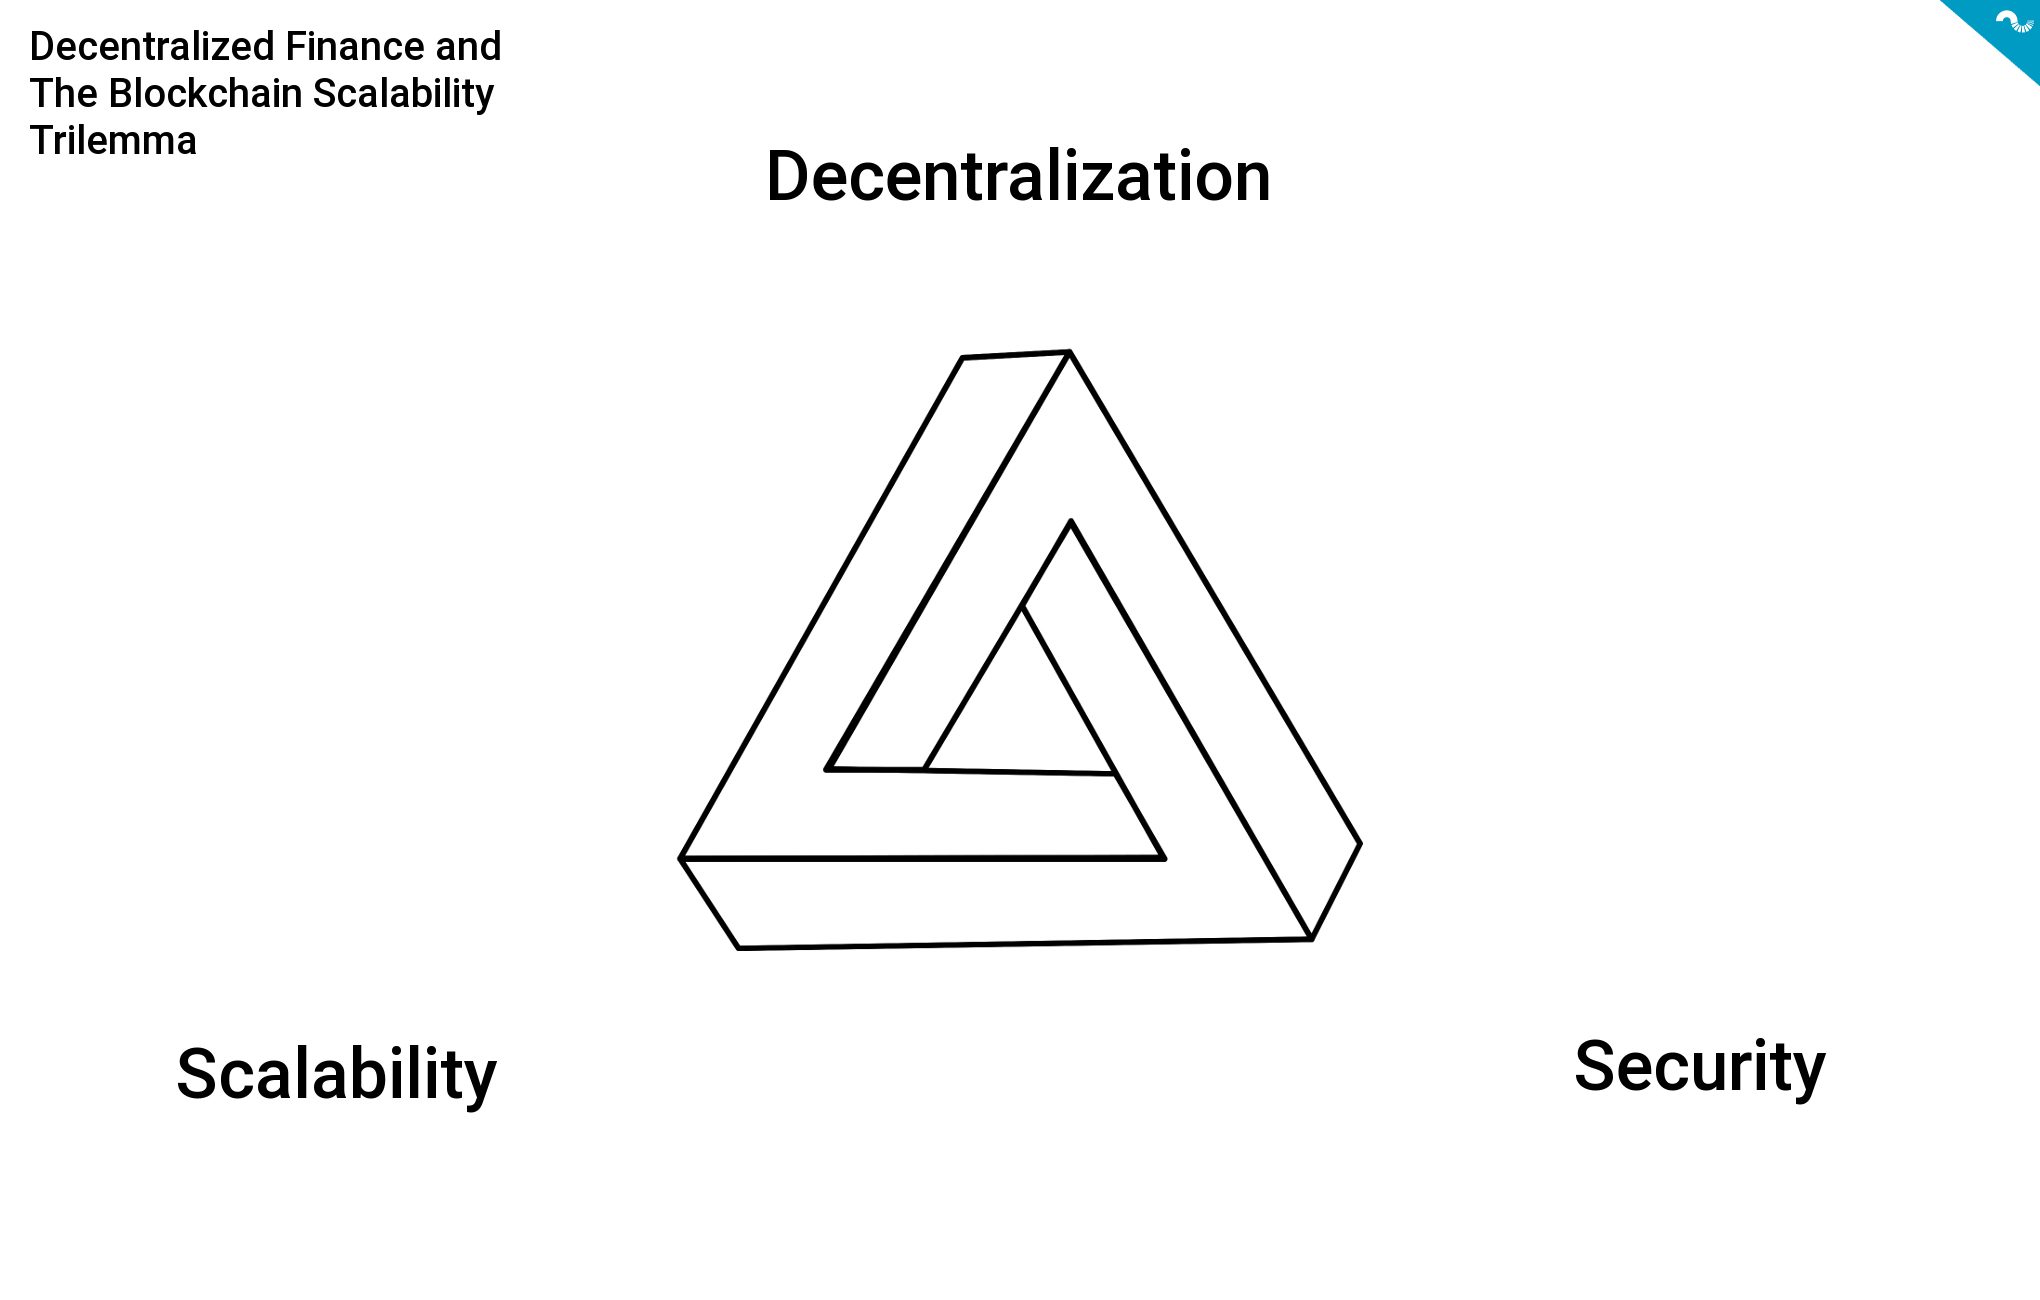
The scaling of decentralized finance seems to have a tendency to collide into inherent scalability trilemma, which includes decentralization, scalability, and safety. According to the scalability trilemma the blockchain platform can only focus on two of these three features and consequently the final implementation is always a compromise. As a reference the Bitcoin network is highly secure, however Bitcoin’s Layer-1 is challenging to scale. Developers are trying to solve the scalability trilemma with different Layer-1 and Layer-2 protocols.
GEOPOLITICAL BITCOIN
The markets have faced a tidal wave of macro and geopolitical risk recently by the escalating conflict in Ukraine. Thursday 24th of February represented a rude awakening for many as Ukraine was suddenly striked by a powerful invader. Now after three days of heavy fighting the attacker hasn’t reached many of its objectives and Ukraine seems to have a lot of mental power to resist. However the situation remains uncertain and could tip to any direction in future.
In the middle of the conflict Ukraine requested and received international help, despite some countries staying passive due to complex political backgrounds. Ukraine also built websites for IBAN donation, which allowed normal people and institutions to donate for associated causes. Then suddenly cryptocurrency donation addresses started to appear, one of the first initiatives belonging to George Kikvadze of Bitfury. George’s donation campaign has been hugely successful and has currently amassed 170,46 bitcoin units, equal to 6,57 million USD. His donation wallet has a total of 4017 transactions of various size.
BITCOIN EXCHANGE RESERVES
Bitcoin’s exchange reserves have continued their secular downtrend, forming a descending pattern dating back to early 2020. The decrease is likely driven by the relocation of bitcoin units into long-term cold storage.
The decisive downtrend of exchange reserves briefly pivoted upwards during recent spot price correction, however this seemed to be an anomaly and exchange reserves have yet again found their downward trajectory.
↑ Increasing Exchange Reserves: Bearish, indicating bitcoin selling pressure
↓ Decreasing Exchange Reserves: Bullish, indicating accumulation to cold storage
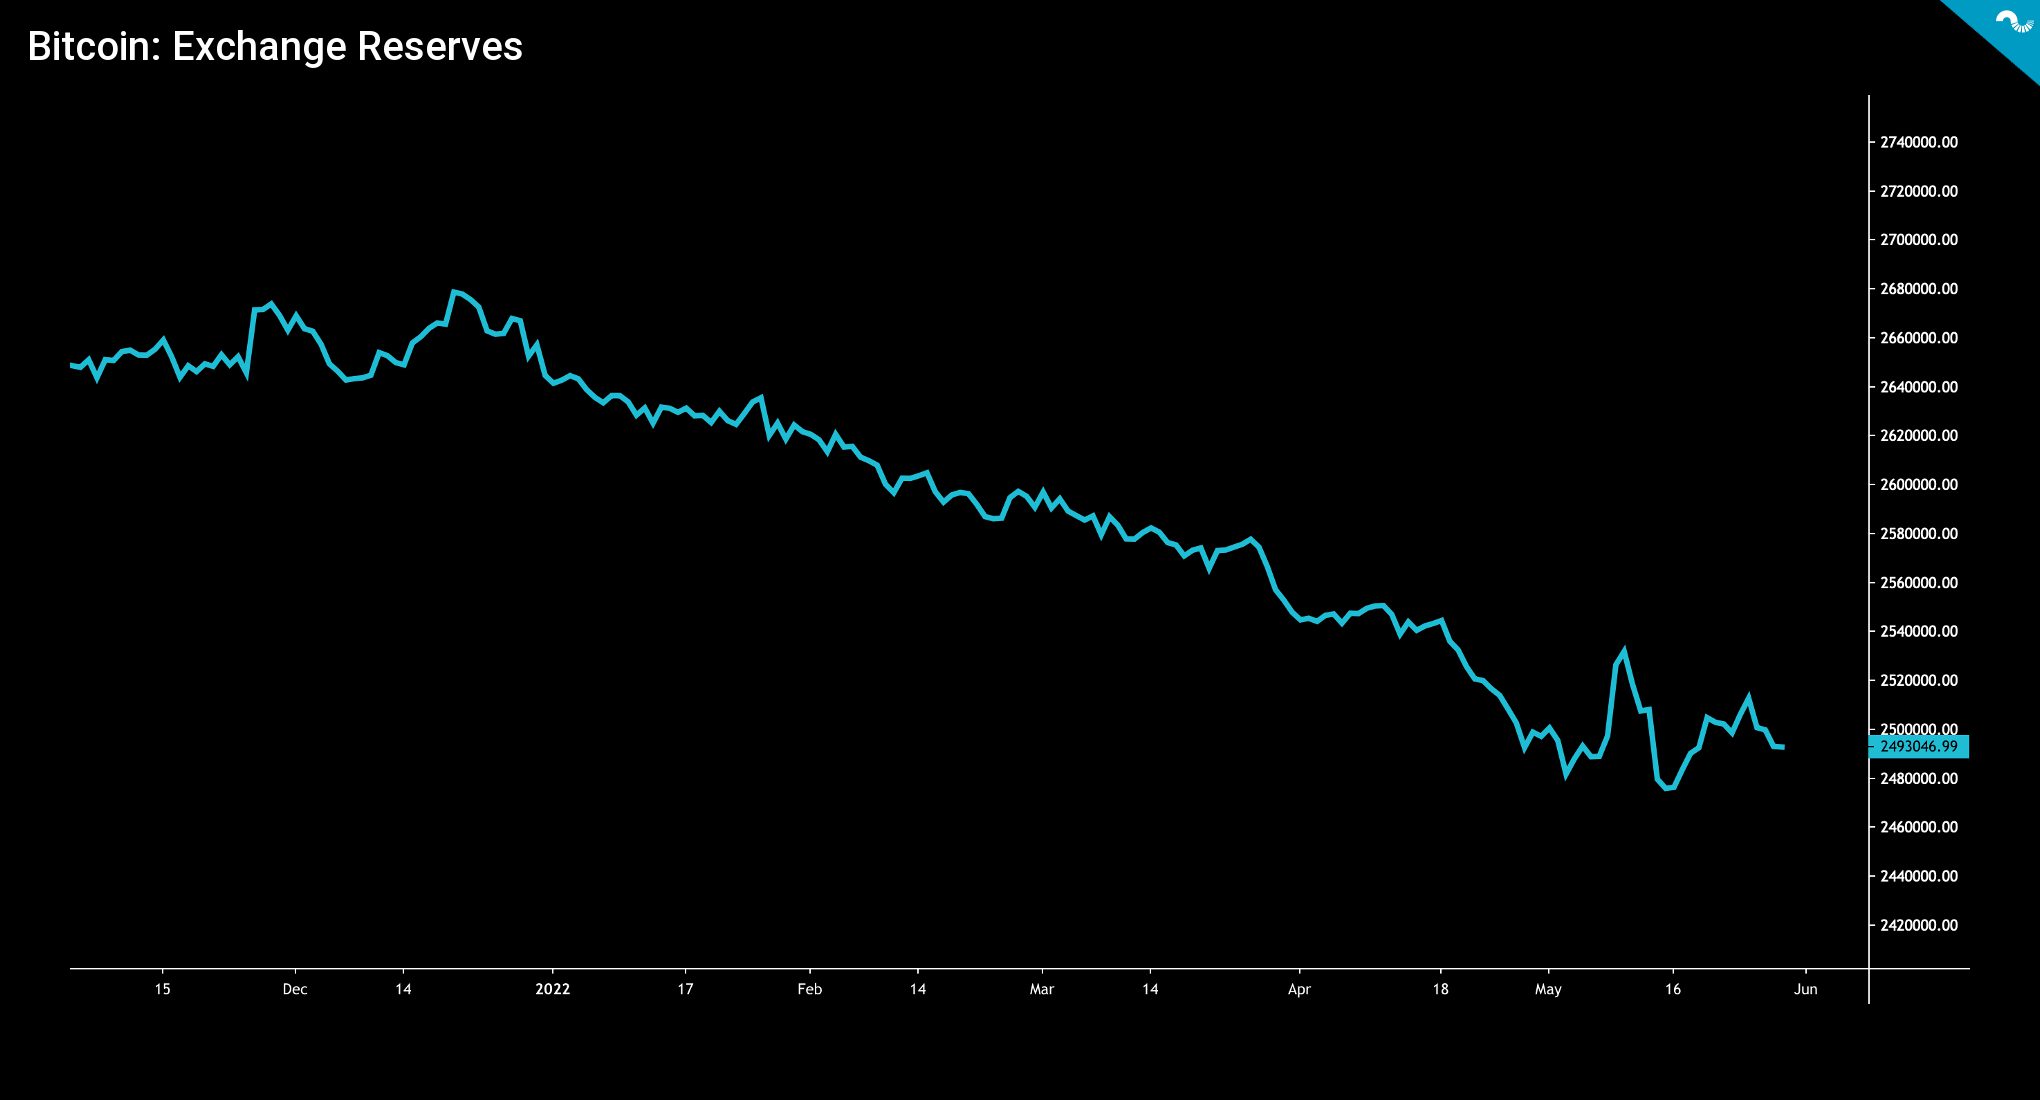
Recent analysis shows how only 22 percent of the current supply of bitcoin is liquid, meaning that bitcoin’s illiquid supply has increased to 78%. This inherent illiquidity combined with growing OTC demand from institutions like Luna Foundation Guard and MicroStrategy will drive BTCUSD upwards.
BITCOIN AS PART OF TRADITIONAL PORTFOLIO
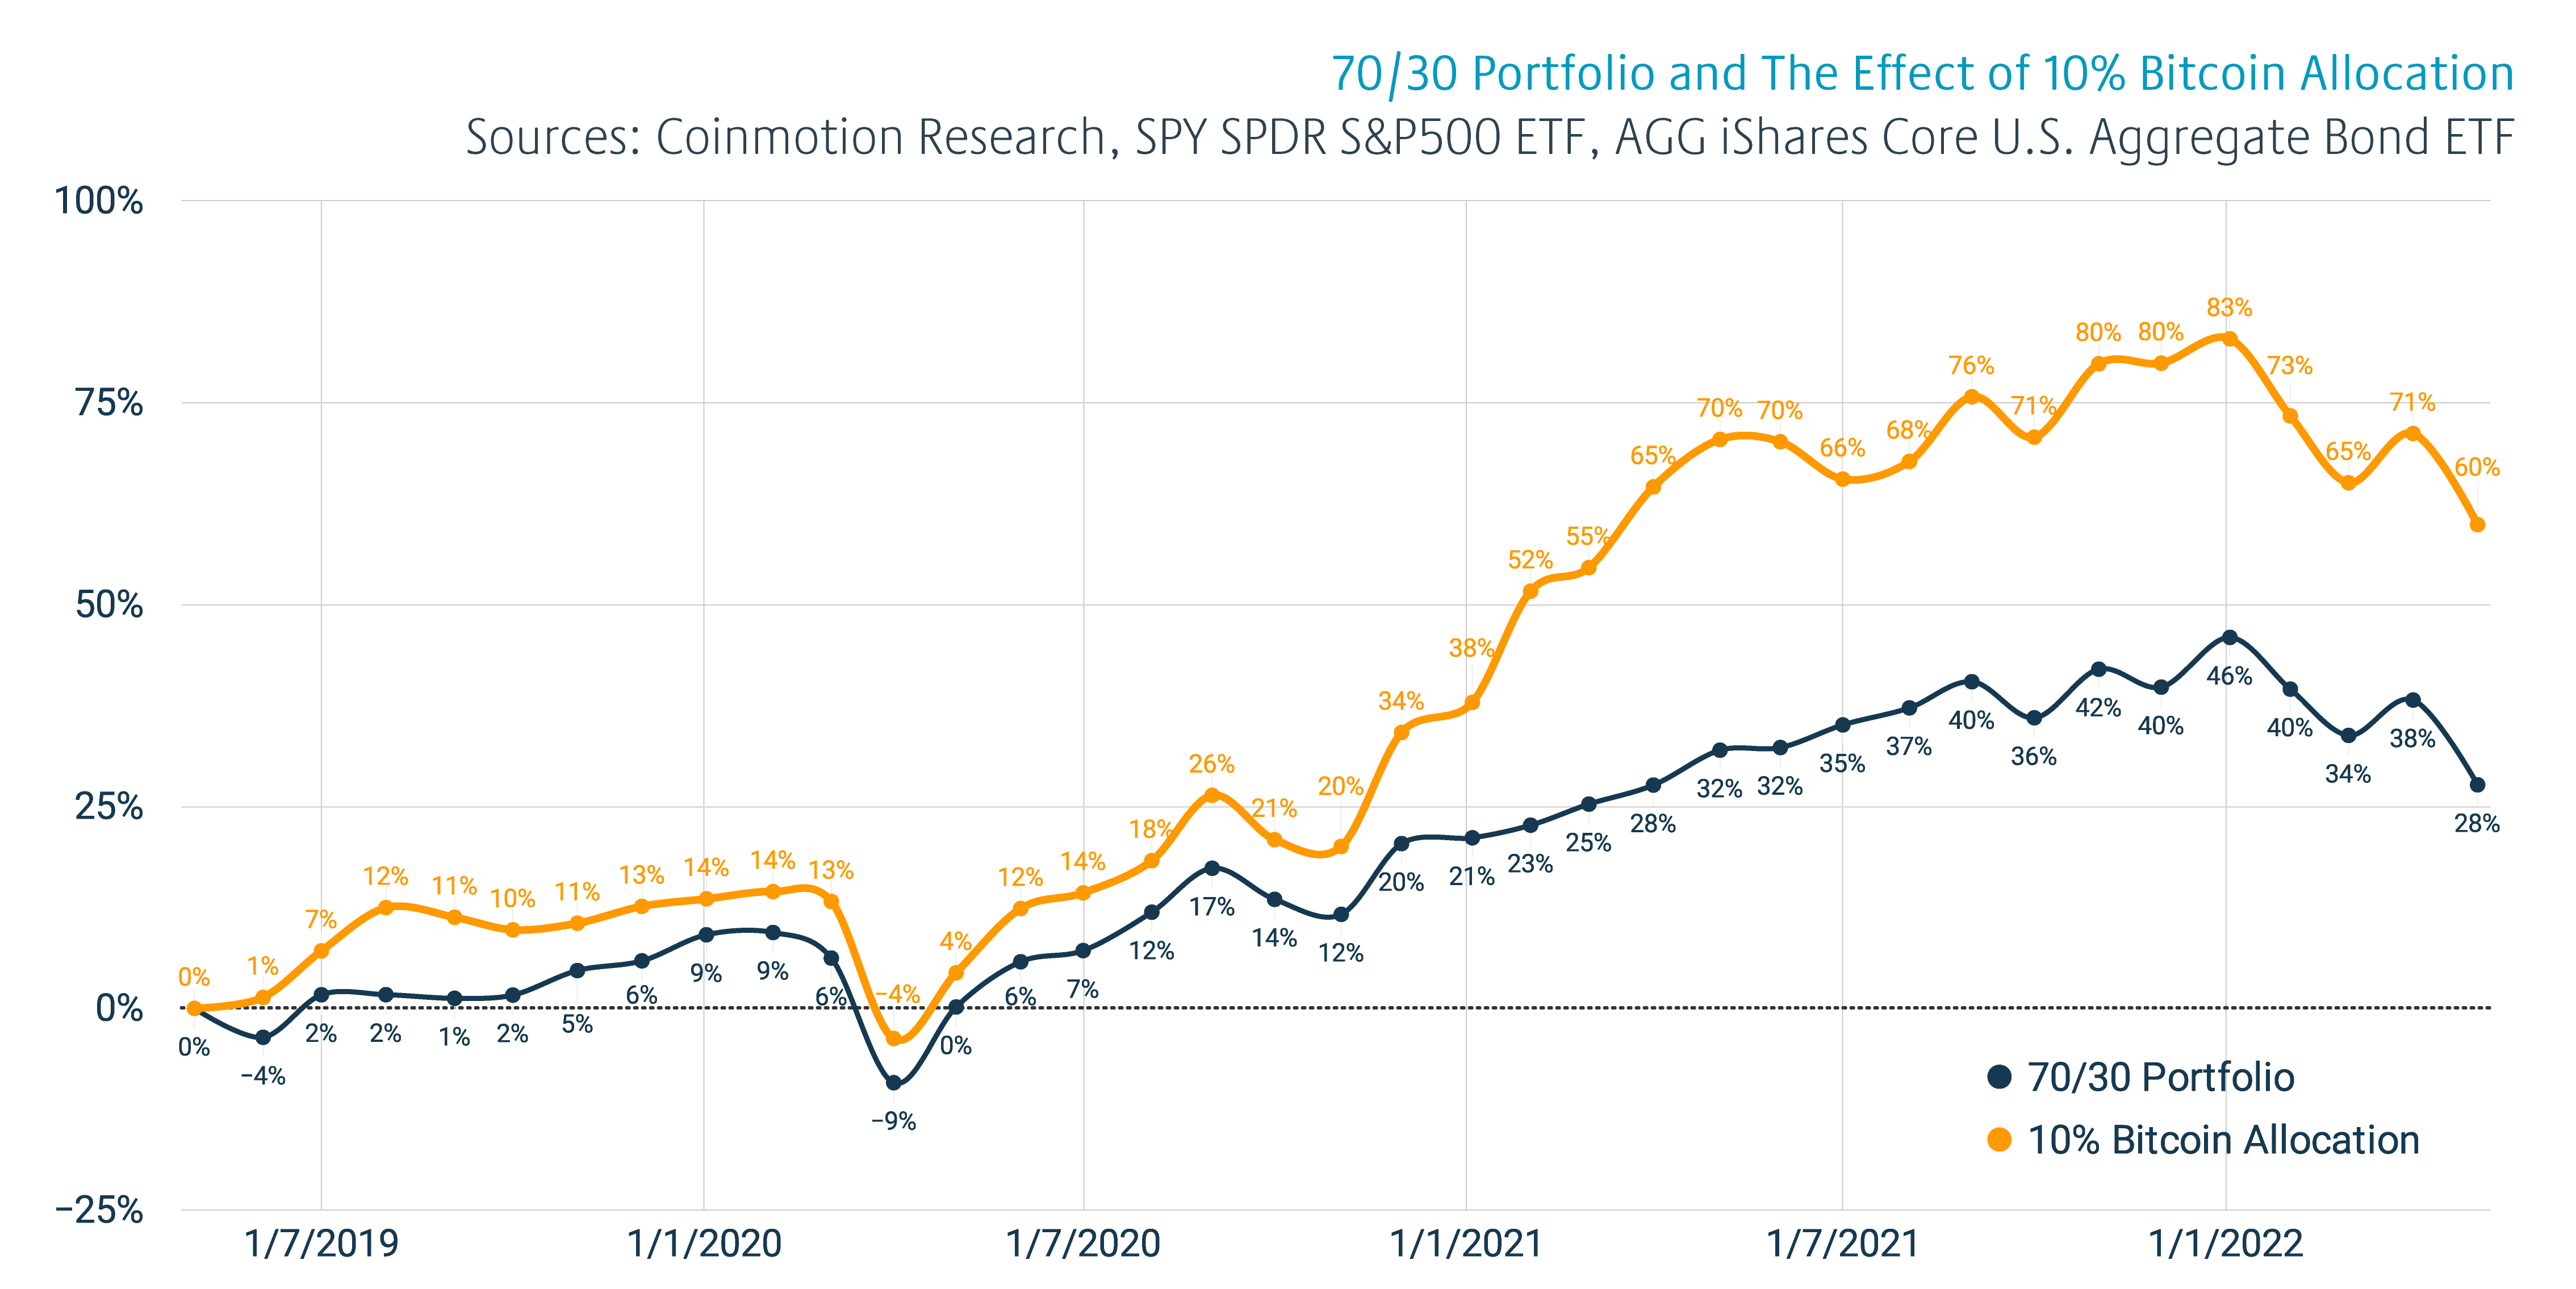
Coinmotion Research recently built a Bitcoin allocation model, which compares the performance of 70/30 portfolio to different Bitcoin allocations. In our model we took a 36 month perspective to a portfolio constructed of 70 percent of stocks and 30% of bonds.
Smart money is flowing into Bitcoin.
Join 160,000 investors on Coinmotion:
While the traditional portfolio grew 28% during past 36 months, a 5% bitcoin allocation uplifted the performance to 43%. A 10% bitcoin allocation boosted the portfolio performance even more, rising it to 60%. The risk/return metric Sharpe ratio was 0,438 to the traditional portfolio and a 5% bitcoin allocation increased it to 0,702.
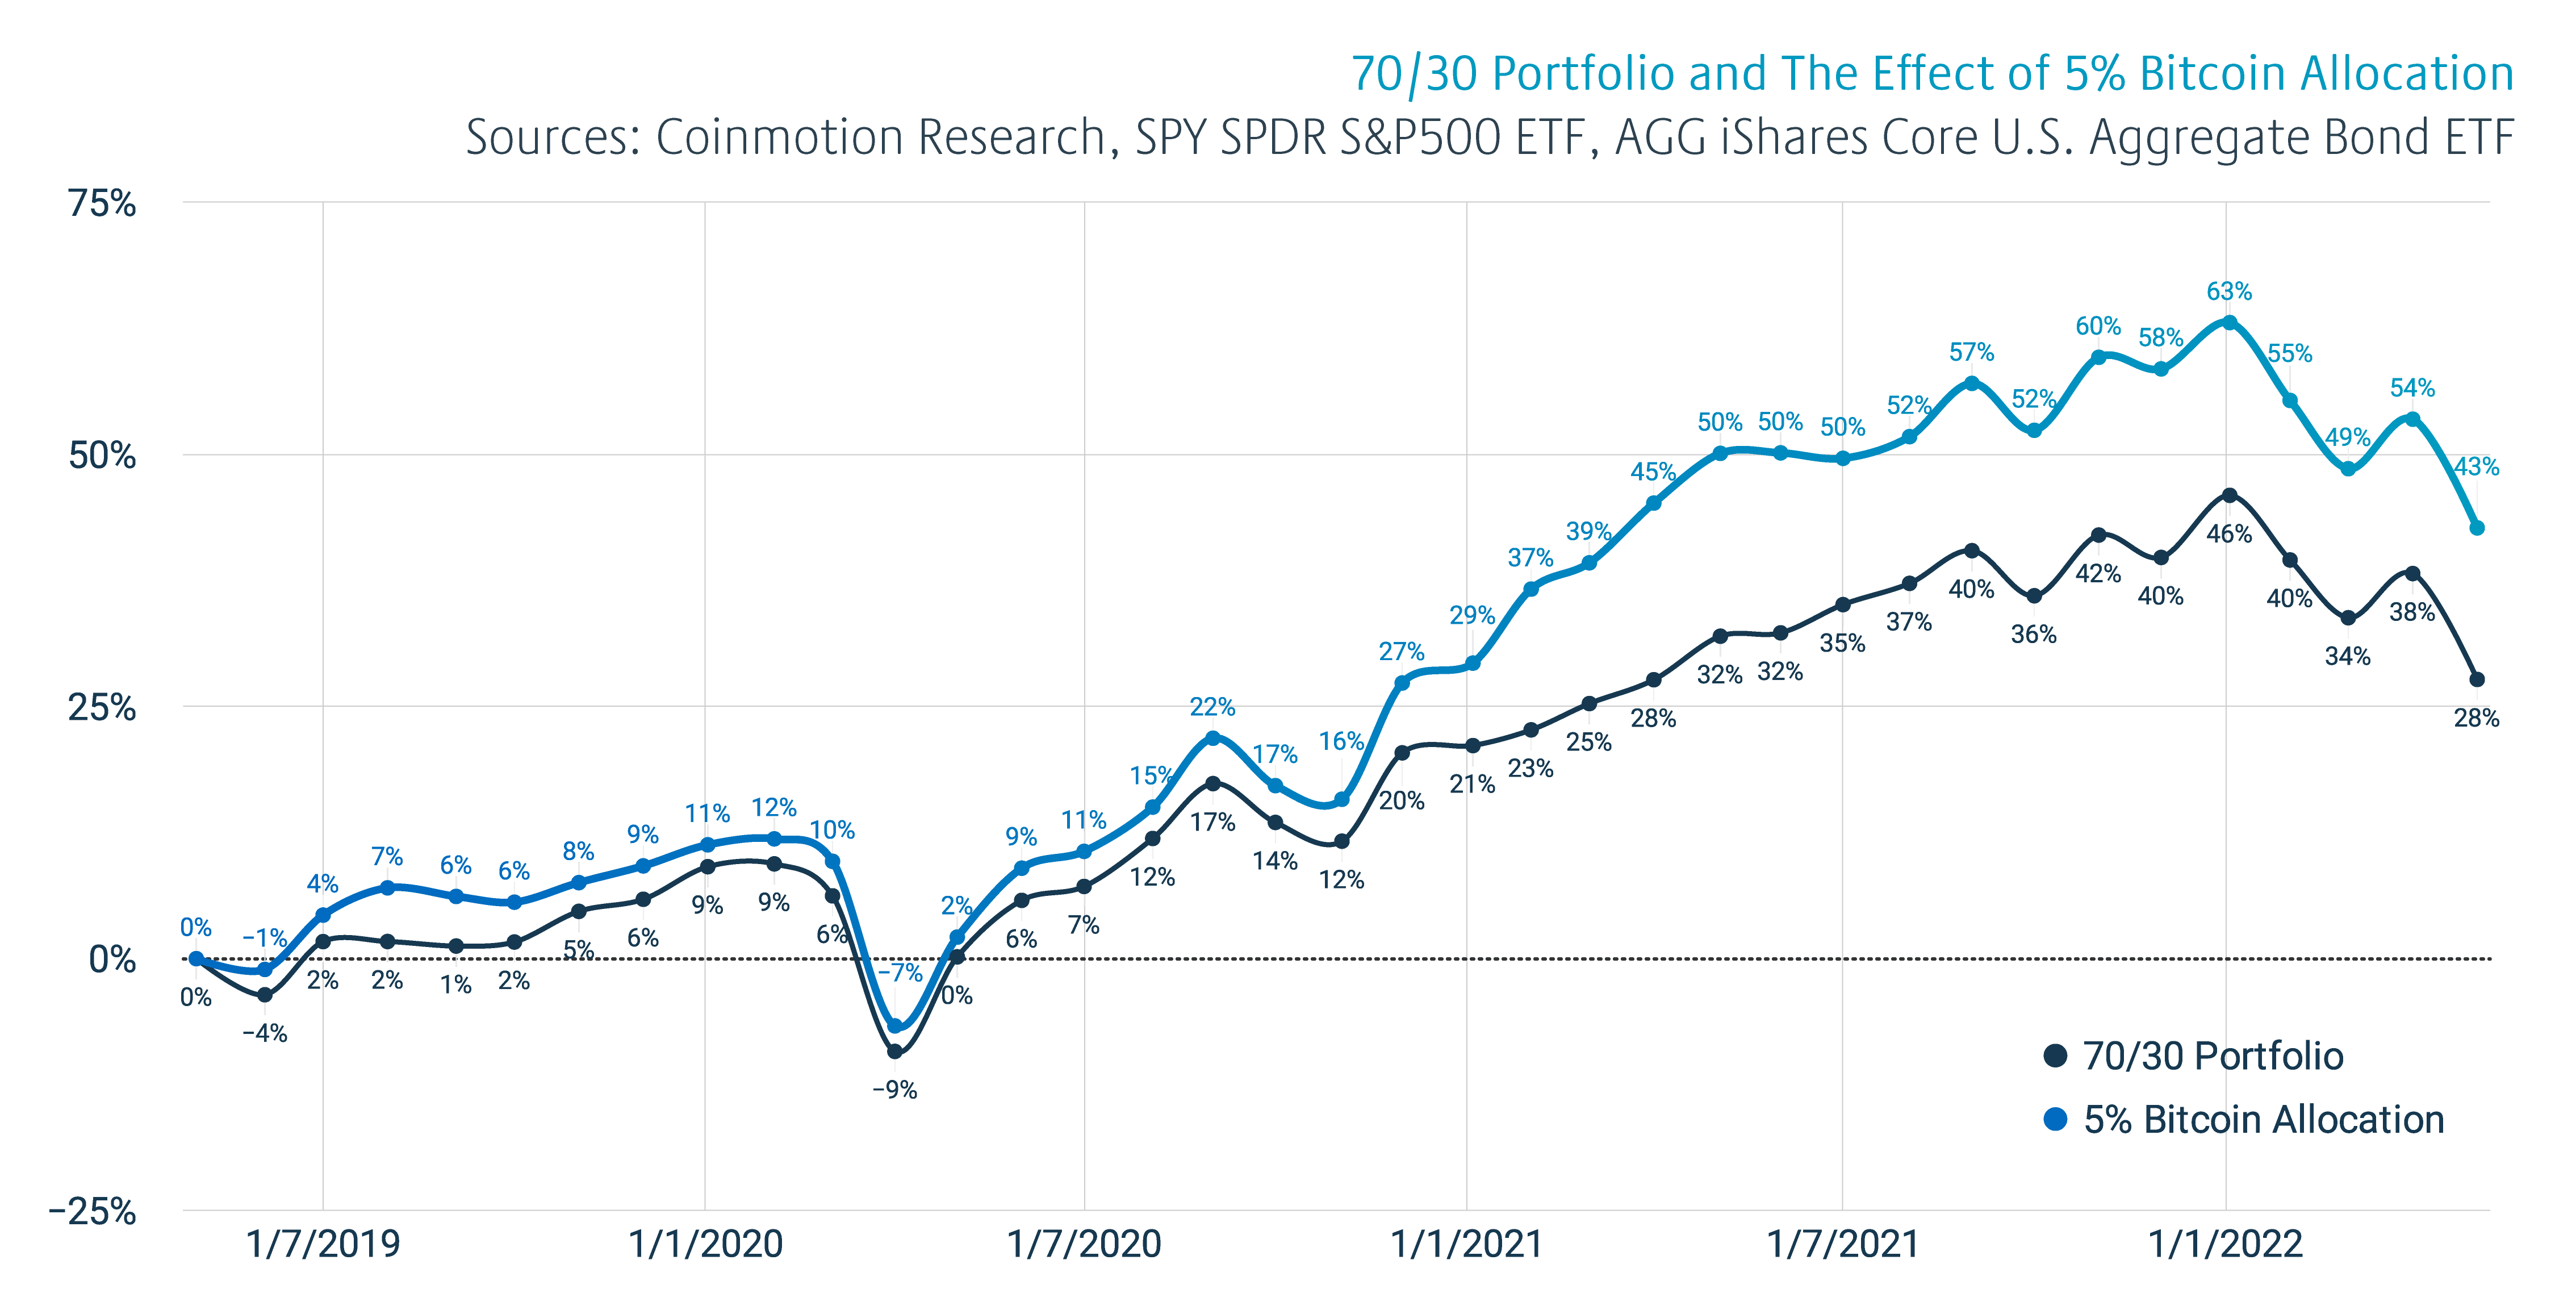
A 10% bitcoin allocation increased the Sharpe ratio further into 0,941. As summary even a relatively small bitcoin allocations have been greatly increasing the performance of traditional portfolio within the past three years.
“Bitcoin offers one service: securely time-stamped, scripted transactions. Everything else is built on the edge-devices as an application. Bitcoin allows any application to be developed independently, without permission, on the edge of the network.”
– Andreas Antonopoulos
VENTURE CAPITAL
The venture capital industry was massively propelled by the growth of digital assets in 2021. The whole blockchain and cryptocurrency scene saw 1349 funding rounds and $30,5 billion invested in 2021. Companies like Visa, Mastercard, Nike, and PayPal were involved in mergers and acquisitions.
65 percent of all individual VC deal activities comprised the top ten most active investors in 2021.The most active venture capital firm in 2021 was AU21 Capital, which settled over 140 deals, including Web3, NFT, infrastructure, decentralized finance (DeFi), and centralized finance (CeFi) fields.
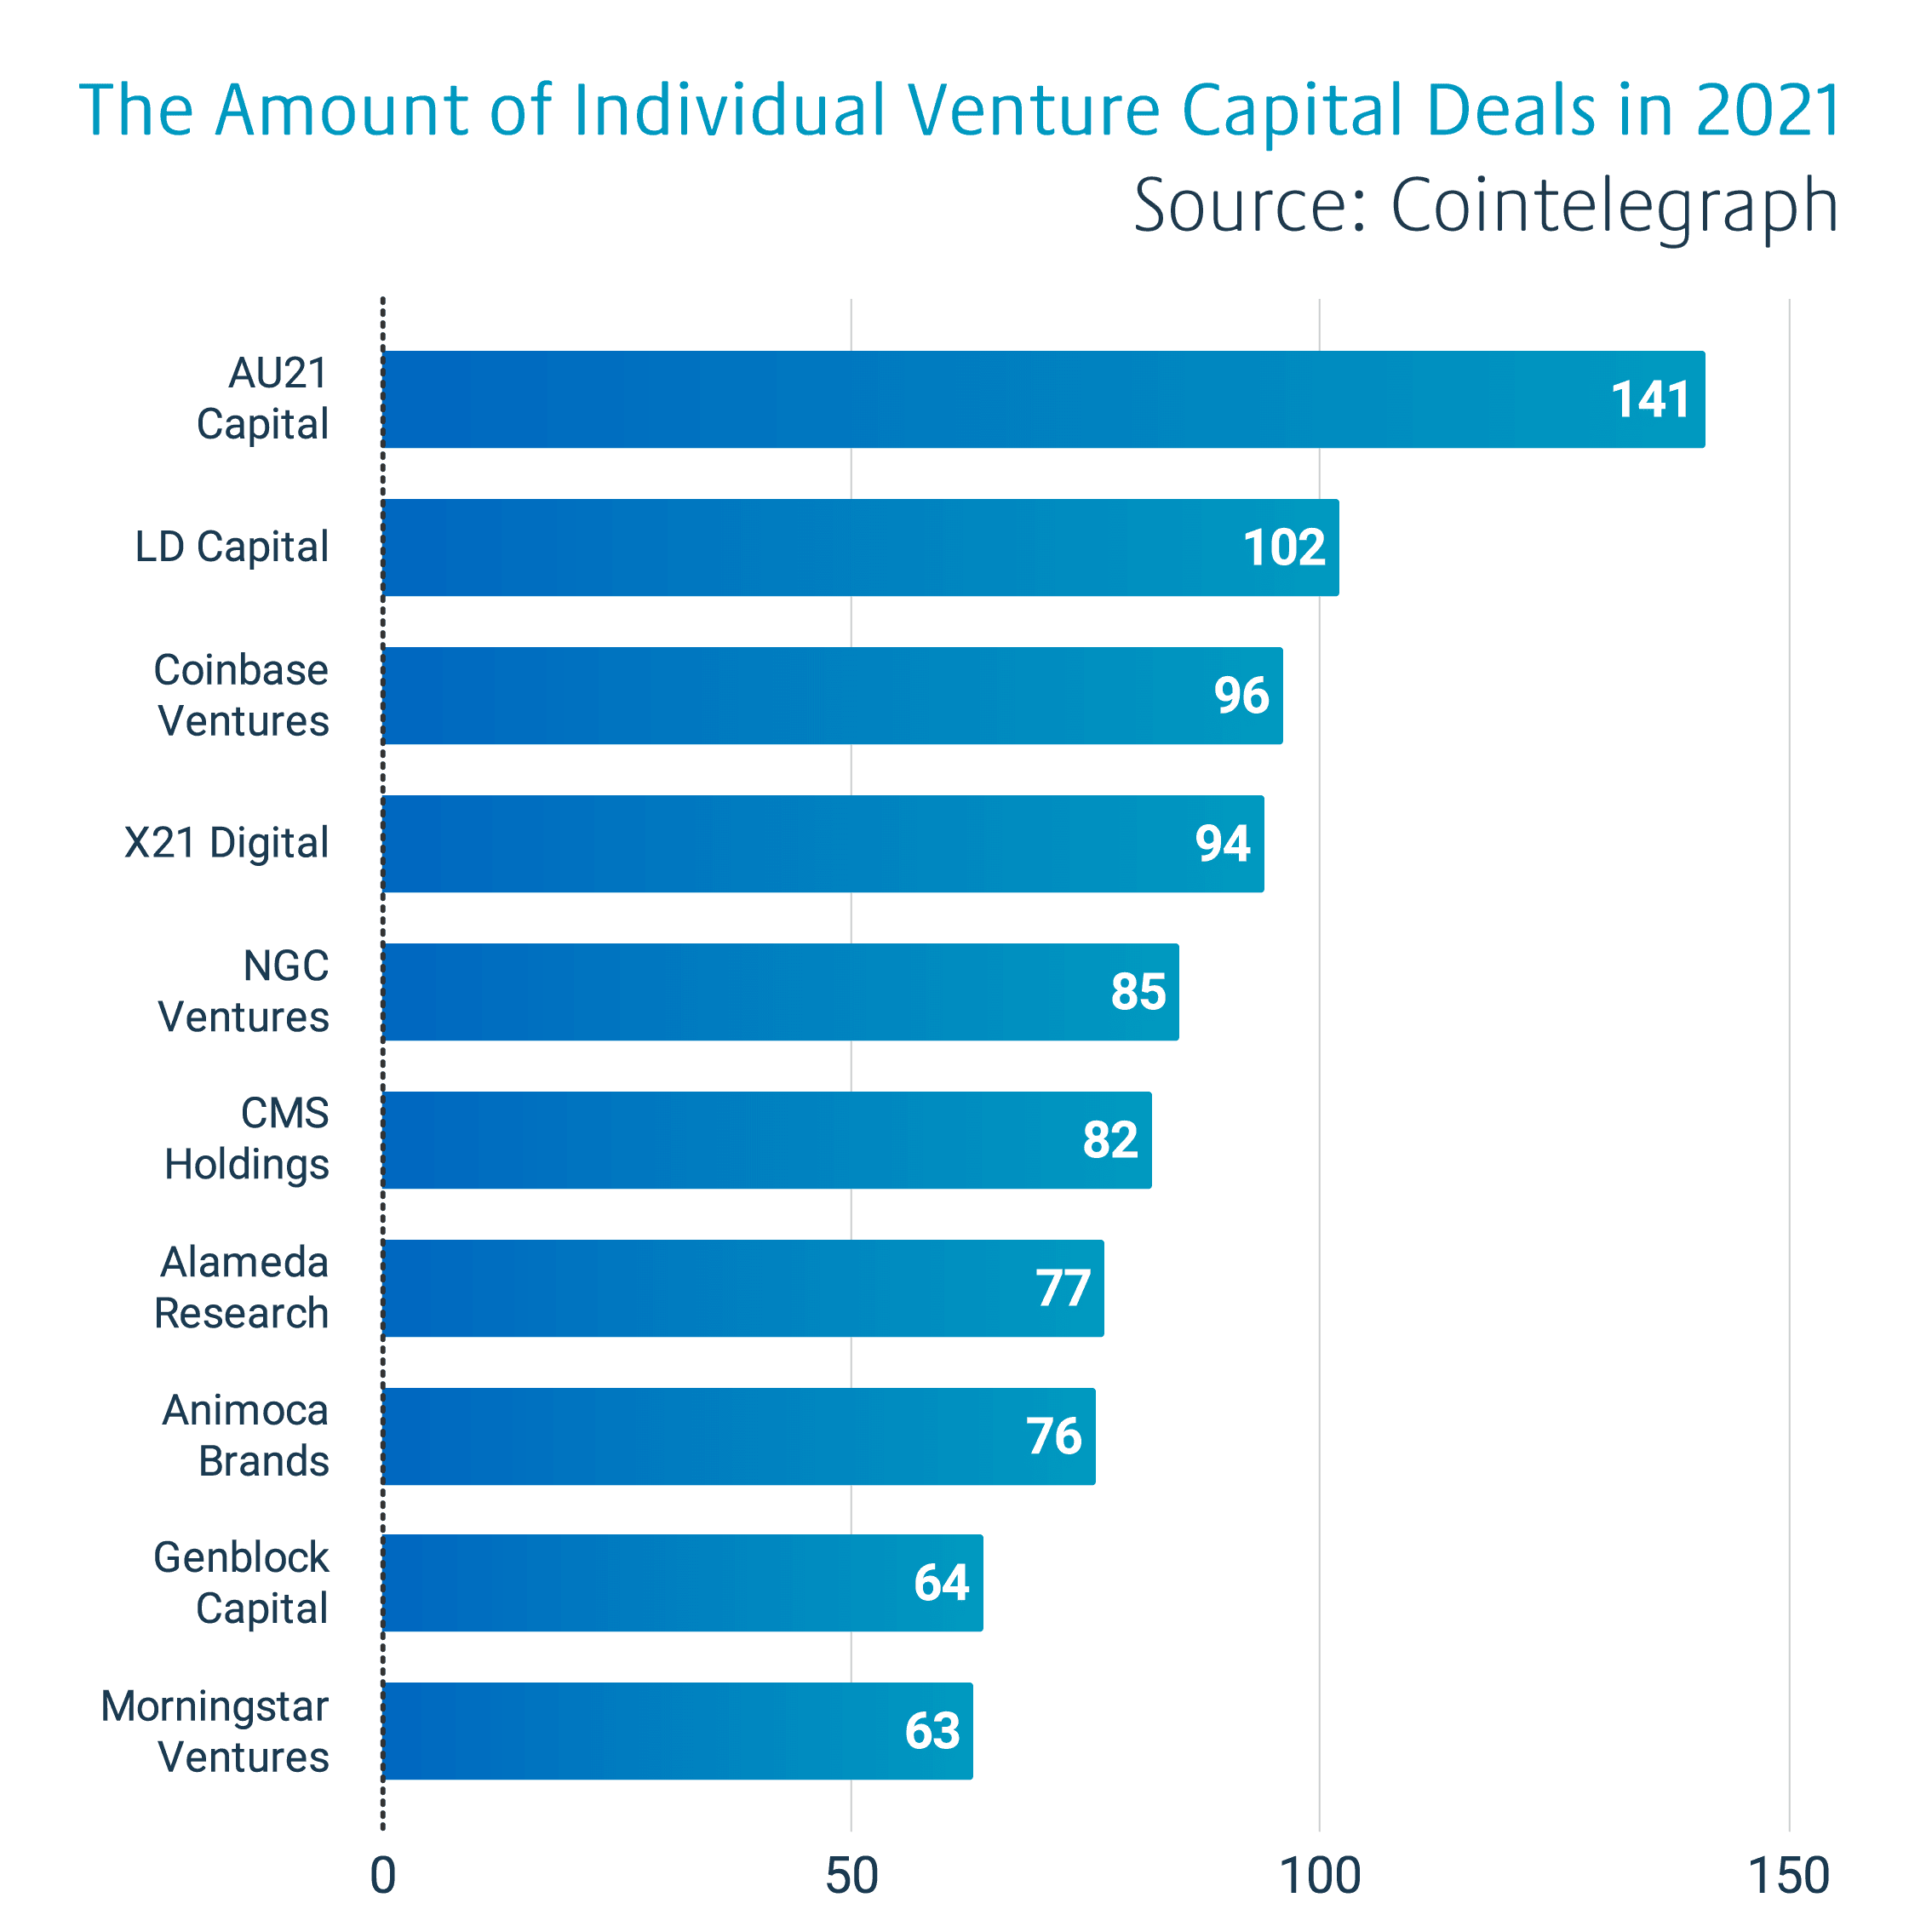
While most of the VC firms focused on decentralized finance and NFTs, the more legacy companies like Coinbase Ventures and Alameda Research preferred centralized finance (CeFi) infrastructure. Despite the DeFi offering unparalleled returns in 2021, selected CeFi infrastructure is probably a safer bet over the long-term horizon.