

The TA of week 35 explores bitcoin’s price action in relation to 1y-2y realized price. Additionally, we examine market cycle models and find out how low the price could potentially drop.
The cryptoasset market experienced yet another week of negative price action, propelling the leading cryptocurrency bitcoin to a -5,2 percent decline. Bitcoin seems to be gravitating towards the CVDD indicator’s bottom price of $15K. Last week’s TA explored the CVDD, or Cumulative Value Days Destroyed indicator, as an accurate bottom signal.
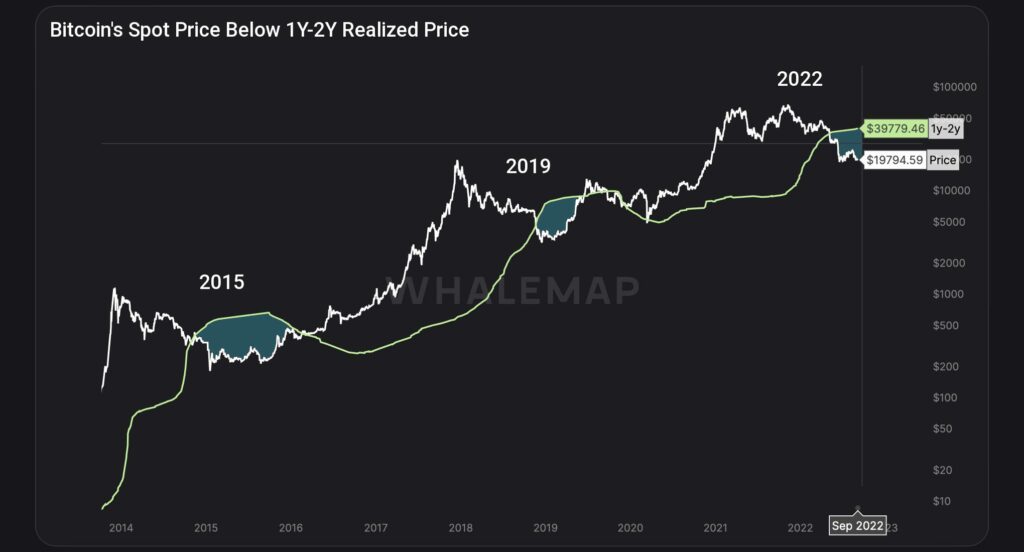
Bitcoin’s spot price has fallen below the critical 1y-2y realized price indicator, forming a rare pattern. BTCUSD has previously been two times beneath the 1y-2y realized price during Bitcoin’s history, in 2014-2016 and 2018-2019. In the bear cycle of 2018 and 2019, bitcoin spent 7 months below the 1y-2y realized price, rising above the indicator during summer 2019’s bull rally. The years 2018 and 2019 are good benchmarks, as they portray a comparable bear scenario to the current market cycle. If we assume that bitcoin would stay under 1y-2y realized price for seven months like in 2019, the current bear market might end in a time window of Q4 2022 – Q1 2023.
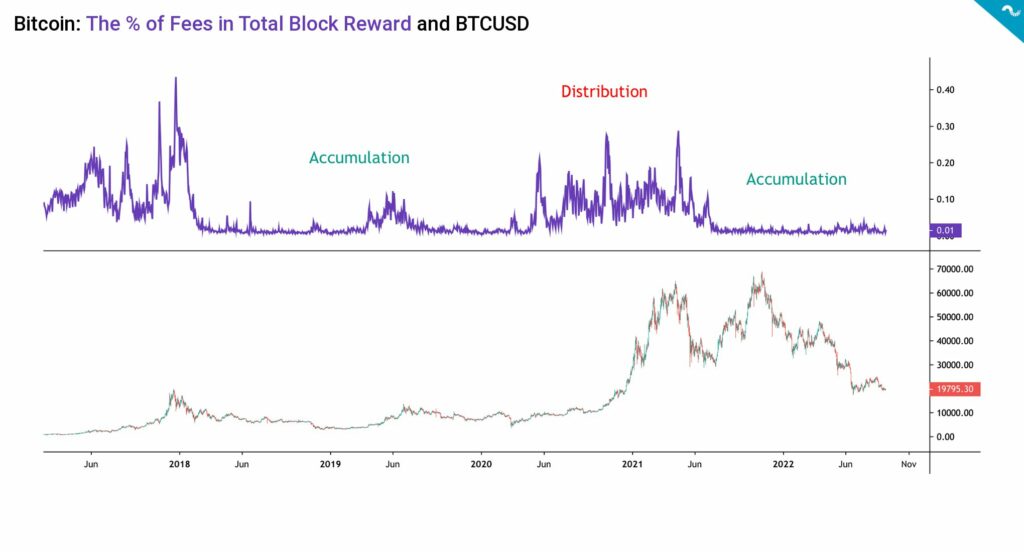
The recent on-chain data shows how the percentage of fees in total block reward has remained low since May 2021 spot price correction. When comparing data since 2017, the percentage of fees in total block reward data can be divided into two major segments: Accumulation cycle (green) and distribution cycle (red). Accumulation cycles have been favored by institutions and smart money, while distribution cycles have been characterized by retail demand.
The on-chain data since 2017 shows how the said year was definitively a distribution cycle, as percentage of fees in total block rewards climbed to 0,43 in late December of 2017. The distribution cycle of 2017 was followed by an accumulation cycle in 2018 and 2019, including a small distribution phase during summer 2019. The accumulation cycle of 2020 was again followed by distribution cycle in late 2020 and early 2021, correlating with huge spot price hikes. Despite the recent bearish price action, Bitcoin is still in an accumulation cycle.
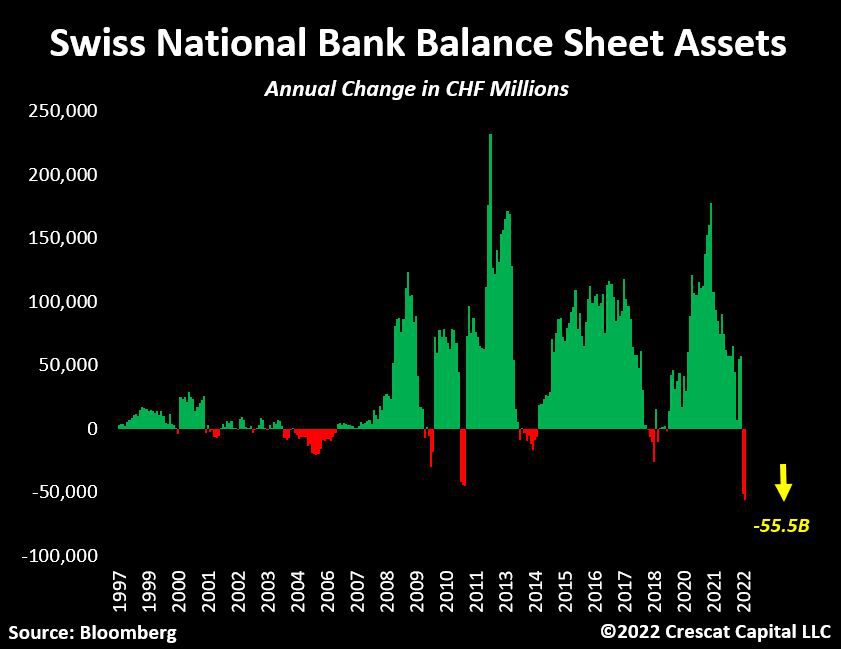
The macro-environment continues to challenge investors while Europe struggles with a local energy crisis. Although Europe’s crisis is more pronounced in the EU countries, the Swiss National Bank (SNB) just sold its largest amount of assets ever. The SNB reported a loss of 95,2 billion CHF for the first half of 22, equal to around 10% of its total foreign currency investments, or 12,2% of Switzerland’s GDP. This has by far been the largest six-month loss since the SNB was founded in 1907.
Despite bitcoin’s 5,2 percent drop, other cryptocurrencies have stayed surprisingly flat. Ethereum is only down -0,5% within the past seven days, and Litecoin is up 1,3%. Markets seem to be confused about the uncertain macro environment, leading to directionlessness. The stock market index S&P 500, has decreased 1,96% from last week and gold by 1,55%. Gold seems to be correlated with the downturns of the main street, probably due to demand destruction.
Bitcoin (BTC): -5,2%
Ethereum (ETH): -0,5%
Litecoin (LTC): 1,3%
Aave (AAVE): -1,8%
Chainlink (LINK): 1,3%
Uniswap (UNI): -5%
Stellar (XLM): -2,5%
XRP: -3,1%
– – – – – – – – – –
S&P 500 Index: -1,96%
Gold: -1,55%
– – – – – – – – – –
Bitcoin’s 90-Day Pearson Correlation with S&P 500 Index: 0,5
Bitcoin RSI: 31
Ethereum’s Merge Scheduled for Next Week
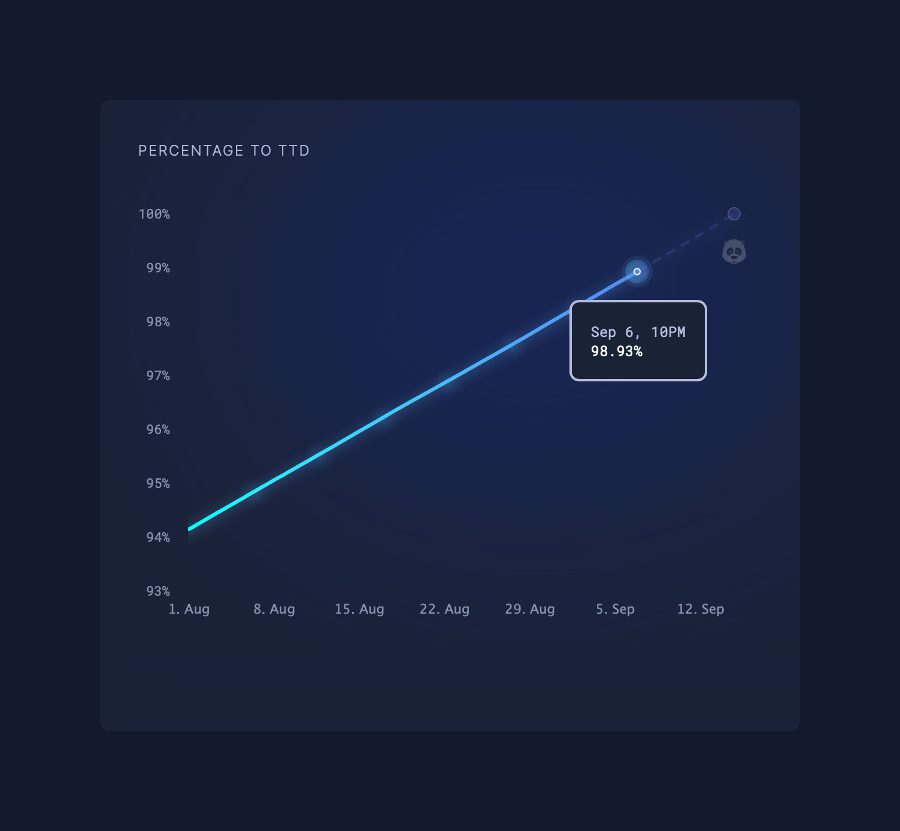
The leading decentralized finance platform Ethereum is quickly approaching its anticipated “Merge”, which is estimated to occur in just seven days. The market is generally expecting the Merge to act as a catalyst for Ethereum’s price appreciation. The main selling point of the merge will be the classification of Ethereum as a “green” and “ESG friendly” blockchain. Asset managers are increasingly aware of ESG-related topics and significantly lower energy consumption would make Ethereum easier to sell to investors. The green narrative would also allow Ethereum to differentiate itself from PoW-based Bitcoin.
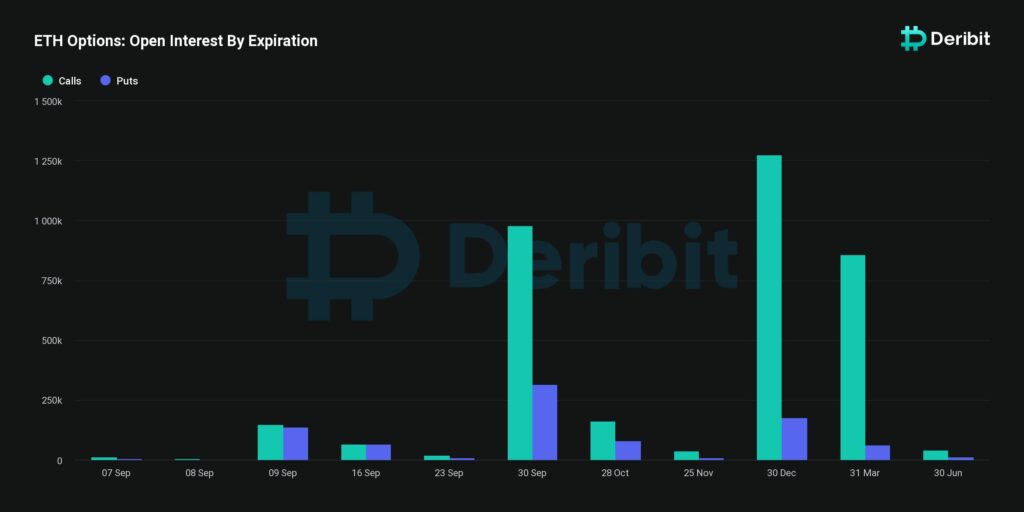
Despite the bearish price action, the derivatives market is still relatively bullish for Bitcoin and Ethereum to rise over the next 6 to 12 months. Ethereum’s put-call ratio is at 0,25 and shows more optimism than Bitcoin’s 0,6. The Merge also means the termination of Ethereum’s PoW-based mining, and f2pool recently announced the termination of ETH mining between September 10th and 20th. The ending of Ethereum mining will likely create multiplicative effects, as miners are looking for new assets to mine. Ravencoin could be one of Ethereum alternatives for PoW miners, and the RVN token has surged by 26 percent within seven days.
The EIP-1559 upgrade has been burning Ethereum’s fees since August of 2021, effectively making the supply more scarce. Now Ethereum is expected to shift from inflationary to deflationary as the supply turns south. Some analysts even expect Ethereum to enter a virtuous deflationary cycle.
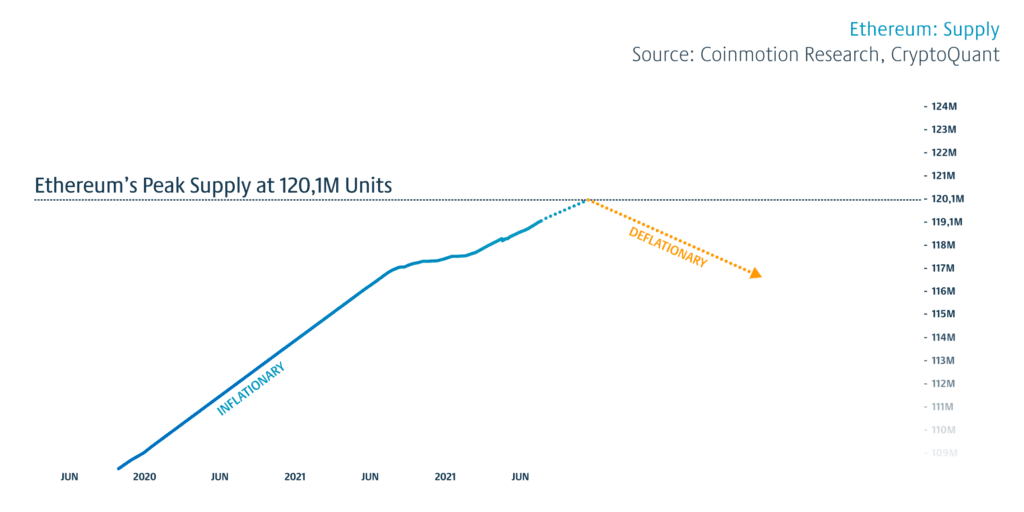
Some analysts have expressed concerns over Ethereum being “too deflationary” post-Merge. Arthur Hayes hopes that Ethereum will not become too expensive by deflation, however, he reminds us that the ecosystem always has an option to adjust itself.
Benchmarking Bitcoin with Previous Market Cycles
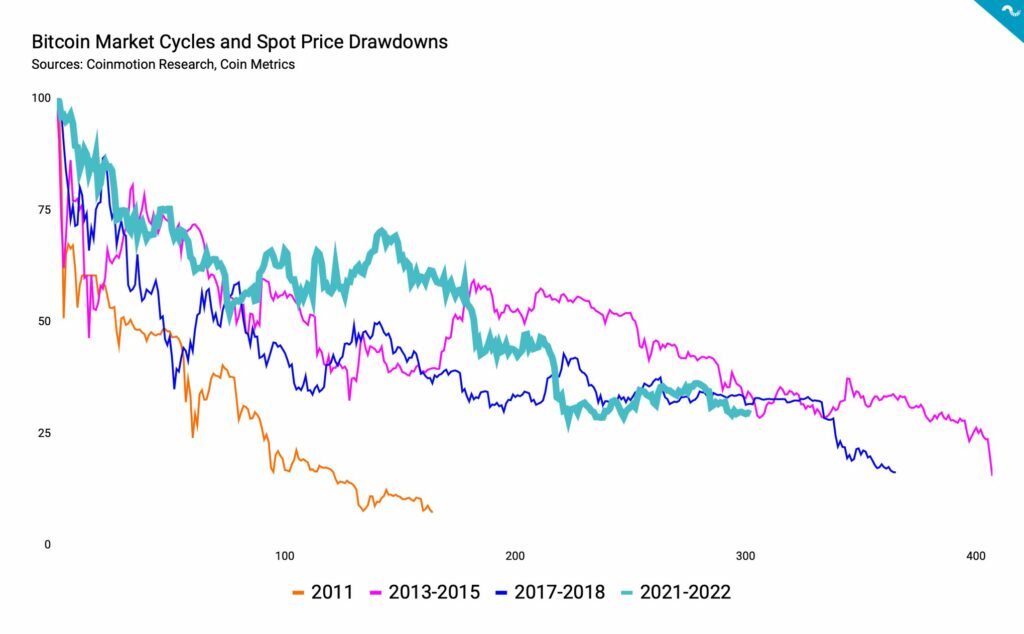
Bitcoin has objectively had a brutal year so far, and the spot price has declined -70,69 percent from November’s peak. Bitcoin’s year-to-date performance looks a little more forgiving, as bitcoin is “only” down -60,75% from January 1st. Bitcoin is a particularly volatile asset, and it has seen multiple long drawdowns since its inception. The current bear cycle has lasted 303 days, meaning we’re quite close to the 366-day length of the last major bear (2017-2018). If we use the 2017-2018 bear cycle as a benchmark, bitcoin might find a market bottom within 60 days, i.e., two months.
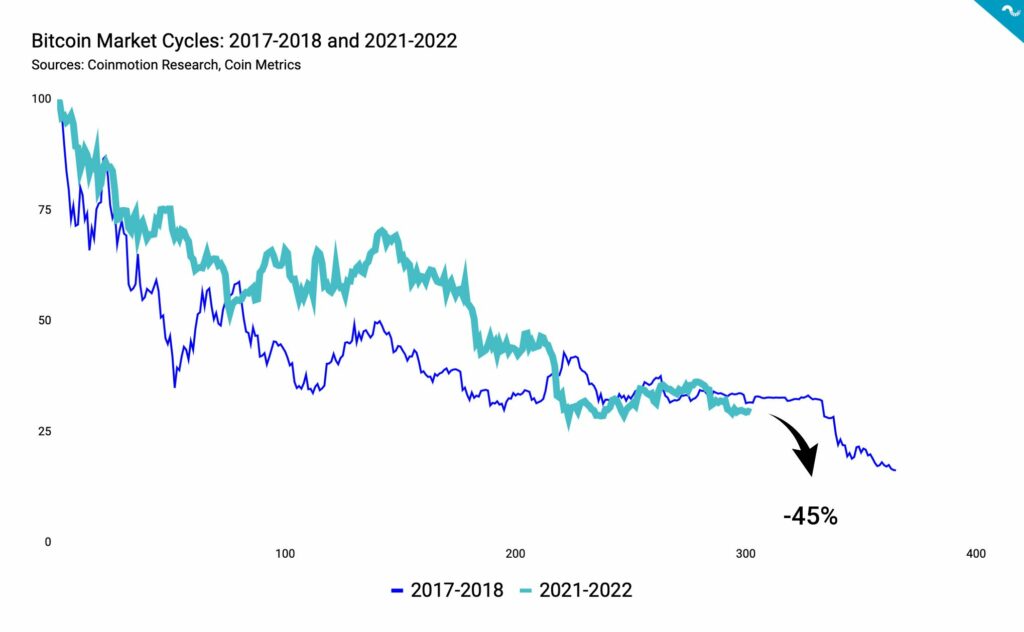
When we explore the 2017-2018 bear cycle in detail, bitcoin’s spot price saw its last correction during the cycle’s last 60 days. If we assume that bitcoin will follow the same path, there should still be a major capitulation event ahead. In order to reach 2018’s market bottom, bitcoin’s spot price should further decline by -45 percent, and that would drop BTCUSD to 10 290 US dollars. However, bitcoin’s current price action is not closely correlated with the year 2018, meaning the outcomes might quickly diverge.
What Are We Following Right Now?
Arthur Hayes, co-founder of BitMex, discusses how he’s trading the Merge, the impact of macroeconomic policy in the markets, and his career as a writer.

A quick wrap-up of Ethereum’s upcoming Merge by the Bankless team.

The housing market of United States doesn’t look healthy. 35 percent of home prices were mostly decreasing last month.

The views, thoughts, and opinions expressed in the text belong to the author and not necessarily to the author’s employer, organization, committee, or other group or individual.