


Bitcoin price got above $14k for the first time since the all time high top almost three years ago.
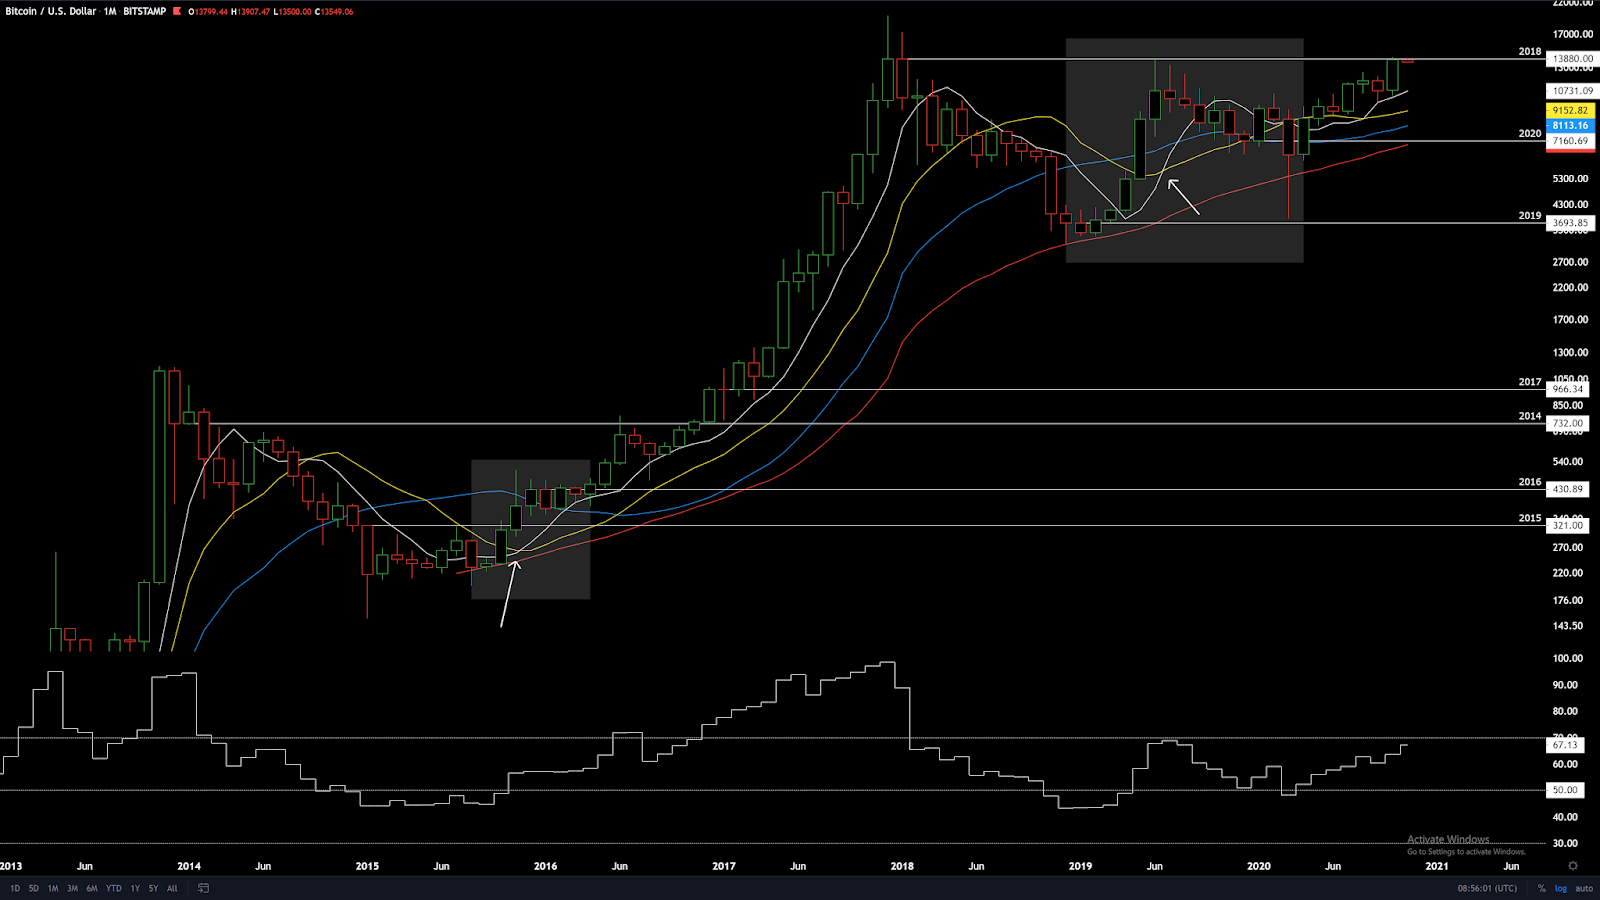
Let’s start from a long term view, from the monthly candle chart. These rectangles have some similarities. The white average from 20 weeks almost hits the red average from 200 weeks, but instead turns up and starts crossing the yellow average from 50 weeks and the blue average from 100 weeks.
Relative strength index at the bottom of the chart also goes below 50 similarly before both rectangles.
Seems likely that these rectangles mark the first up moves from bear market bottoms. The first one from around $200 and the more recent one from around $3k. The recent bull move also looks a lot bigger in relation to the move from $200. I wonder if this means that the next move up will be very strong like the move from $3k-14k was.
There are also seven yearly opens showing on the chart. Yearly open is the first traded price of the year. Drawing horizontal rays from these points in time seem to create important support/resistance levels. Proof of this is simply right there on the chart.
We just hit the 2018 yearly open at $13880 which stopped the rise back in June 2019. The rise to this yearly open has been so slow and steady that I am sceptical to think that it would be a big resistance.
If we do have a slightly bigger correction here, then like you can see from the bull rally that started from $200, the white average from 20 weeks is usually a very good buy.
Getting above this yearly open at $13880 with a daily and then weekly close will most likely lead to slow acceleration of this bull market, but the power can surprise many. The rise to $14k was very powerful, as was the long squeeze margin cascade that followed it to $4k. The first roars of the beast that just woke up.
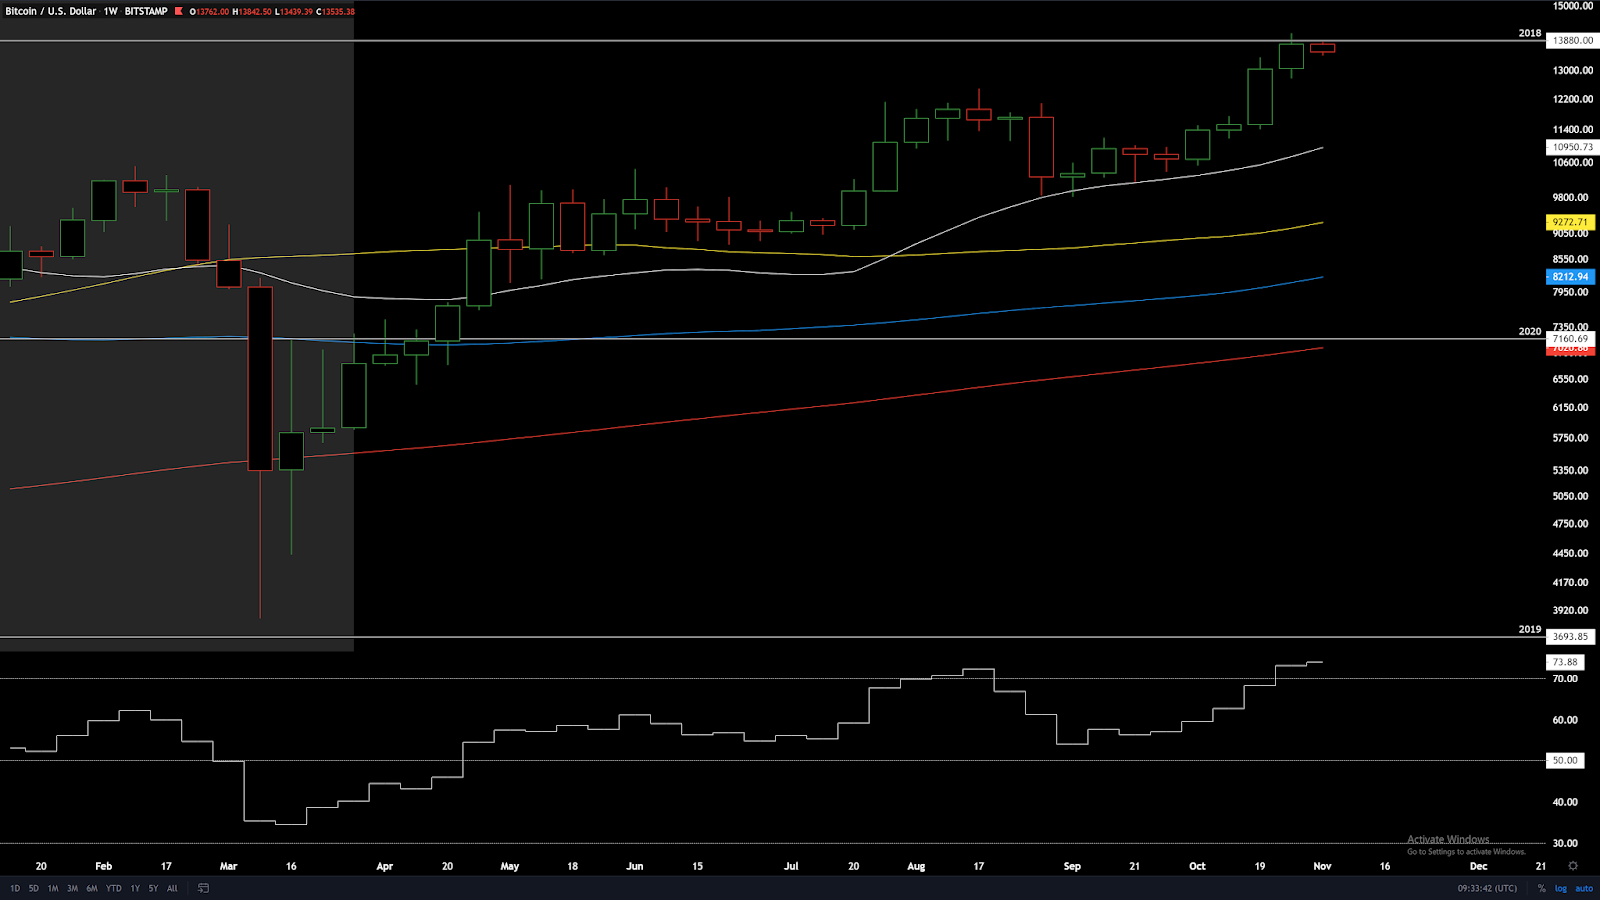
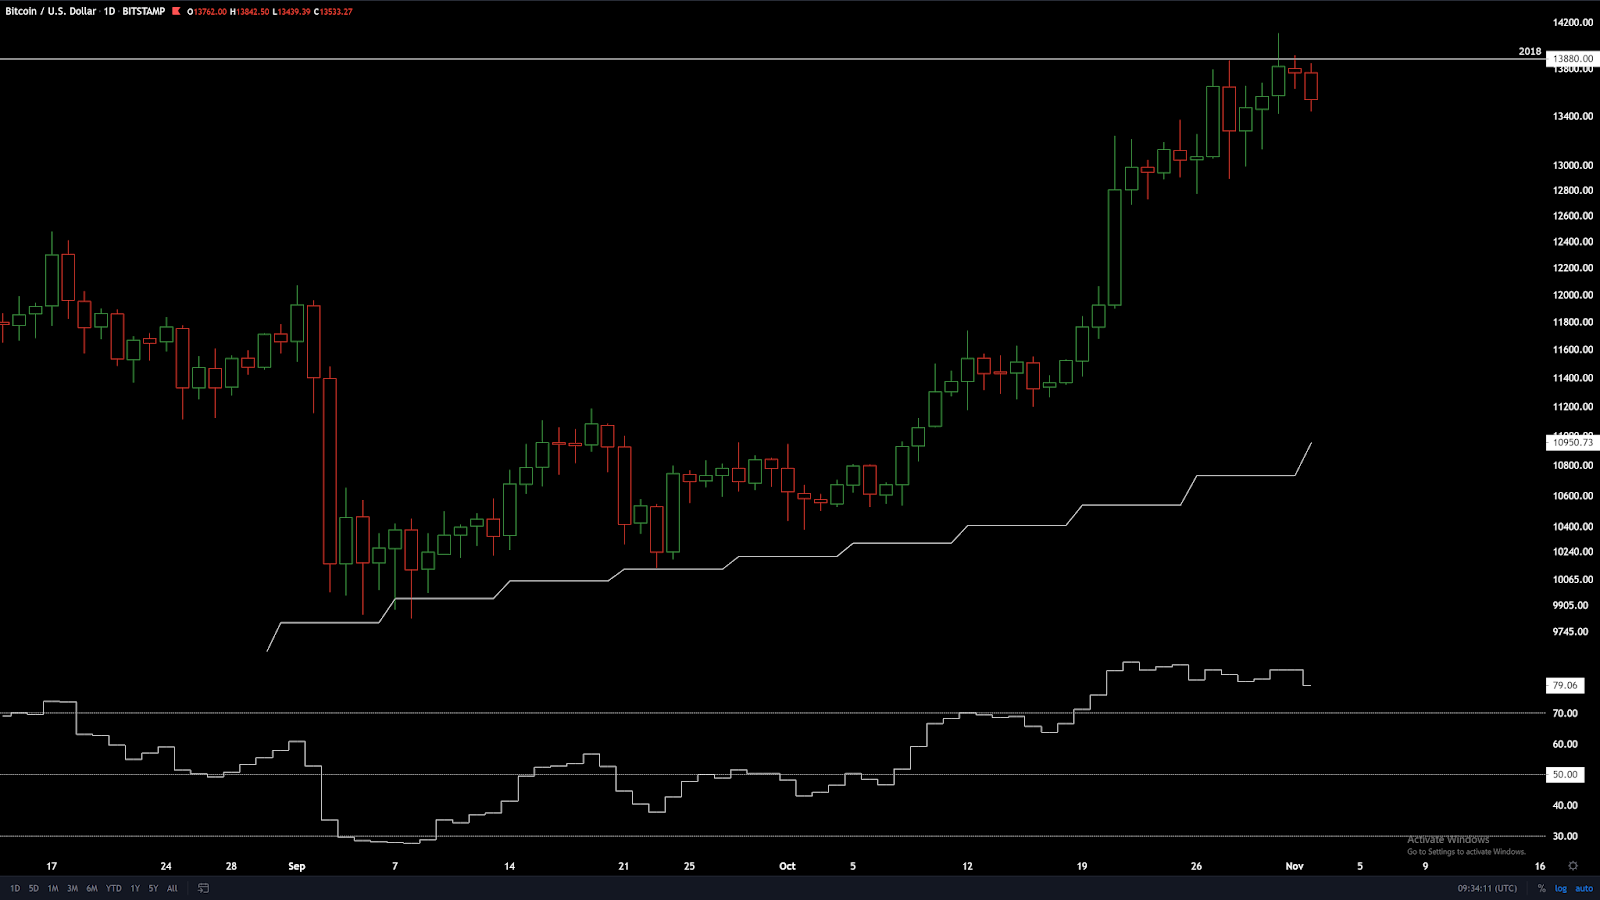
Here are closer views of the same chart. First is the weekly chart that shows recent close just below the yearly open and then the daily chart which shows two wicks through the yearly open.
Let’s see what happens next. My ‘educated guess’ is that we break this yearly open right away and see some FOMO buying (fear of missing out) or we see a small correction to the white average from 20 weeks.