
The TA for week 32 benchmarks BTC against gold and forecasts an upcoming bitcoin “golden cross” situation.
Bitcoin: From Death Cross to Golden Cross
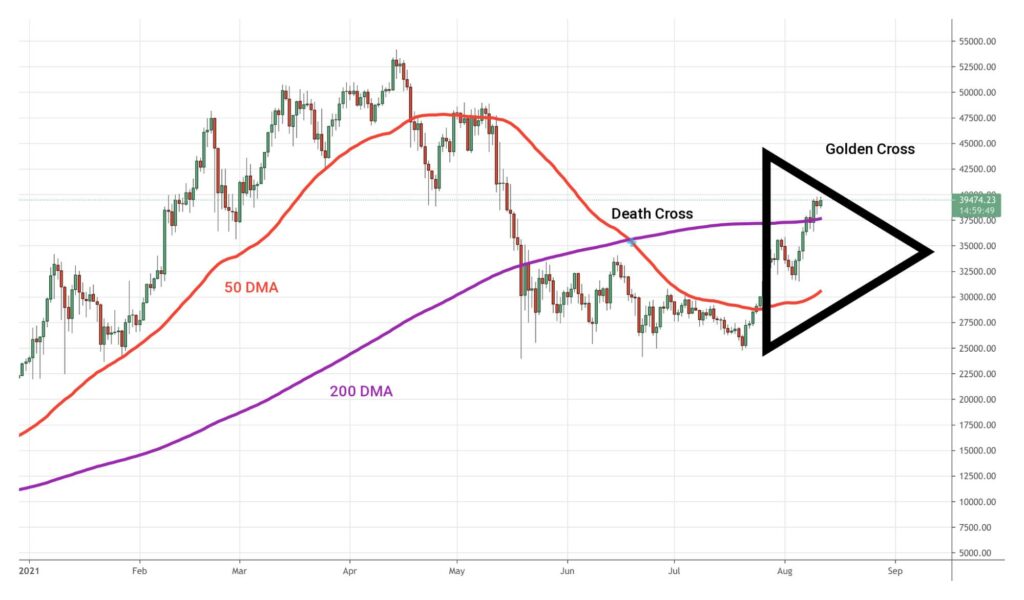
In mid-June, we warned about the approaching bitcoin “death cross” situation, which appeared to be true, with bitcoin dropping -19,7 percent between June and July lows. The sentiment saw a radical change, though, ascending strongly in late July. Now the recent technical analysis would indicate towards a “golden cross” composition, a complete opposite to the death cross.
What is Bitcoin Golden Cross?
While the death cross means a 50-day moving average (50 DMA) crossing under a 200-day moving average (200 DMA) the golden cross means 50 DMA crossing above 200 DMA. The interpretation is also a complete opposite: While the death cross is a bearish indicator, the golden cross obviously is a bullish one.
Uplifted by the current rising price performance, bitcoin could reach the golden cross situation in late August or early September. When the golden cross happens, 200 DMA is considered as the support level for future price action, and 200 DMA acting as resistance in the death cross, vice versa. Bitcoin’s trading volume has been rising, further amplifying the golden cross.
Fundamentals: Bitcoin MVRV Rising
Bitcoin’s market capitalization / realized capitalization (MVRV) indicator has been ascending vis-à-vis BTCUSD during the recent bull cycle. MVRV climbed above 2,26 from previous July 1,54, the lowest MVRV value in 2021. MVRV is calculated by dividing the market cap by realized cap and it’s a good instrument for estimating if bitcoin is over-or undervalued.
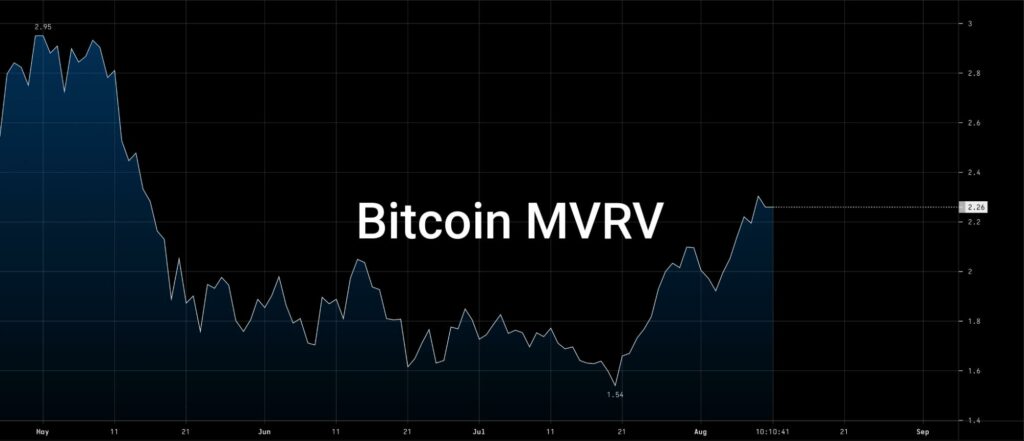
A negative MVRV ratio indicates market participants being not in profit, or minimally in profit. Positive MRVR indicates asset holders likely being in profit, respectively. BTC is generally considered as overvalued when MVRV exceeds 3,7 and undervalued when it’s below 1.
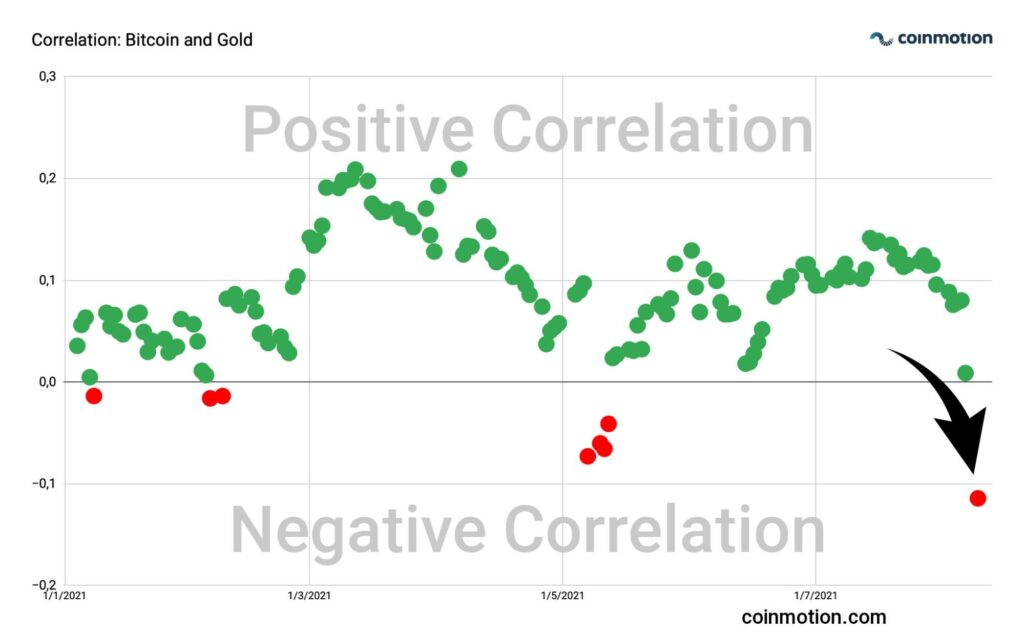
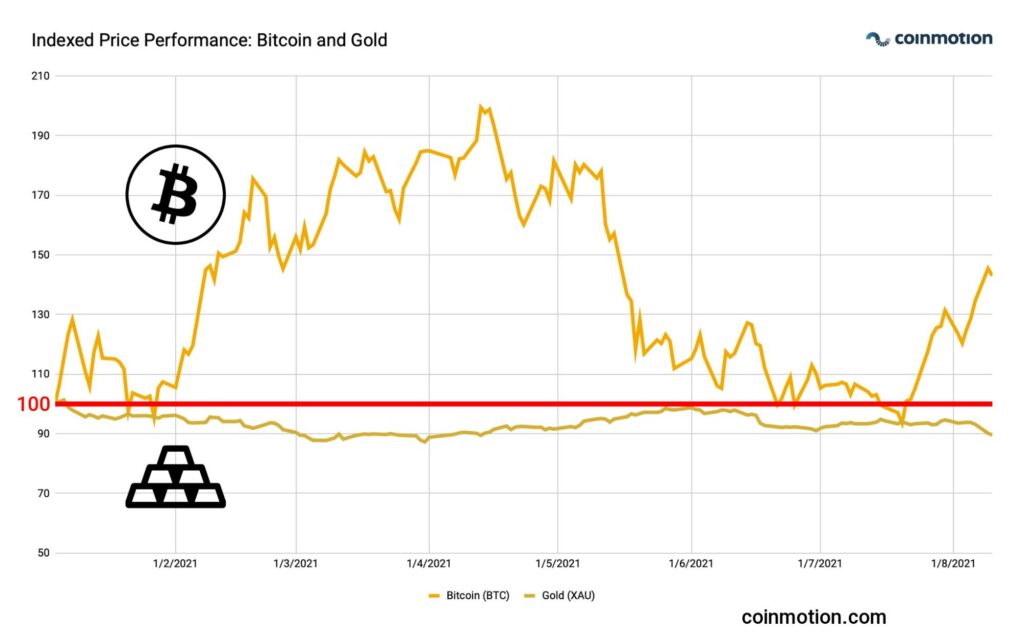
Bitcoin Crushes Gold’s Price Performance, Lowest Correlation Since 2018
Gold and Bitcoin are often seen as comparable assets, both deriving their value from scarcity. Bitcoin’s scarcity is based on the limited amount of bitcoin units, theoretically peaking at 21 million. The amount of gold is not limited in a similar fashion, yet it’s a scarce asset as well. While the two assets have been previously correlated, bitcoin has significantly outperformed gold in 2021, as the following indexed price performance chart shows. Gold rapidly dropped -4 percent within minutes this Monday, combined with a limited amount of market liquidity.
The bitcoin/gold correlation dropped to -0,11, following the gold’s flash crash. The correlation between bitcoin and gold hasn’t been this low since November 2018 when the correlation dropped below -0,2. Last year (2020) bitcoin and gold were historically correlated, rising to close proximity to 0,6. While gold has been perceived as an inflation hedge and “sound money” alongside bitcoin, the short-term narrative seems to be broken. Gold’s crash comes at a weird time as U.S. inflation data (CPI) shows inflation rising to 5,4 percent.