


The TA of week 17 explores recent market action, including technical and fundamental indicators. Additionally we evaluate a new market cycle model by Coinmotion Research.
The market environment remains challenging and bitcoin currently acts as a high beta asset, following the downward trajectory of technology stocks and Nasdaq Composite. Bitcoin has been exceptionally highly correlated with stock market during spring of 2022, however this correlation could also be a temporary anomaly. By now many speculative investors have been flushed out, offering bitcoin an opportunity to decouple from stock market again.
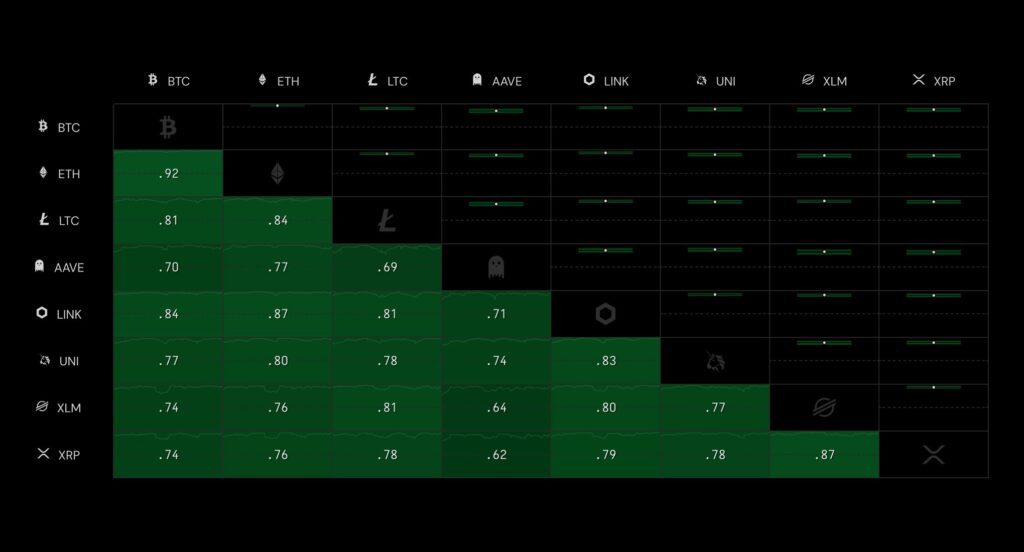
Bitcoin and digital assets continued their downtrend during week 17 as the leading cryptocurrency weakened -1,1 percent. The leading decentralized finance (DeFi) platform Ethereum weakened -2,2%, while correlating heavily with Bitcoin at 0,92 30-day correlation. Following the main rule, small-cap altcoins weakened more than Bitcoin, leading to Uniswap dropping almost -20%.
The correlations have a tendency to reach towards one (1) during market crashes, and crypto market follows this rule closely. In addition to high ETH / BTC correlation, Aave’s 30-day correlation with Bitcoin took a huge leap from last week, rising from 0,55 to 0,70. Aave’s correlation with Ethereum increased from 0,66 to 0,77. The high correlation makes diversification difficult in the current market setting, however DeFi coins are known to have significant divergence to Bitcoin during bull cycles.
7-Day Price Performance
Bitcoin (BTC): -1,1%
Ethereum (ETH): -2,2%
Litecoin (LTC): -3,7%
Aave (AAVE): -12,2%
Chainlink (LINK): -14,9%
Uniswap (UNI): -19,6%
Stellar (XLM): -7,3%
XRP: -10,3%
– – – – – – – – – –
S&P 500 Index: -3,27%
Gold: -1,81%
– – – – – – – – – –
Bitcoin’s Illiquid Supply: 78%
Bitcoin RSI: 39
Elon Musk Purchases Twitter, Sends a New Wave of Speculation
US-based entrepreneur and billionaire Elon Musk stirred the markets on Monday 25.4 by announcing a $44 billion plan to purchase majority of Twitter’s shares. Twitter is an important social media platform for crypto as it has integrated Bitcoin features, starting with profile tip option in late September 2021.
Investors also speculated that the price of Dogecoin (DOGE) would rise as it’s been one of the favorite cryptoassets of Mr. Musk. DOGE climbed from 0,12 USD level to 0,16 during Monday’s rapid flash rally, propelling the asset to >33% ascent.
Musk has previously talked about elevating Dogecoin’s position among cryptocurrencies, however his company Tesla only added Bitcoin (43K native units) to its reserves in 2021. Musk is also known to be a fan of meme culture, so it’s sometimes hard to estimate if he’s “memeing” or actually being serious. Will Elon Musk somehow integrate Dogecoin to Twitter or is this pure speculation? That remains to be seen.
Dogecoin is currently not listed on Coinmotion’s platform, however it can be purchased via our Coinmotion Wealth service.
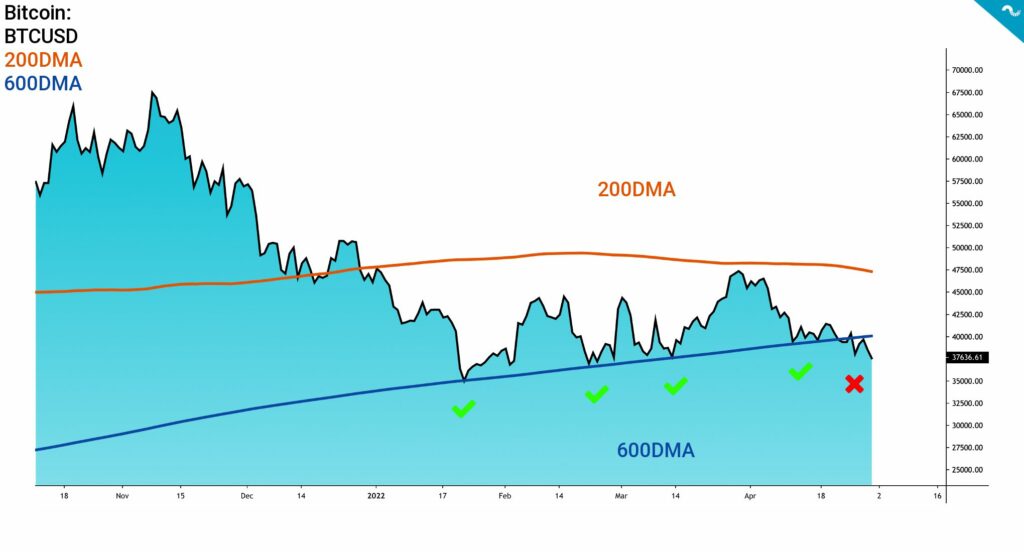
Bitcoin Falls Through The 600DMA Support
Pulled down by significant selling pressure, bitcoin’s spot price recently breached it’s 600-day moving average (600DMA) (blue) multi-month support. Bitcoin has been testing the 600DMA on several occasions since January’s trend reversal. The 600DMA has been holding its position for 3 months, however every spot price touch eventually made it weaker.
The 200-day moving average (200DMA) (orange) approches 600DMA from above and these two MAs could form a “Death Cross” setting, should the spot price drop further. 200DMA crossing 600DMA to the downside would be a significantly bearish technical signal.
Bitcoin will closely follow the upcoming FOMC meeting during week 18, as the Federal Reserve (Fed) should announce new monetary policy guidelines. Many analysts are expecting the rates to be increased by 50 basis points, or 0,5 percent.
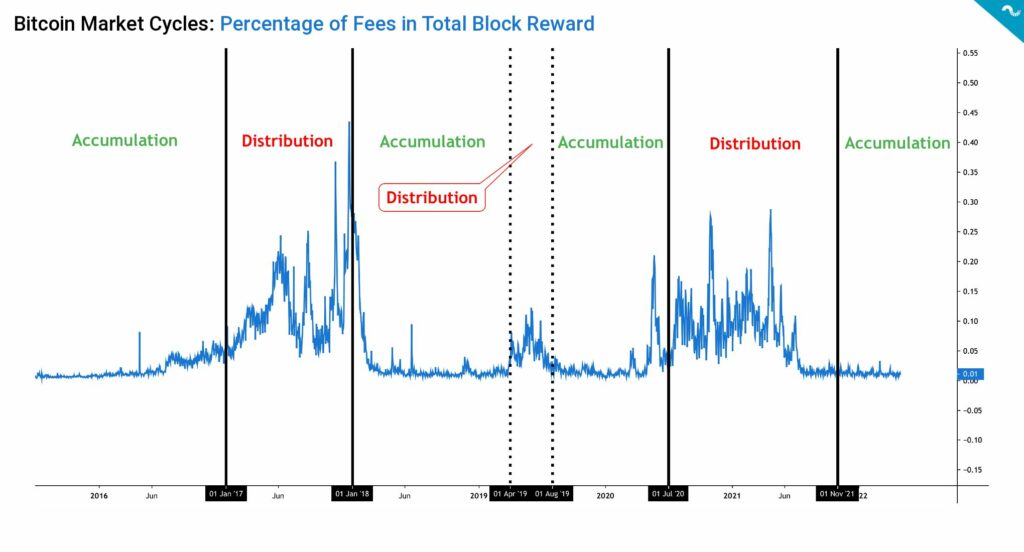
Has Bitcoin Entered a New Market Cycle Already?
While the market looks rather gloomy, it’s important to “zoom out” and take a longer term perspective. As estimated in technical analysis of week 16, the whales (addresses with ≥ 1000 bitcoin units) have been increasing their holdings despite the challenging market environment. In fact, the whales by default follow contrarian strategies, buying into relative spot price weakness. In addition to segmenting the market into simple bear and bull cycles, block reward fee data allows us to divide the market into accumulation (green) and distribution (red) cohorts.
By using the block reward fee data, I’ve build a model that divides the Bitcoin market into seven parts since 2015. The first obvious segment is the accumulation cycle from 2015 to 2016, when bitcoin was in three figures and extremely cheap to buy. In 2017 bitcoin started its parabolic advance and distribution phase, rising from January <$1000 to eventual >$19K in December. The parabolic advance attracted unprecedented investor attention, however it truly rewarded those who turned their accumulation mode on in early 2016.
The 2017 distribution phase was followed by a long accumulation period from 2018 to 2020, including a small distribution cycle during summer of 2019. The spot market really started to heat in mid-July 2020, following Michael Saylor‘s famous MicroStrategy purchases. Saylor and MSTR truly opened the flood gates for institutional appetite and following retail demand.
The next distribution phase was during the 2021 double-top spot market, heavily rewarding those who had accumulated in 2019 and 2020. As the model shows, we’re currently in an accumulation cycle again, lower spot price means cheaper coins for long-term game.
Could Corrections Actually Be Healthy for The Market?
Digital assets form the only free market and as such, it’s also inherently volatile and speculative. Without downplaying the painly consequences of market corrections, they might actually be healthy for the long-term market. During bull cycles the free market attracts a huge amount of projects, including totally non-viable ones. The corrections are needed to separate the wheat from the chaff.
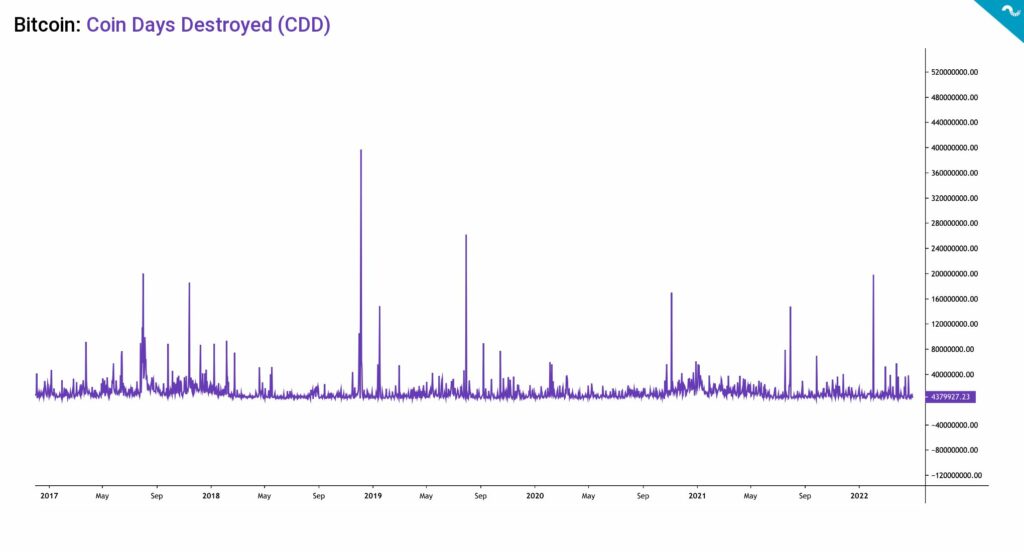
Bitcoin’s Coin Days Destroyed indicator, or CDD, gives a good insight into market corrections. The most notable capitulation moment of recent years was seen in late 2018, marking the highest CDD print so far. The 2018 market correction was brutal to traders: Bitcoin’s spot price fell -70 percent from the 2017 peak and when market seemed to have found a support, it dropped -50% again. However in 2019 bitcoin quickly recovered to $12K levels again.
CDD essentially highlights the position of long-term holders (LTH) and is considered as an alternative to basic transaction volume metric. Each unspent day for a bitcoin unit adds a “coin day” and when that coin is eventually spent, the unit uplifts the Coin Days Destroyed metric. CDD can be interpreted with the following logic.
↑ High CDD: Selling pressure from long-term investors, bearish.
↓ Low CDD: No significant selling pressure from long-term investors, bullish.
What Are We Following Right Now?
A macro wrap-up by Andreas Steno Larsen, Alfonso Peccatiello, and Mike Green.

The QT is here, with historical consequences.
The end game of weak national currencies continues in emerging markets.