


Digital assets continued to slide down during 16th and early 17th week vis-à-vis stock market indices like S&P 500 and Nasdaq Composite. Investors are currently de-risking their positions due to heavy increase in geopolitical and macro-level uncertainty. The markets are waiting for upcoming FOMC (Federal Open Market Committee) meeting that will define Fed’s upcoming interest policy. Many analysts expect Fed to increase rates by 50 basis points, or 0,5 percent. Macro analyst Andreas Steno Larsen has been forecasting a rate hike as well:
“If the price of goods rises even more, the stakes are raised for Fed this summer.”
The rising rates would mark an end to abundant monetary policies as Fed need to control inflation by reducing the amount of dollar supply. This tightening or “inverse QE” will create a challenging environment for speculative small-cap tokens, however larger ones like Bitcoin should be more anti-fragile.
7-Day Price Performance
Bitcoin (BTC): -3,1%
Ethereum (ETH): -6%
Litecoin (LTC): -8,4%
Aave (AAVE): -7,7%
Chainlink (LINK): -8,4%
Uniswap (UNI): -11,3%
Stellar (XLM): -8,1%
XRP: -13,5%
– – – – – – – – – –
S&P 500 Index: -2,75%
Gold: -0,92%
– – – – – – – – – –
Bitcoin’s Illiquid Supply: 76,7%
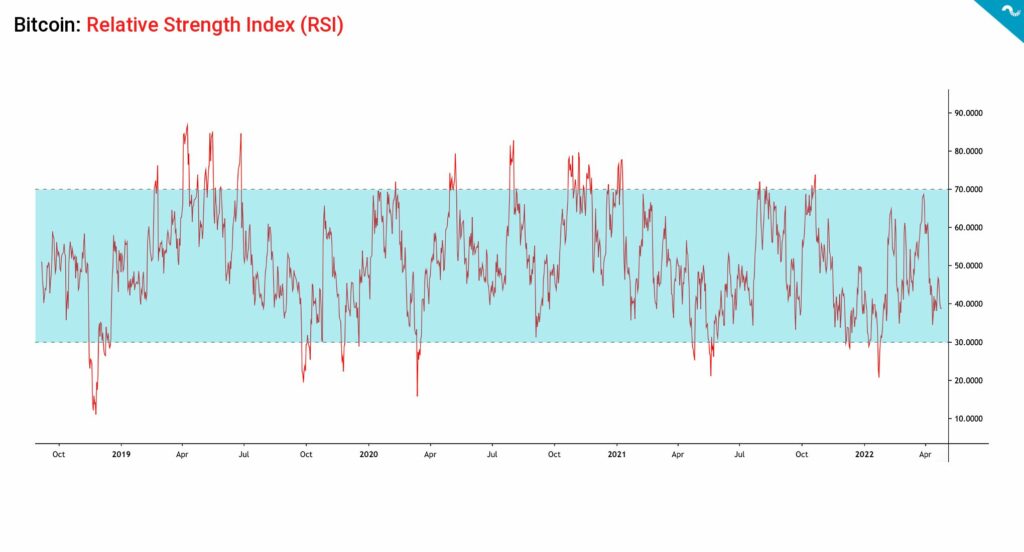
Bitcoin RSI: 39
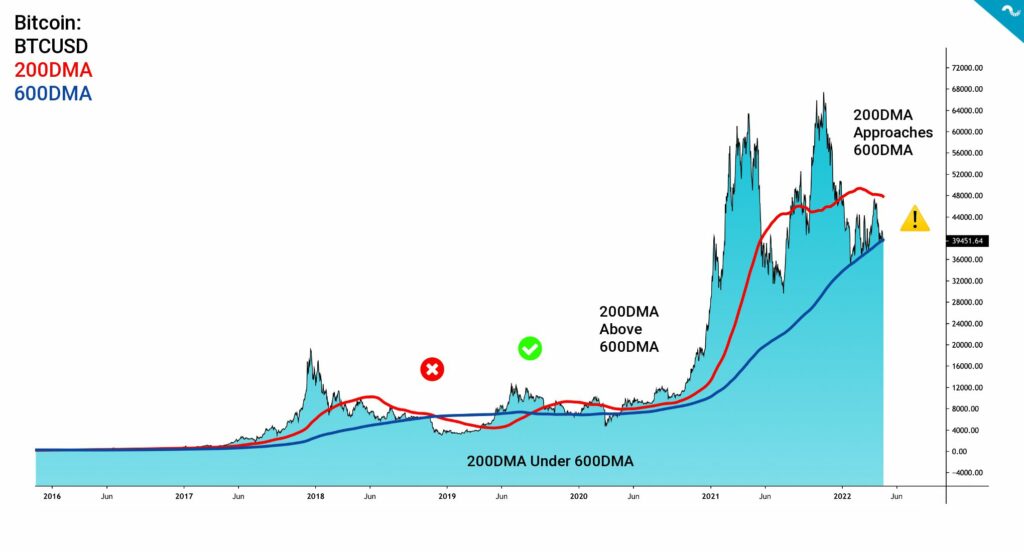
The Converge of 600DMA and 200DMA
As explored in the last TA, the 600-day moving average (600DMA) (blue) previously evolved into the de facto support for bitcoin’s spot price at $39K. Bitcoin has been oscillating in a channel formed by 200DMA (as resistance) and 600DMA (as support), however the 600DMA support was breached on Monday 25.4. During the past weeks BTCUSD hit 600DMA multiple times and each touch to the support makes it weaker. If the 600DMA breaks, the summer 2021 bottom of $29K will act as the last line of defence.
When looking at bitcoin’s historical data, the last time 200DMA dropped under 600DMA was in late 2018, leading to “Death Cross” setting and further price decline. After dropping below 600DMA in 2018 the 200DMA bounced back and has stayed above 600DMA since late 2019. The 200DMA is currently approaching 600DMA again, creating a dangerous setting for spot price.
Bitcoin’s Relative Strength Index (RSI) is currently at 39, staying at lowest levels since January. The RSI is relatively close to oversold territory of below 30, which would indicate a buying opportunity. Despite the challenging technicals, Bitcoin’s fundamentals still look good. Bitcoin’s Illiquid Supply is at 76,7 percent, making it one of the scarcest assets on planet. A future demand peak from retail or institutional source would easily lead to a “Supply Shock” setting.
Analyst PlanB recently commented he’s not expecting to see the Stock to Flow (S2F) model dropping to 0,3, as that would represent a -70% decrease from all-time high. The last time S2F model turned blue on 0,3 levels was during the 2018 – 2019 market bottom. PlanB also expects Stock to Flow to hold above 200 week moving average (200WMA) (black).
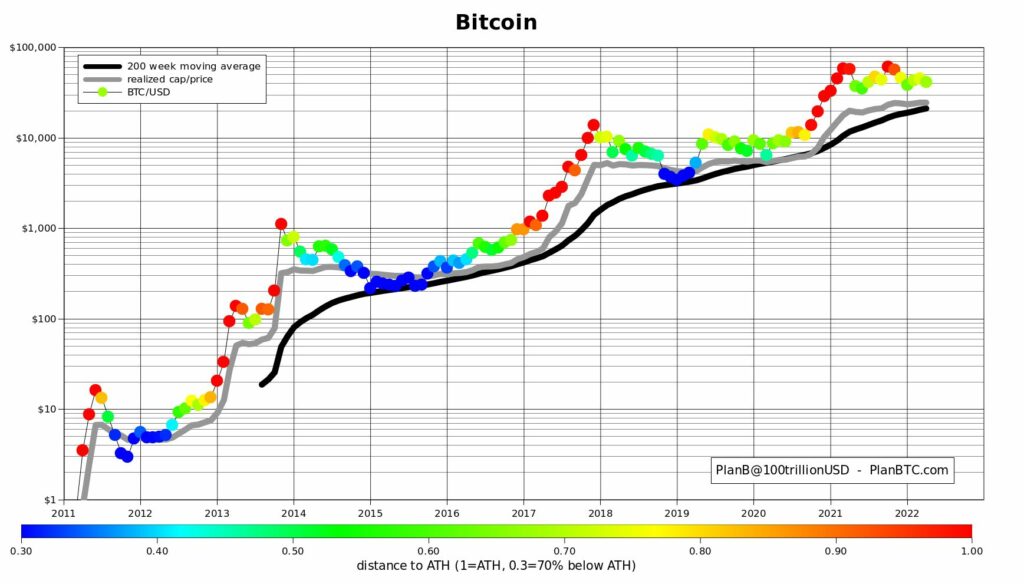
Stock to Flow model is a widely used instrument for assessing asset scarcity. It calculates the ratio of current stock of the asset and new production. In essence, stock to flow is a way to interpret the scarcity of a particular resource. Bitcoin is a scarce asset with a maximum supply set to 21 million native units. Bitcoin’s supply issuance is also defined on protocol level, making it highly predictable.
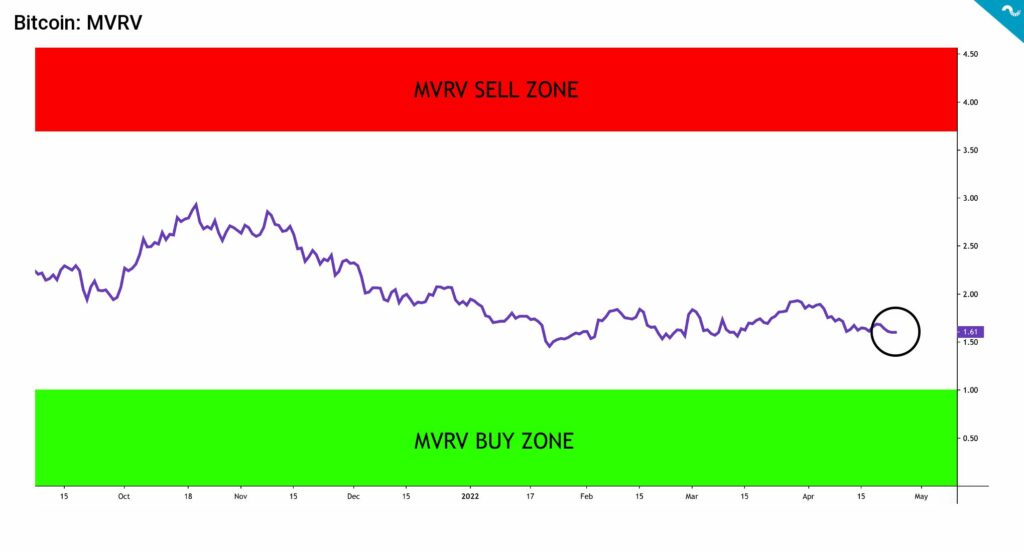
MVRV into Buy Zone?
Bitcoin’s Mean Value to Realized Value (MVRV) indicator is currently at 1,61, approaching the Buy Zone of MVRV < 1. Bitcoin is generally considered as overvalued when MVRV exceeds 3,7 and undervalued when it’s below 1.
MVRV, or Market Value to Realized Value, was firstly developed by David Puell and Murad Mahmudov in early October of 2018. The Puell Multiple indicator used in technical analyses is also named after David Puell. MVRV is calculated by dividing the market cap by realized cap and it’s a good instrument for estimating if market participants are in profit or not.
MVRV Sell Zone: > 3,7
MVRV Buy Zone: < 1
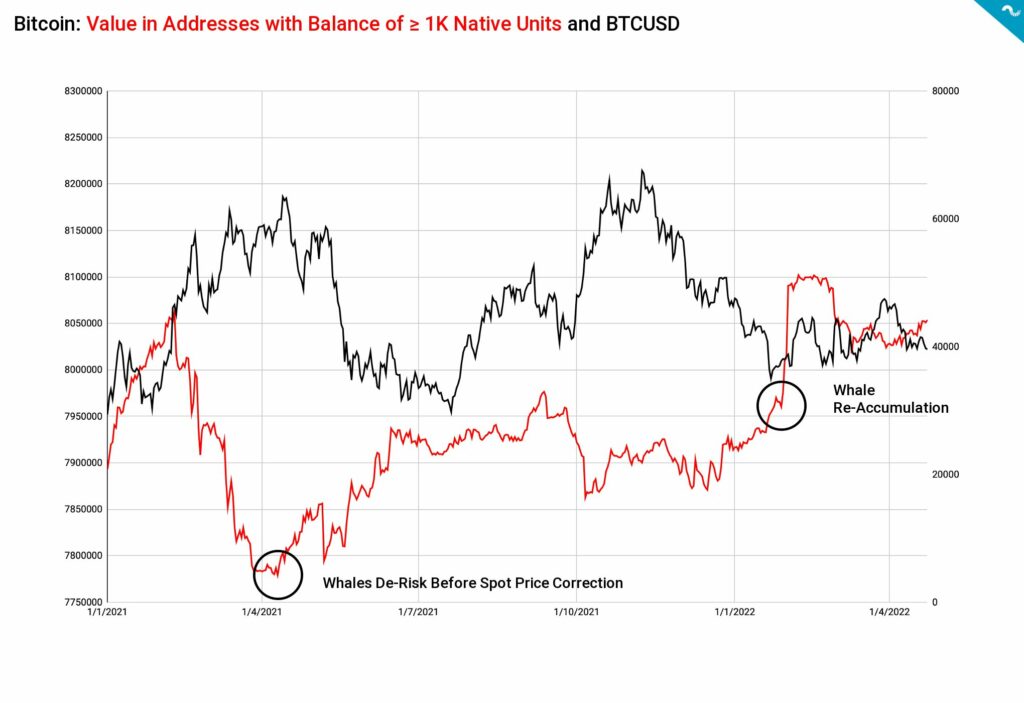
Whales in Accumulation Mode Despite The Market Uncertainty
The crypto asset markets are heavily influenced by whales, who by the common definition own at least 1000 native bitcoin units. Whales are known to make smart entries and exits compared with the retail investor segment and many analysts try to interpret their behavior.
Looking back at the year 2021, whale activity heavily increased in the parabolic spot price advance of quarter one (Q1). The amount of native bitcoin units in whale addresses peaked in early February 2021 at 8,06 million BTC. Then the whales started a sudden de-risk campaign, reducing their exposure to 7,78 million units in mid-April. This means that whales front-runned retail again and anticipated the overheated market and subsequent correction in May. The whales de-risked well before May’s huge spot correction.
The whales started to accumulate against falling spot price during summer of 2021 and continued buys until late September. In early October whales de-risked mildly and have continued to buy again in early weeks of 2022. Whales are currently in re-accumulation mode, despite the heavily weakening spot price.
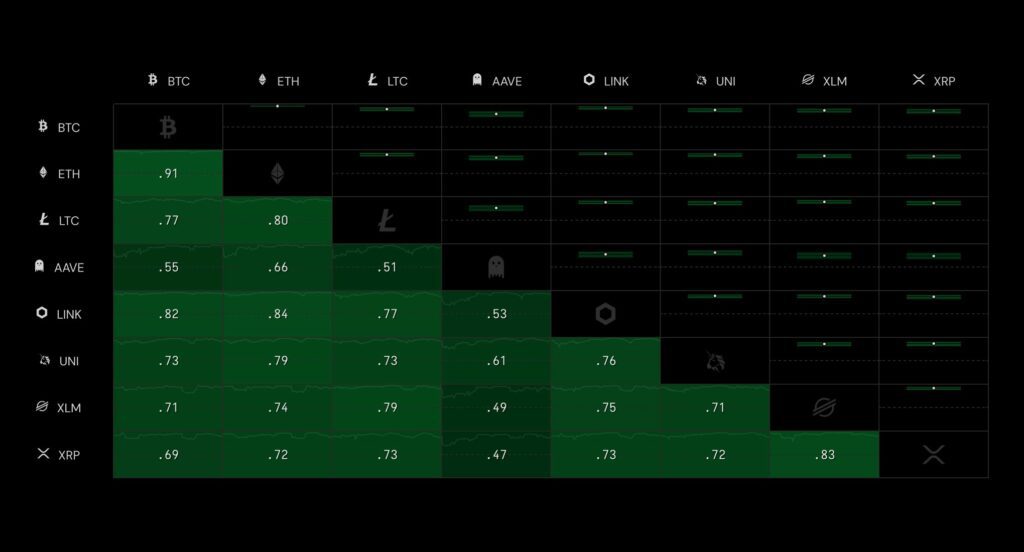
Bear Cycle Drives Correlations Towards One (1)
While the 90-day Pearson correlation of Bitcoin and S&P 500 is at all-time highs, the cross-asset correlation of cryptocurrencies remains even higher. The 30-day correlation between leading cryptocurrency Bitcoin and DeFi platform Ethereum is at 0,91, indicating an exceptionally close relationship. The correlation between legacy cryptocurrencies is between 0,70-0,8, with Aave being an exception.
What Are We Following Right Now?
A deep dive into stagflation, reflation, and inflation with Andreas Steno Larsen, Alfonso Peccatiello, and Lyn Alden.

End game for weak national currencies continues.
A comprehensive Bitcoin data set by Coin Metrics.