The TA of week 20 explores Bitcoin’s recent bearish price action and eight weekly red candles. Additionally we examine price projections, MVRV, and other metrics.
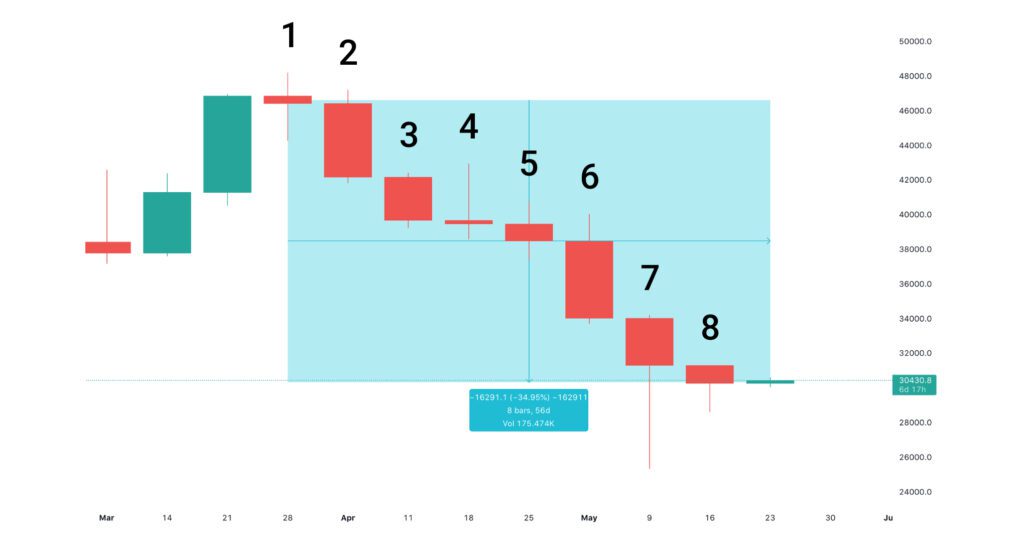
Bitcoin Has Printed Eight Consecutive Weekly Red Candles
While bitcoin has only weakened -2,5 percent within last seven days, it has now generated eight weekly red candles between late March and May. The eight weekly red candles are a historical occasion for Bitcoin as this anomaly has never happened before.
U.S. Dollar Index (DXY) offered some momentary relief for bitcoin by weakening -2,02% within last seven days. A strong DXY has been bearish for bitcoin and weak bullish, vice versa. Although we’ve seen countless “Dollar End Game” narratives during recent years, USD still seems to hold its position as the global reserve currency. Asian hours were stronger that U.S. hours during week 20, indicating some eastern buying pressure.
The uncertain macro environment continues to scare investors. While the war in Ukraine is terrible per se, its multiplicative effects still remain unknown. The Economist recently estimated that Ukraine’s crisis might generate a wider food shortage and consequently starve countries like Egypt, Bangladesh, Turkey, Yemen, and Lebanon. Inflation is already getting out of hand in emerging countries as Sri Lanka’s inflation has reached 40% YoY.
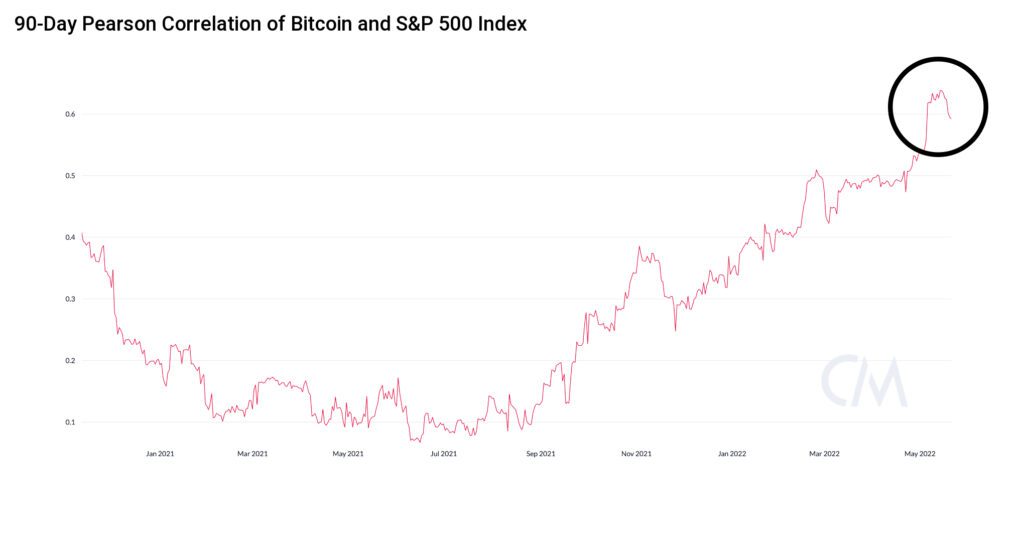
Bitcoin’s correlation with the S&P 500 Index is currently at 0,59, which is a -7,2% decrease from 0,64 of last week. Fortunately Bitcoin’s correlation with technology stocks is expected to decrease when more speculative money capitulates and exits the market.
Ethereum has weakened -3,6% in the wake of Bitcoin, however some decentralized finance tokens like AAVE (9,4%) and UNI (8,9%) have managed to stay more afloat. Nevertheless we have to remember that these more speculative tokens have dropped dramatically more than Bitcoin and Ethereum on year-to-date basis.
7-Day Price Performance
Bitcoin (BTC): -2,5%
Ethereum (ETH): -3,6%
Litecoin (LTC): +1,5%
Aave (AAVE): +9,4%
Chainlink (LINK): -4,8%
Uniswap (UNI): +8,9%
Stellar (XLM): -5,5%
XRP: -5,2%
– – – – – – – – – –
S&P 500 Index: -3,05%
Gold: -1,93%
– – – – – – – – – –
Bitcoin’s 90-Day Pearson Correlation with S&P 500 Index: 0,59
Bitcoin RSI: 41
What Are The Most Plausible Bitcoin Price Projections?
Amid the significant spot price weakness it’s good to zoom out and take a longer perspective. Bitcoin’s 2017-2020 point of control (POC) (green) was formed between $4000 and $20K, and it culminated to parabolic advance in late 2020. In 2021 the spot price increased from $30K to almost $70K as bitcoin formed its double top structure (pink). Now bitcoin is approaching sub $30K price levels that are well in the “Deep Value Zone” (blue), as described by analyst Lyn Alden.
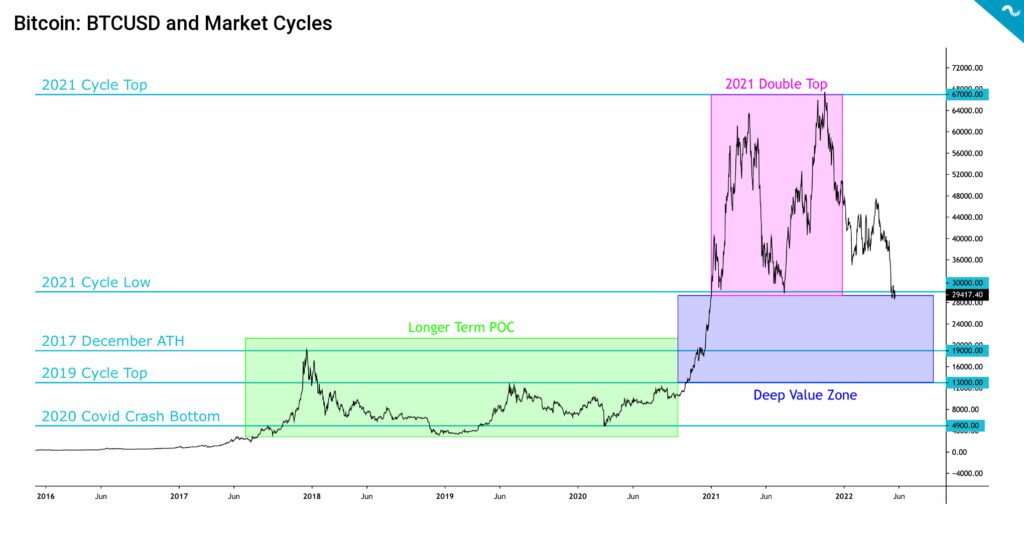
The Deep Value Zone obviously represents heavy buying opportunity and the current bitcoin price is in buy territory. Bitcoin’s price scenarios can be divided into three categories based on the market outlook. If we assume that stock market will continue its moderate decline, we can expect bitcoin to settle somewhere between $27K-$30K range. If we expect macro downwinds to continue, bitcoin might drop to $20K range, which is close to 2017 cycle top. Should macro factors drive prices lower, we could expect bitcoin to drop well under $20K, even to $15K range.
1. Moderate Decline: $27K-$30K
2. Macro Downwinds Continue: $20K-$27K
3. Black Swan Scenario: $15K-$20K
Bitcoin Dominance at Highest Level in 2022
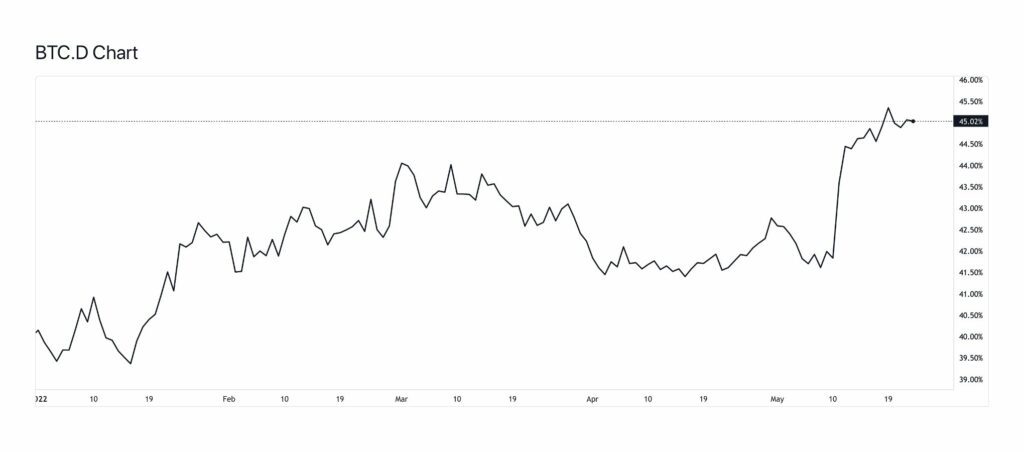
Bitcoin dominance recently reached 45 percent, a highest level in 2022. The dominance is growing in correlation with altcoin and DeFi token capitulation as the liquidity flows back into Bitcoin. The digital asset markets are mimicking traditional markets, because Bitcoin can be seen as the “dollar” of cryptoassets. Bitcoin is the last reserve cryptocurrency and a bridge to other markets.
Bitcoin’s dominance has been volatile during recent years, staying in 60-70% range from mid-2019 to early 2021. In the double top bull cycle of last year, the dominance gradually started to weaken, dropping from January 70% to December 40%. Nevertheless dominance has been able to recover and is now on its trajectory towards 50%.
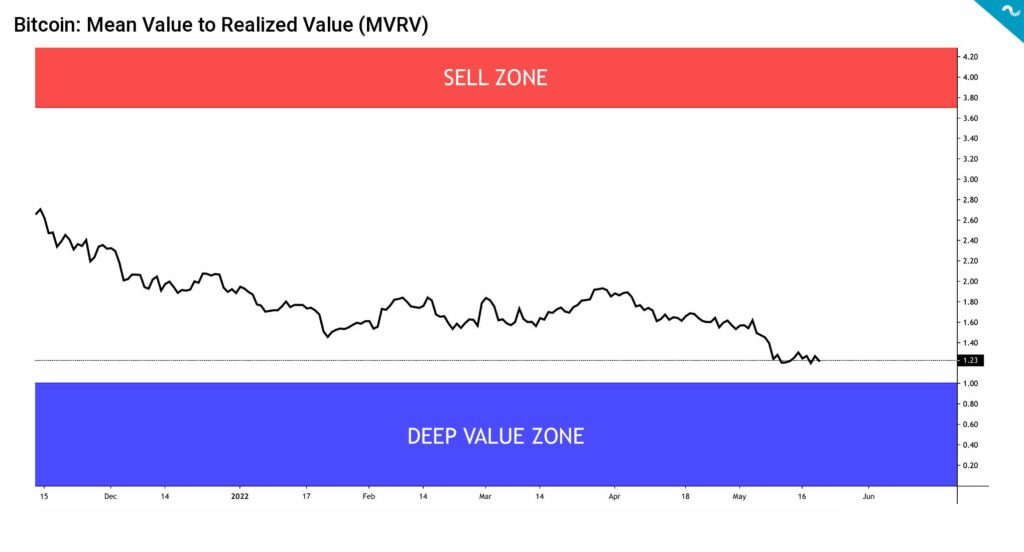
Bitcoin’s Mean Value to Realized Value (MVRV) Indicator Approaches Deep Value Zone
Despite the bearish macro environment and technical indicators, bitcoin’s on-chain data offers some relief. Mayer Multiple indicator is currently at 0,66, marking the lowest value since the Covid-induced crash of March 2020. There are also signs of institutional accumulation as Canada’s Purpose Bitcoin ETF saw an inflow of 6900 bitcoin units during the spot price decline.
Another bullish signal is coming from MVRV indicator, which is quickly approaching the buy zone of below one (< 1). The buy zone, or here described as Deep Value Zone (blue), marks a definite area for smart money accumulation. Institutional appetite will certainly grow as Bitcoin reaches lower levels and they’ll likely implement dollar-cost averaging (DCA) strategies to obtain cheap coins.
MVRV, or Market Value to Realized Value, was firstly developed by David Puell and Murad Mahmudov in early October 2018. The Puell Multiple indicator used in technical analyses is also named after David Puell. MVRV is calculated by dividing the market cap by realized cap and it’s a good instrument for estimating if market participants are in profit or not. Bitcoin is generally considered as overvalued when MVRV exceeds 3,7 and undervalued when it’s below 1.
MVRV Sell Zone: > 3,7
MVRV Buy Zone: < 1
What Are We Following Right Now?
Quantitative Tightening (QT) is here, combined with commodity scarcity.
Another must-read
— The Passenger (@gordonschuecker) May 1, 2022
9 Commodity Chokepoints and QT
(1) neon gas
(2) neon transportation
(3) NG
(4) oil boycott
(5) VLCC shortage
(6) VLCC fleet overtake
(7) Strait of Hormuz
(8) QT (quantitative tightening)
(9) SLR (Statutory Liquidity Ratio)
1/9https://t.co/E4gf4kdikn pic.twitter.com/9OzSlzhO43
Multiple Bitcoin industry thought leaders are attending the Oslo Freedom Forum. Can Bitcoin reach a billion people with Lightning Network (LN)?
Can Bitcoin reach a billion people?
— calle ⚡ (@callebtc) May 23, 2022
Yes, with Lightning it can.@OsloFF #OsloFF @HRF pic.twitter.com/h5NSw20FIf
Ticket sale for BH2022 Bitcoin conference has officially started.
Ticket sale for Baltic Honeybadger 2022 has started!🦡
— Hodl Hodl (@hodlhodl) May 6, 2022
A few hours after the sales launch, we have already sold all Early Bird or 15% of all tickets.
Best price now: https://t.co/oFpnjSPBcB pic.twitter.com/Kq1fc6ZSUv

