


The TA of week 22 focuses on the price predictions of Arthur Hayes and recent technical indicators. Additionally we take a deep dive into market cycle structures, halving-derived price estimates, and whale accumulation.
Arthur Hayes Sees an Upcoming Cycle Bottom
The digital asset market was propelled into relief rally during week of 22, despite the raging bearish sentiment. However the relief rally quickly shifted back to slight decline in early week 23. The leading cryptocurrency Bitcoin is down 6 percent in 7-day timeframe, while Ethereum’s performance has weakened -11%. The relief rally provided volatility to DeFi platforms like Aave (AAVE) and Chainlink (LINK), granting them double-digit spot price increases and decreases.
Many investors are currently wondering if this is a local bottom or could we be still heading lower? Arthur Hayes, founder of BitMEX exchange, has been expressing positive views on the market amid the Terra meltdown. Hayes mentiones Bitcoin is showing notable resilience while absorbing the 80 000 bitcoin units sold by Luna Foundation Guard (LFG). Arthur sees $25K-$27K Bitcoin as the bottom of the current cycle.
At the bottom, a typically impervious strong hand can be forced to sell because of uneconomical arrangements festering in their trading books. The LFG is such a seller. To puke 80,000 physical Bitcoin is quite a feat. After contemplating the nature in which these Bitcoins were sold, I am even more confident that the $25 000 – $27 000 zone for Bitcoin is this cycle’s bottom.
Arthur Hayes
Bitcoin has been particularly correlated with the stock market this year, however there are signs of emerging decoupling. While Bitcoin’s correlation with technology index Nasdaq Composite soared past 0,8, its correlation to S&P 500 Index peaked at 0,67 in mid-May. Since then the stock market correlation has weakened -13 percent from 0,67 to current 0,58, showing weakening relationship. We expect Bitcoin to eventually decouple from mainstream market as the amount of speculative money decreases.
7-Day Price Performance
Bitcoin (BTC): -6,1%
Ethereum (ETH): -11%
Litecoin (LTC): -10,3%
Aave (AAVE): -15%
Chainlink (LINK): +3,5%
Uniswap (UNI): -8,7%
Stellar (XLM): -3,3%
XRP: -5,9%
– – – – – – – – – –
S&P 500 Index: -0,26%
Gold: -0,11%
– – – – – – – – – –
Bitcoin’s 90-Day Pearson Correlation with S&P 500 Index: 0,58
Bitcoin RSI: 46
– – – – – – – – – –
Important Dates
9.6: ECB Rate Hike Decisions for Europe
10.6: CPI Numbers
15.6: FOMC Meeting. Hikes, QT and Macro
Bitcoin Has Been in Bear Market for > 200 Days
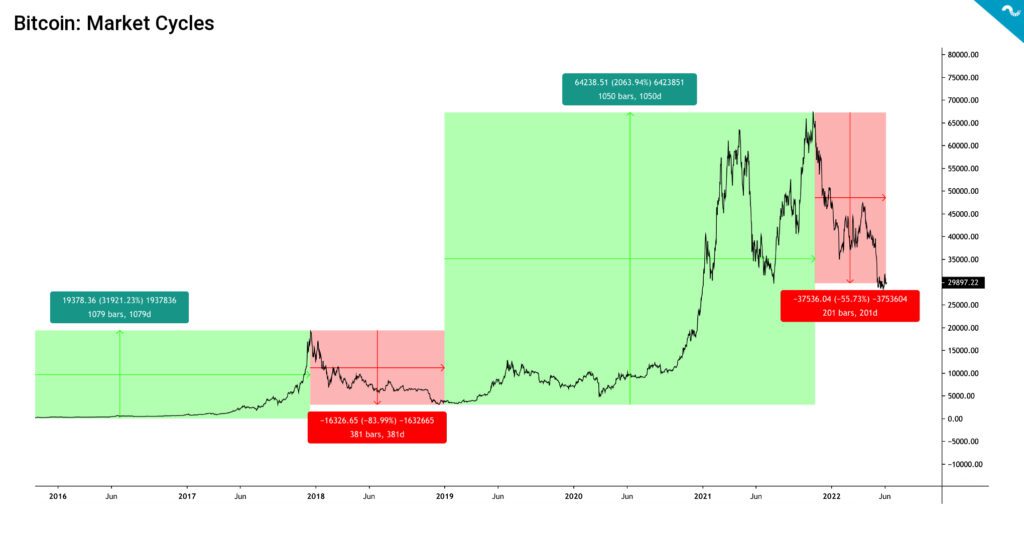
In a longer term perspective the current bear cycle has lasted 201 days and bitcoin is consequently bitcoin down -56 percent from its November 2021 peak. If we look at the bear market of 2018 (red, left) it technically lasted over a year, spanning over 380 days. It was followed by a multi-year bull cycle (green, right) that uplifted bitcoin over 2000% into the double top peaks of last year. Despite of all this, the cycles are now said to be shorter and bitcoin might correct up sooner if the challenging macro environment permits.
Markets Waiting for CPI Data
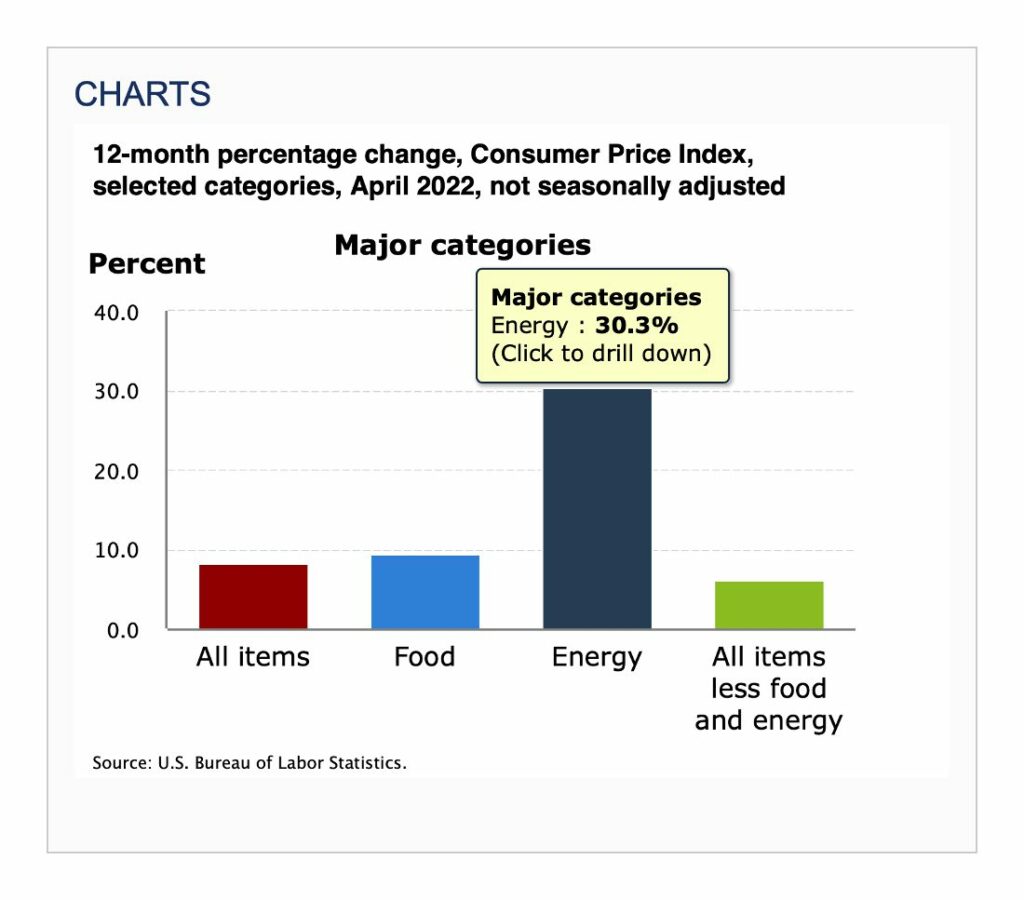
The markets are now waiting for the publication of new Consumer Price Index (CPI) data on June 10th. The April’s data showed huge increase in energy category, which has increased 30,3% from 2021. While analyst Andreas Steno Larsen estimated that inflation has already peaked in United States, EU-related inflation might still be on upward trajectory. CPI is forecasted to be 8,2% and markets will probably process the data flowingly:
CPI > 8,3% = Bearish
CPI 8 – 8,3% = Neutral
CPI < 8% = Bullish
Are Halving Cycles Driving The Prices?
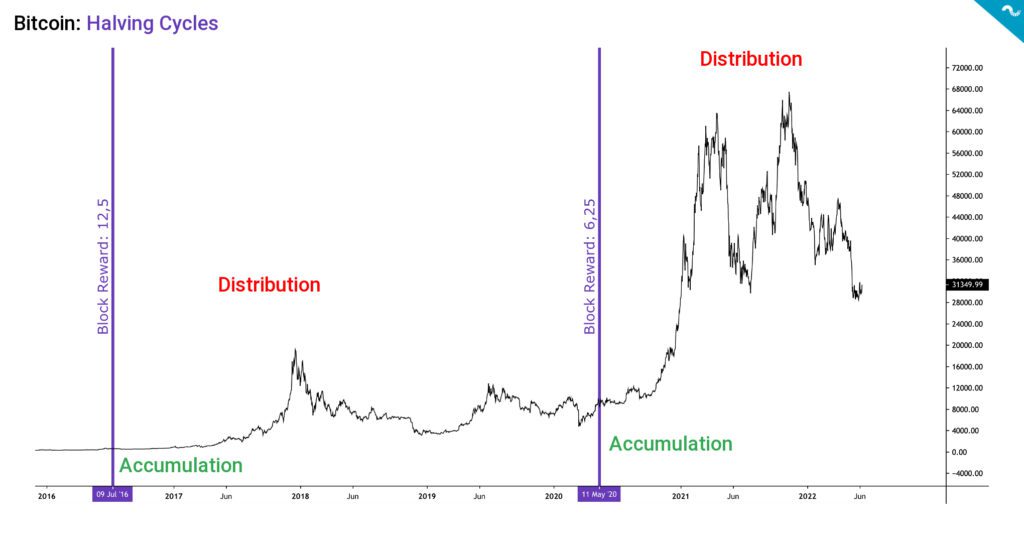
Bitcoin’s halving essentially means the split of the payout of a new block. The halvings have been a fundamental factor for Bitcoin as they incrementally increase Bitcoin’s scarcity. The Block reward was reduced to 25 in 2012, 12,5 in 2016, and 6,25 in 2020. With the upcoming halving in 2024, the block reward will be further reduced to 3,125.
When looking at the embedded chart, the last two halvings in 2016 and 2020 (purple) have occured during accumulation cycles (green) and acted as triggers to distribution phases (red). The spot price increased 1238,59 percent between halvings of 2016 and 2020. If we use the previous halving cycle as a reference, bitcoin could rise to 117 162 USD by the halving moment of 2024.
LTH-SOPR Data Near Capitulation Levels
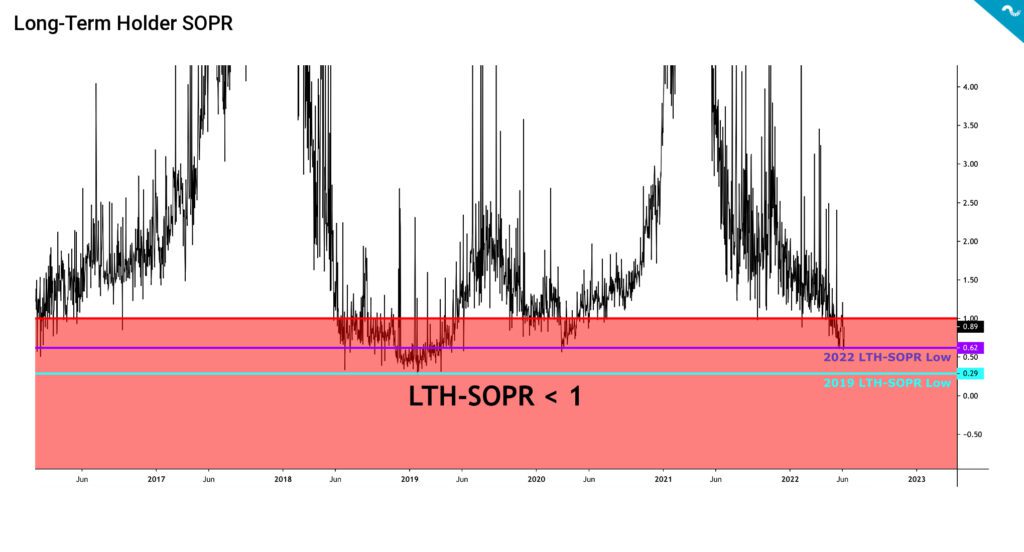
The SOPR indicator, originally created by Renato Shirakashi, is calculated by dividing the realized value (USD) by the value at creation of the output. SOPR indicator is usually divided into Short-Term Holder SOPR (STH-SOPR), and Long-Term Holder SOPR (LTH-SOPR). Or more simply: Price sold divided by price paid. SOPR indicator can be interpreted by following logic:
SOPR > 1 = Sellers at a Profit
SOPR < 1 = Sellers at a Loss
By looking at the recent data we can see how the commitment of Long-Term Holders is weakening and LTH-SOPR has dropped to 0,62 (purple). By each spot price drop the LTH-SOPR starts to approach 2019 low of 0,29, and that would be the ultimate bottom signal. Somewhat counter-intuitively a capitulation event would actually be healthy for the market. In 2019 the market recovered quickly from its $3K capitulation point to June’s $13K.
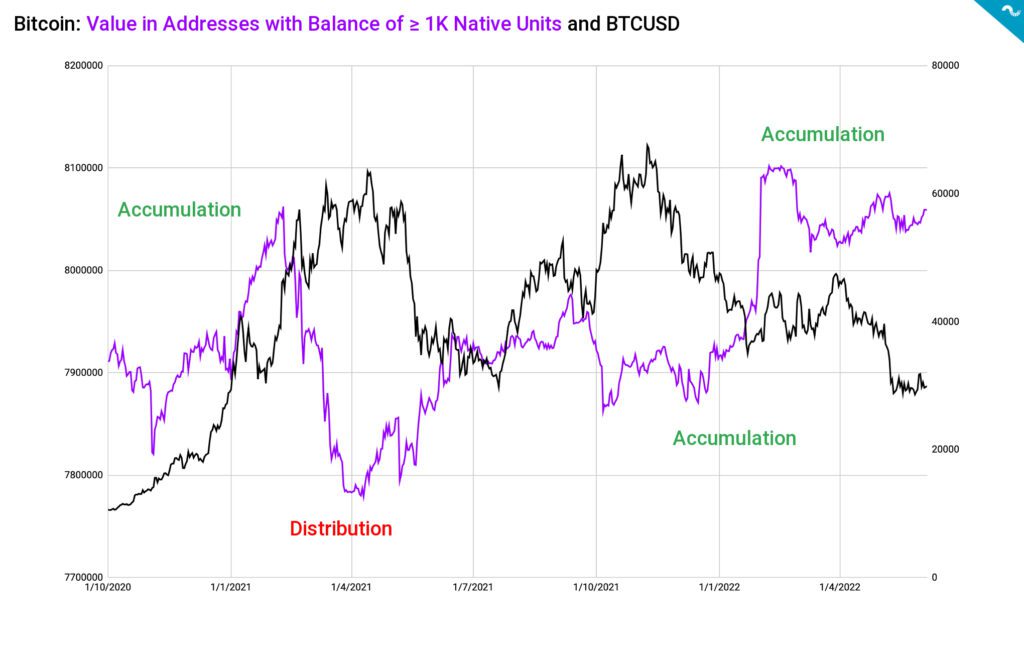
Whale Accumulation Still Persisent
The cryptoasset markets are heavily influenced by whales, who by the common definition own at least 1000 native bitcoin units. Whales are known to make smart entries and exits compared with the retail investor segment and many analysts try to interpret their behavior.
The whale activity from Q4 2020 can be divided into three epochs:
Accumulation in Late 2020 and Early 2021
Distribution During Spring 2021 Sell-Off
Accumulation in Late 2021 and Early 2022
Whales seem to effectively analyze the market and they have been successful at front-running other investor segments. In late 2020 and early 2021 whales accumulated heavily in parallel to the rising spot price, however they started to de-risk heavily just before the large correction in May 2021. After the heavy distribution phase of spring 2021, the whales have been accumulating coins and countering the market when possible.
What Are We Following Right Now?
Analyst Lyn Alden and Peter McCormack discuss macro markets, inflation, demand & supply challenges, geopolitics, and obviously Bitcoin.

Mike McGlone of Bloomberg Intelligence thinks that once the bear market in risk assets subsides and valuations recover again, cryptocurrencies will outperform all other asset classes. He also forecasts a “Great Reversion”.

Michael Kao, retired hedged manager and private investor, attends a wide-ranging conversation on liquidity, energy markets, cryptocurrency, and convertible bond arbitrage.

The amount of Bitcoin investors holding unrealized losses is increasing. Just 2,2 percent of short-term holders are in profit.