


The crypto market was absolutely crushed at the turn of week 23 and 24, leading to Bitcoin falling more than 20 percent from $30K level into $23K level. The sell-off stems from general economical and geopolitical uncertainty, which is leading investors to de-risk further away from cryptoassets. Additionally the meltdown of Terra ecosystem and the recent cease of withdrawals by Celsius Network have generated massive amount of FUD (fear, uncertainty, and doubt). Celsius recently halted all withdrawals amid its alleged liquidity crisis due to $500 million TerraUSD (UST) exposure. The platform was previously considered as one of the DeFi success stories and it’s backed by institutional investors like pension fund Caisse de dépôt et placement du Québec (CDPQ). The $327 billion Canadian pension fund reportedly invested $150 million into Celsius in 2021.
Even the large crypto exchange Binance experienced problems with its platform and thus momentarily paused all Bitcoin withdrawals. The exchange announced “stuck on-chain transaction” as a reason for the pause, however some analysts speculated the exchange wanted to curb general panic selling. Binance later resumed its operations to normal state.
While an estimated amount of $500 million worth crypto of derivative contracts were liquidated in 24 hours between Sunday and Monday, the equities market doesn’t look that much happier. Analyst Andreas Steno Larsen was worried about the growing EU area inflation as ECB reported its “only aim” is to bring inflation figures back to target. The central bank sector seems to be in a state of disarray as ECB moves towards quantitative tightening (QT), meanwhile they might still need to continue quantitative easing (QE) in order to support states like Italy and Greece. Steno Larsen previously estimated that the U.S. inflation might have peaked, while inflation in European Union would still grow. He also pointed at a huge disconnect between consumer sentiment and equity valuations.
Altcoins Down, Bitcoin Resilient as Usual
Bitcoin has now weakened -21,5 percent in past seven days, while the leading decentralized finance (DeFi) platform Ethereum has dropped over -30%. As usual, the higher beta DeFi tokens have suffered more, leading to lending platform Aave weakening over -40%. The leading stock market index S&P 500 has weakened -8,36% over the week, erasing $9,3 trillion from its market cap since January 3rd. Gold spiked during the growing uncertainty, sementing its narrative as a Store-of-Value (SoV) asset. I’ve personally been accumulating gold in parallel to Bitcoin using the Paxos Gold (PAXG) gold-backed token. The PAXG token can be purchased via our coinmotion wealth Service.
7-Day Price Performance
Bitcoin (BTC): -21,5%
Ethereum (ETH): -31,6%
Litecoin (LTC): -29,9%
Aave (AAVE): -42,5%
Chainlink (LINK): -23,2%
Uniswap (UNI): -27,8%
Stellar (XLM): -23,7%
XRP: -19,9%
– – – – – – – – – –
S&P 500 Index: -8,36%
Gold: +1,08%
– – – – – – – – – –
Bitcoin’s 90-Day Pearson Correlation with S&P 500 Index: 0,59
Bitcoin RSI: 34
– – – – – – – – – –
Important Date(s)
15.6: FOMC Meeting. Hikes, QT and Macro
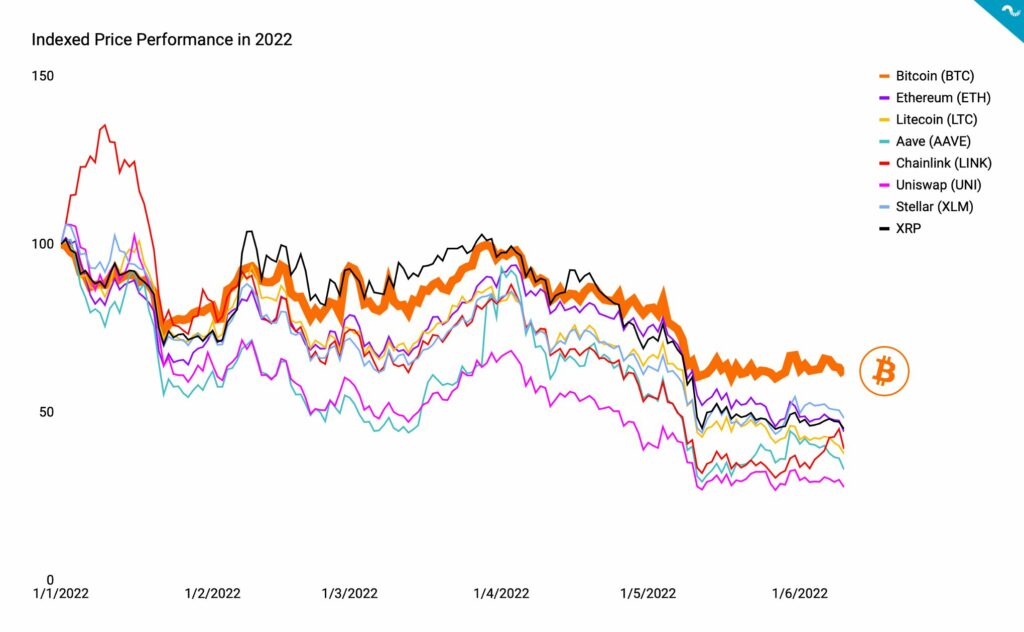
As the indexed price performance chart shows, Bitcoin has been truly resilient amid the DeFi-induced market correction. While the leading cryptocurrency is down -38,88 percent year-to-date, the dominant DeFi platform Ethereum has weakened -55%. The native token of decentralized exchange Uniswap (UNI) has crashed -72,3% since January. In this reference group Bitcoin truly shows why its called the “Digital Gold” among the cryptoassets. Additionally the Bitcoin dominance index recently grew to 48%, marking highest point in 2022. Escalating Bitcoin dominance shows how the liquidity is escaping towards the digital reserve asset.
Cryptoasset YTD Perfomance
Bitcoin (BTC): -38,88%
Ethereum (ETH): -55,8%
Litecoin (LTH): -62,36%
Aave (AAVE): -67,04%
Chainlink (LINK): -60,91%
Uniswap (UNI): -72,3%
Stellar (XLM): -51,76%
XRP: -54,96%
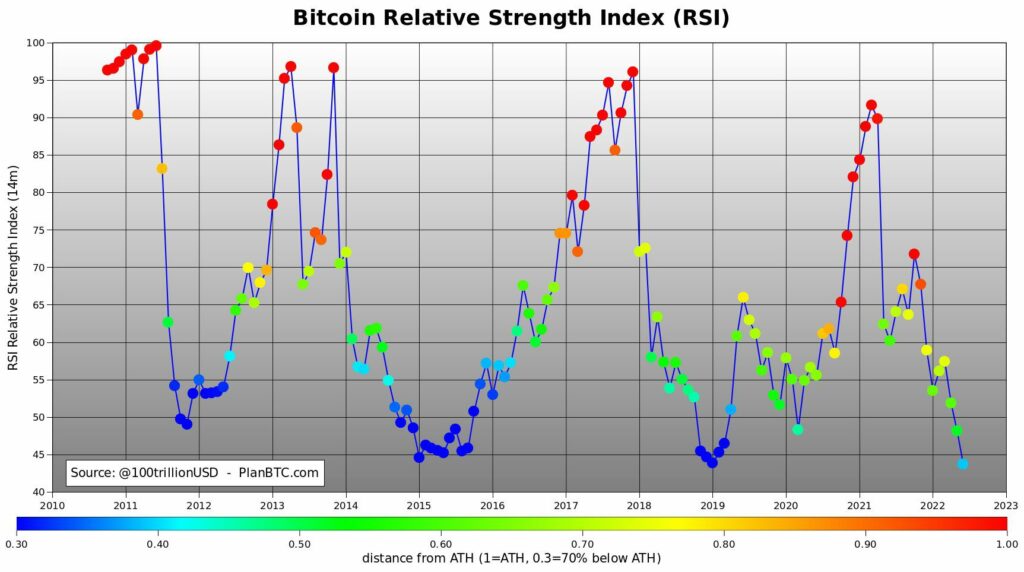
Bitcoin’s monthly Relative Strength Index (RSI) has dropped to its lowest level ever, diving into 43,7 on Monday. The RSI bottom of last macro cycle occurred in January 2019 at 43,9, while January 2015’s bottom touched RSI of 44,6. The particularly low RSI indicates buying opportunity, especially for DCA buyers.
Ethereum in a Freefall
Ethereum is down -31,6 percent from last week and -55,8% year-to-date, deeply underperforming its crypto rival Bitcoin. So why is Ethereum tanking so heavily? First of all Ethereum is the mother platform for many decentralized finance protocols, and e.g. Celsius’ CEL token is using Ethereum’s ERC-20 technical standard. As the DeFi sector has undergone a massive stress test recently, investors are looking to reduce their exposure. Lido’s stETH generated some additional FUD last week as it was about to depeg from Ethereum’s native token Ether.
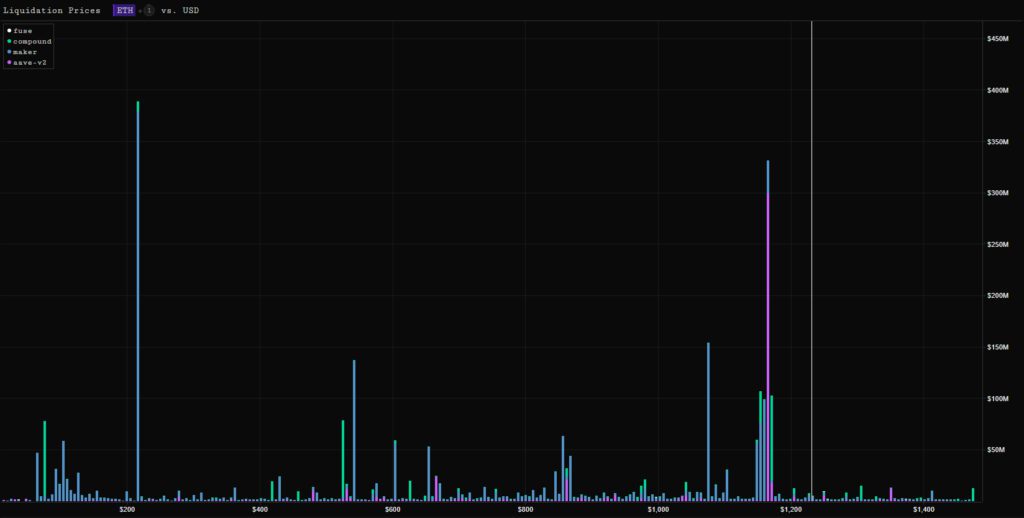
As Ethereum falls further down, it’ll draw more liquidations on the way. The liquidation price chart shows the most liquidations being in $1000 – $1200 range as Ethereum now loiters around $1200. The $1000 level will be essential for Ethereum, as breaking it would mean even more massive selling pressure. Traders are trying to hedge themselves and in a scenario of sudden downward movement and some OTC dealers might have to capitulate.
Coinbase Shows Institutional Selling Pressure
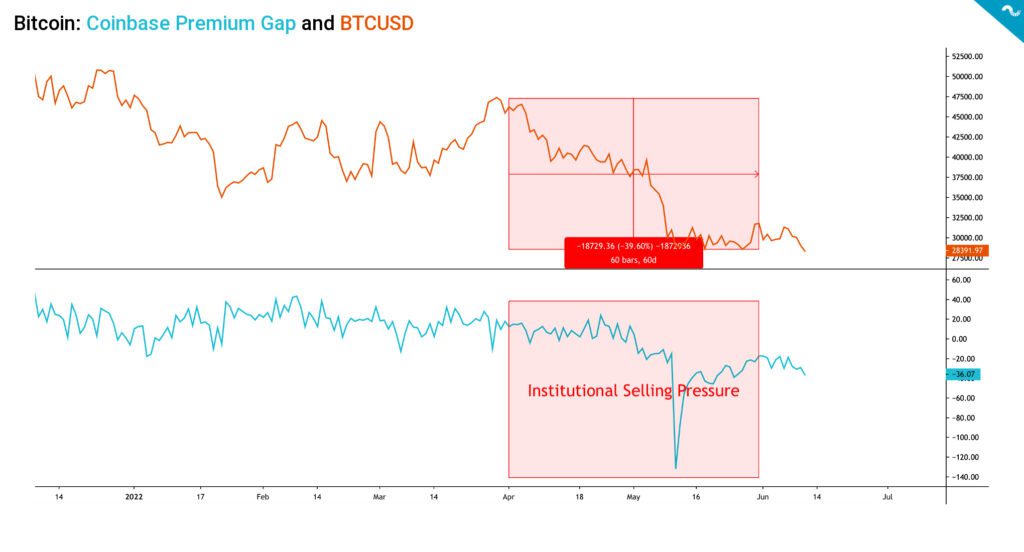
Coinbase is the only publicly traded Crypto exchange in the world (ticker: COIN), making it probably the most legally transparent exchange among all, a characteristic which attracts the American institutions and high-net-worth individuals. The embedded charts uses Coinbase Premium Gap, which is the Bitcoin price gap between Coinbase Pro and Binance.
The fresh data shows how Premium Gap has collapsed from April’s 20 level into May’s bottom of -130. Premium Gap quickly recovered from May lows, however it found a new negative consolidation area between -40 and -20. The negative Premium Gap indicates an ending bull cycle, which spanned from 2020 to 2021. Yet again the radically weakening spot price offers accumulation opportunities for smart money.
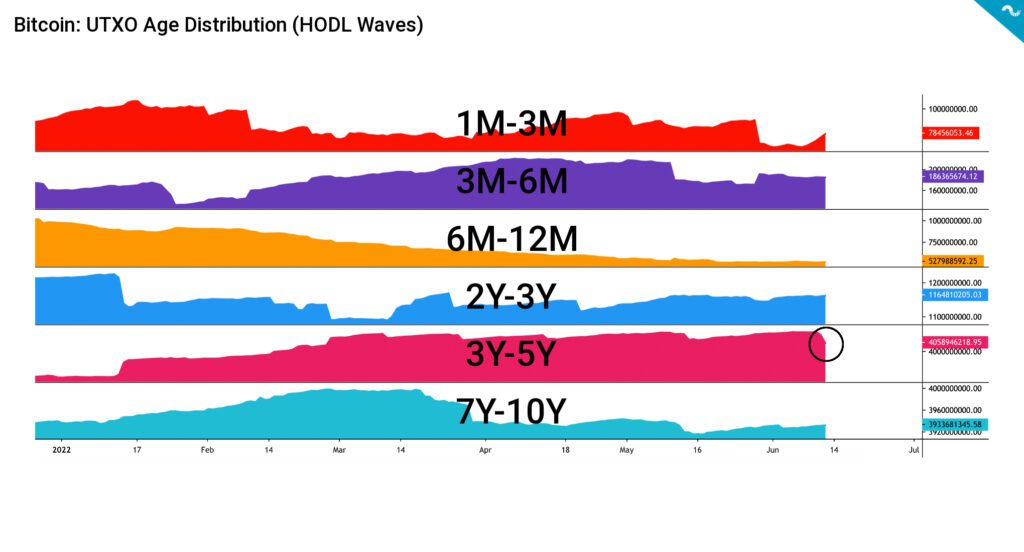
UTXO HODL Waves Show Accumulation in 2Y-3Y Wave
Satoshi Nakamoto originally designed Bitcoin as a transparent network. The transparency allows researchers to deeply explore the network and its UTXO structure. UTXO Age Distribution, or more commonly known as HODL Waves, presents a macro view of Bitcoin investor behaviour. The UTXO data can be analyzed by dividing the HODL Waves into six segments. Here’s a rough estimate on each HODL Wave’s trend:
1M-3M: Accumulation After Sell-Off
This wave represents short-term investors and traders. These market participants reduced risk in early 2022 after spot price collapse. They accumulated more coins from March to May, however June presented a capitulation phase. The retail investor sentiment remains highly uncertain.
3M-6M: Trending Sideways
This wave represents relatively short-term investors. They have been de-riskin during spring and the sentiment remains uncertain, but steady.
6M-12M: Selling Pressure
This wave represents medium-term investors, they have been reducing exposure since the inflection point of November 2021. They will likely return when spot price climbs again.
2Y-3Y: Accumulation
This wave represents long-term investors and institutions, they de-risked in March but continued to accumulate since then.
3Y-5Y: Emerging Selling Pressure
This wave represents long-term holders, who have been accumulating since early 2022. However we can see some selling pressure during past couple of weeks.
7Y-10Y: Diamond Hands
This wave represents particularly long-term investors, their attitude towards the market remains relatively unchanged.
What Are We Following Right Now?
Bitcoin has been declared “dead” more than 400 times during its history.
The Skybridge Capital founder Anthony Scaramucci said the company had bought the dip.
Andreas Steno Larsen, Alfonso Peccatiello, and Jesse Felder discuss macro. Felder argues that a strong dollar, severe interest rate spikes, and surging commodity prices indicate that a deep earnings recession is on the horizon.

Was Terra meltdown an insider job?
Can European Central Bank cease its quantitative easing (QE) program?