
The technical analysis of week 42 explores Bitcoin’s active supply, related UTXO data, and how to use them to interpret markets.
When Satoshi Nakamoto created Bitcoin, he built a structure that required a significant amount of work (PoW), unlike traditional currencies that can be minted from thin air. In contrast to traditional currencies, the Bitcoin blockchain is also transparent, allowing anyone to see what’s happening under the surface. This transparency allows us to examine the active supply and unconfirmed transaction output, called UTXO. The active supply metric tracks the fraction of supply active in the trailing period specified, allowing for interpretation of how active given cryptocurrency tranches are.
You can examine the UTXO data in detail here: plotly.com/~oinonen_t/81/.
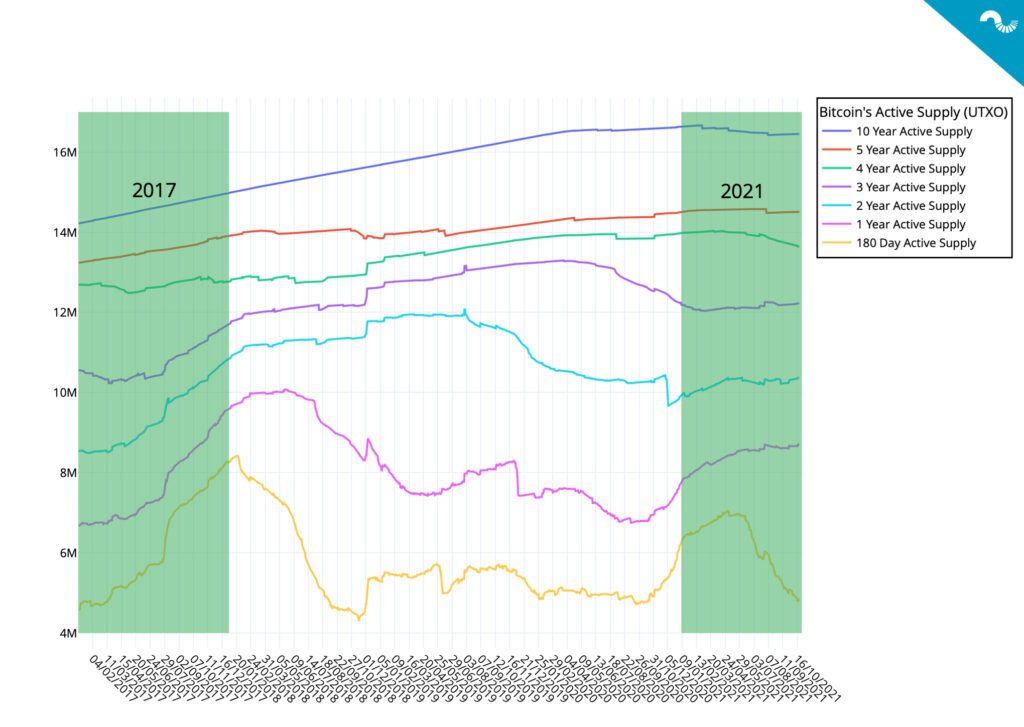
Active supply data has been used to successfully forecast BTCUSD price action, as showcased by Delphi Digital in 2019. Delphi was able to use UTXO metrics to precisely time the early 2019 weakening selling pressure, market bottom, and following bull cycle. Let’s take a closer look to active supply data indicators between 180 day and 10 year supply.
10 Year Active Supply
The longest active supply in this data set has been growing from 2017 to 2020, slightly decreasing in 2021. The steady trajectory of ten year active supply mirrors the confidence of long-term investors towards bitcoin, although some recent selling pressure has been emerging. Ten year active supply can also used to reflect lost native bitcoin units.
5 Year Active Supply
Like the ten year active supply, the five year metric shows the lasting dedication of long-term investors. 5 year supply slightly descended during the bear cycle of 2018, but has been growing since.
4 Year Active Supply
As the 10Y and 5Y active supplies, four year active supply has been highly resilient over time. Slight selling pressure can be seen in the second half of 2021.
3 Year Active Supply
Three year AS was correlated with higher active supplies from 2017 to 2020. The indicator shows selling pressure in 2020-2021, however cautiously bullish signs can be seen in later 2021.
2 Year Active Supply
The two year AS category experienced a sell-off in 2019-2020, however 2021 trend looks promising.
1 Year Active Supply
Like the two year active supply, one year band sold off in 2019. Accumulation seen from 2020 onwards.
180 Day Active Supply
Six month and younger active supplies mirrored significant selling pressure in 2018 and never truly recovered since. The sell-off resumed in May this year. 180 day active supply reflects the uncertainty of new investors versus confident long-term bitcoin holders.
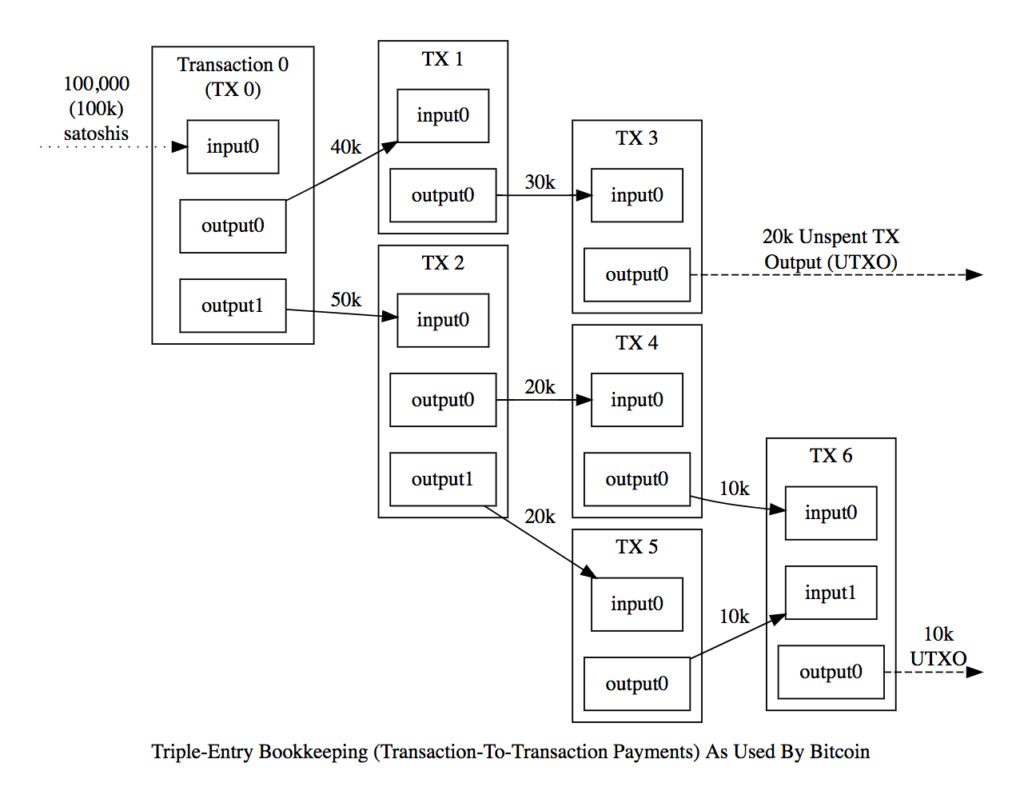
What The UTXO Means?
UTXO, or unspent output from bitcoin transactions, offers significant possibilities for analysing the cryptocurrency market. Within the bitcoin blockchain, every transaction creates a new UTXO, and the certain age of UTXO indicates the block that the transaction was firstly included in. UTXO data can be utilized to track buying, and selling patterns in the previous, current, and upcoming market cycles.
A drop in cumulative UTXO age usually correlates with increase in bitcoin selling pressure. A rise in cumulative UTXO age represents more holding in the market, as smart investors typically accumulate when price decreases.
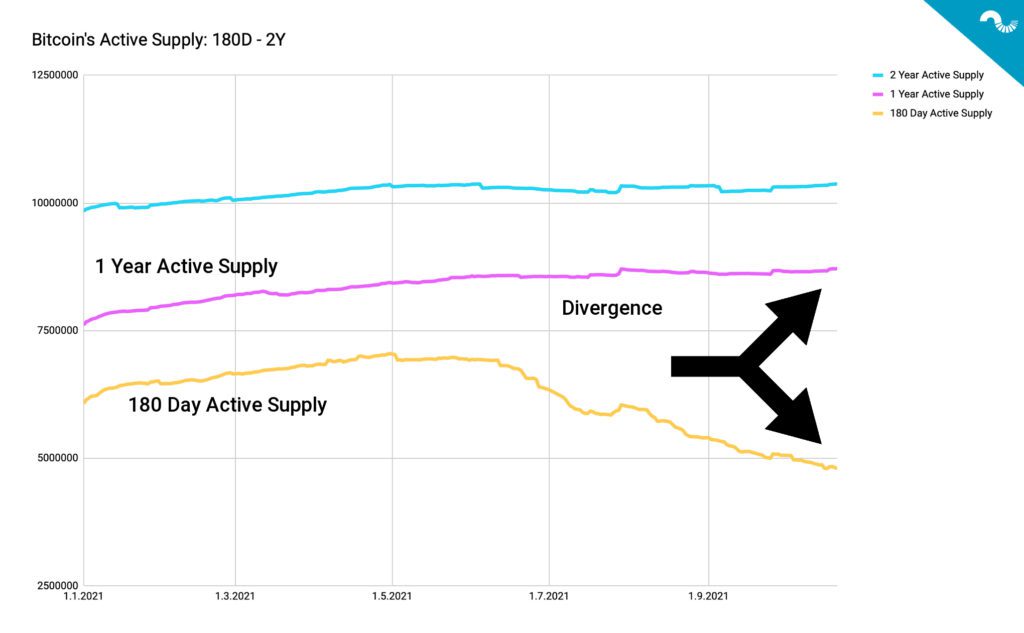
An Inflow of Long-Term Holders
As previously mentioned, the active supply data reflects the divergence of long-term bitcoin holders and short-term traders. Long-term holders have a tendency to keep their native units in cold storage and possibly off-exchange, while shorter term investors quickly liquidate their positions. The bitcoin active supply data from 2021 confirms this thesis, showing growth in one and two year active supplies and decline in 180 day active supply. The divergence is clearly shown in the embedded chart.
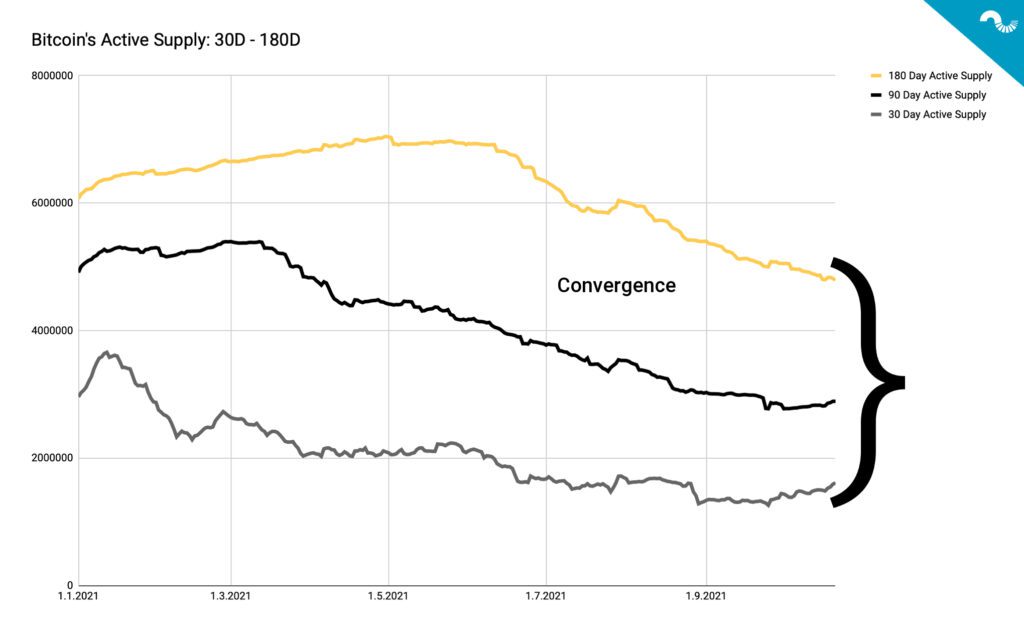
Selling Pressure from Short-Term Investors
180 day active supply and shorter supply bands have been correlated across 2021, forming a downward trajectory. This trend once again proves the market is diverging into two segments: Holders and short-term traders. The growing amount of holders is a positive sign for bitcoin and indicates a maturing asset class.