


The technical analysis of week 49 scans the declining spot market, correlations, derivatives market, and a selection of additional exotic metrics.
Digital assets continued their slide as an aftermath of the heavily deleveraged futures market. During the last weekend approximately $2,09 billion worth of long future contracts were liquidated as market suddenly corrected from $58K level to current $49K level. This drop equals to 10 000 USD decrease in bitcoin’s spot price. During the last 30 days bitcoin has weakened -24,3 percent, however the leading decentralized finance platform Ethereum only dropped -14,5 during the same timeframe. What’s going on?
Descending Prices, Increasing Correlation
When looking at 30 day price performance, the younger decentralized finance tokens seem to take a more substantial hit compared with “legacy” cryptos like Bitcoin and Ethereum. Somewhat surprisingly Litecoin (LTC) is down -40,1 percent, breaking its historical correlation with Bitcoin. Among the deepest fallers are Chainlink (-44,1%), Aave (-42,1%), and Polkadot (-40,8%). Nevertheless we have seen this trend before, small-cap altcoins have a tendency to descend more than large cryptocurrencies. I.e. they’re more volatile than bitcoin.
30 Day Price Performance:
Bitcoin (BTC): -24,3%
Ethereum (ETH): -14,5%
Litecoin (LTC): -40,1%
Aave (AAVE): -42,1%
Uniswap (UNI): -38,8%
Chainlink (LINK): -44,1%
Cardano (ADA): -35,5%
Polkadot (DOT): -40,8%
Solana (SOL): -27,9%
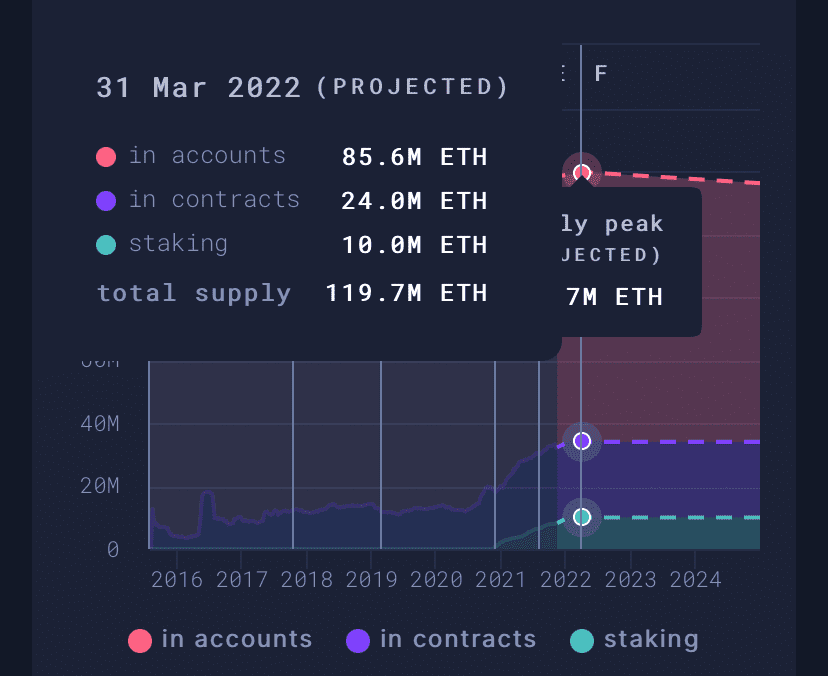
Ethereum’s notable robustness in this category is probably stemming from its increasing scarcity after EIP-1559. Ethereum’s programmed supply is about to peak in late March 2022 at 119,7 million Ether units. Smart money and institutional investors will likely accumulate Ethereum before the projected supply peak, increasing ETH’s buying pressure and resilience to price drops.
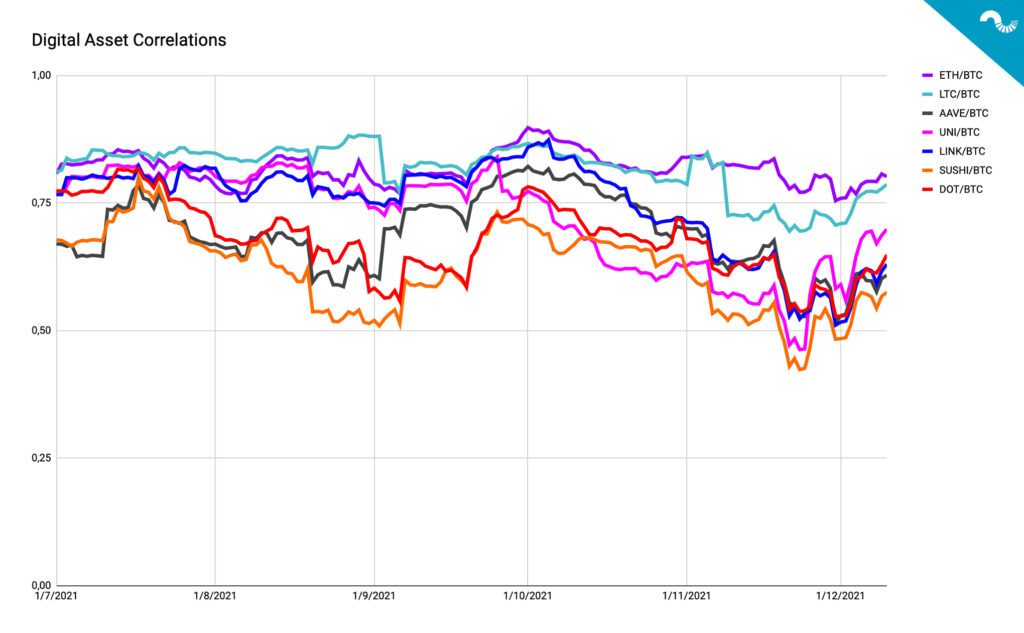
The correlation data shows how small-cap DeFi tokens are becoming more correlated with bitcoin. For example Uniswap (UNI) had only a 0,46 correlation with bitcoin in late November, now UNI/BTC correlation has climbed to 0,7. This is a well-known pattern: During price corrections the correlations have a tendency to go towards one (1). Should the spot prices fall even more, we can expect altcoins correlate in close proximity to Bitcoin.
The Redeemed Supply of Stablecoins Growing Exponentially
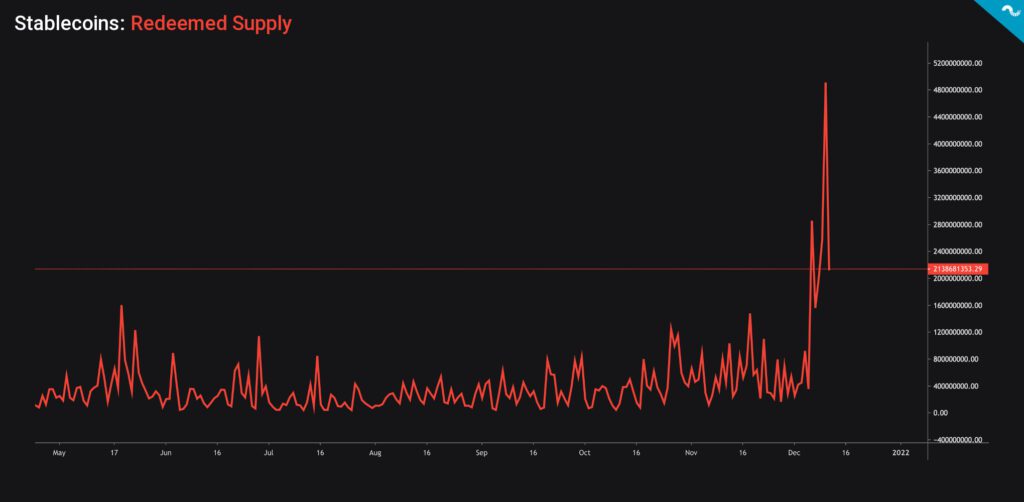
The redeemed supply of stablecoins has increased significantly, rising from late November’s 200 million units to current 2 billion stablecoin units. The redeemed stablecoin supply even touched 4 billion before settling down to current 2B level, representing a 10x increase from last month. The redeemed supply of stablecoins is a bearish sign and might be related to liquidity issues. China’s Evergrande crisis and subsequent default have left many investors in a tough position, they might redeem their stablecoin funds in a dire need of liquidity. Tether (USDT) has been particularly popular in Chinese regions which are most heavily hit by China’s real estate troubles.
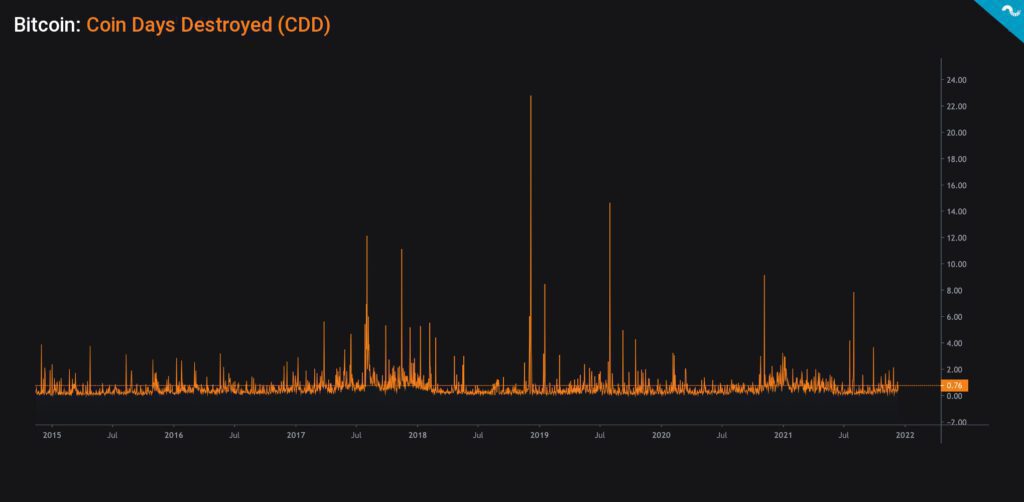
Bitcoin’s CDD Indicator Still Bullish
Bitcoin’s Coin Days Destroyed indicator, or CDD, gives a relatively bullish outlook, showing no notable change in the behavior of long-term holders. CDD essentially highlights the position of long-term holders (LTH) and is considered as an alternative to basic transaction volume metric. Each unspent day for a bitcoin unit adds a “coin day” and when that coin is eventually spent, the unit uplifts the Coin Days Destroyed metric. CDD can be interpreted with the following logic.
↑ High CDD: Selling pressure from long-term investors, bearish.
↓ Low CDD: No significant selling pressure from long-term investors, bullish.
The following chart shows CDD peaking in late bear cycle of 2018, followed by notable peaks in 2019, and 2020. The highest CDD so far was recorded in late 2018 as bitcoin’s spot price slided towards $3K, leading to wide capitulation. As a summary these CDD peaks mark the moments when long-term holders have reduced exposure to bitcoin and sold their positions. Calm CDD periods mirror long-term holding.
Ethereum Derivatives Market Looking Strong
In contrast to price action and redeemed stablecoin supply, Ethereum derivatives are still looking relatively positive. The funding of Ethereum derivatives momentarily dropped to negative sector, correlating with the price drop, however they’re still far from 2021 summer deep negative funding figures. The open interest of Ethereum derivatives still remains high in close proximity to November peaks.
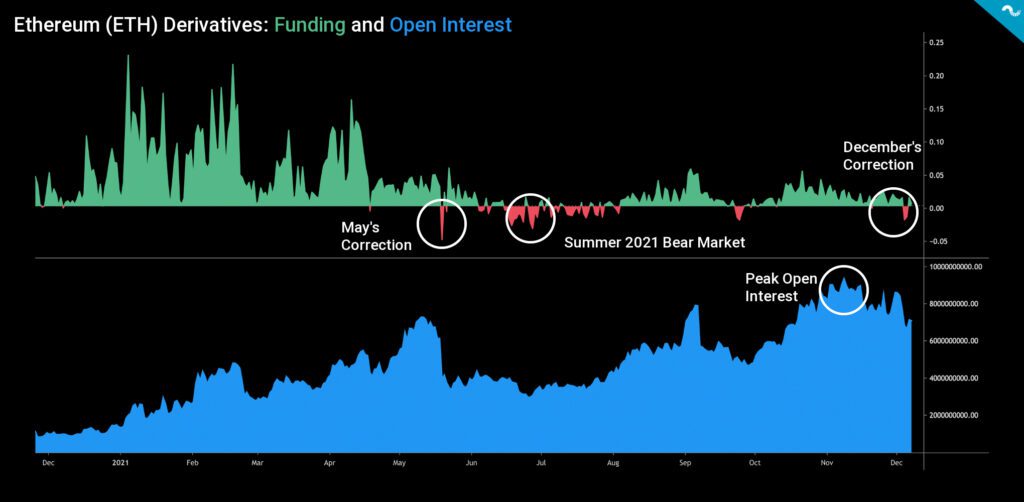
As mentioned before, Ethereum has shown substantial resilience to selling pressure and has only dropped -14,5 percent within past 30 days. Ethereum’s resilience is supported by multiple factors: The institutional interest in decentralized finance, Ethereum’s developer community, it’s peaking supply, and following scarcity. If the spot price remains stable, there’s also room for a short squeeze setting like seen during summer 2021.