
The TA of week seven explores the technical Directional Movement Index (DMI). Additionally we analyze challenging macro environment, UTXOs, and long term investor profitability.
Markets stayed in relatively negative athmosphere this week, disrupted by the challenging macro environment and increasing geopolitical risk. The leading cryptocurrency Bitcoin has weakened -8,1 percent within past seven days, while decentralized finance platform Ethereum has weakened -9,2% in close proximity with the former.
7 Day Price Performance
Bitcoin (BTC): -8,1%
Ethereum (ETH): -9,2%
Macro environment remains bearish as the Federal Reserve is expected to start the tapering program this spring, effectively reducing the amount of new dollars flowing into the financial system. In order to counter rising inflation the central banks are also expected to raise rates, which could lead to challenges with mortgages and corporate loans.
There’s also rising geopolitical risk as clouds of war loom over Eastern Europe. While a full scale war might be unlikely, even the possibility of war might lead to investors de-risking their portfolios. In a risk-off situation the speculative investments are usually the first to be sold. This could mean challenges to more speculative small-cap tokens.
How to Interpret Directional Movement Index (DMI)?
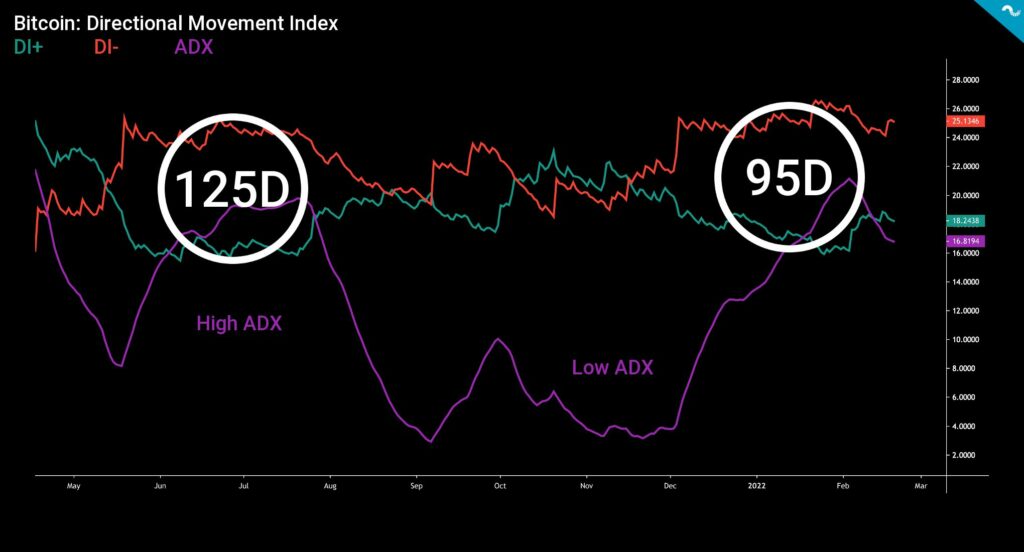
Directional Movement Index is a technical indicator used to interpret the strength of market-related uptrends and downtrends. The Directional Movement Indicator is divided to Positive Direction Indicator DI+ (green) and Negative Direction Indicator DI- (red). The DMI can be used in combination with Average Direction Index called ADX (purple). DMI can be used with following logic:
DI+ Line Above The DI- Line: Bullish Trend
DI- Line Above The DI+ Line: Bearish Trend
Looking back at early 2021 the DI+ line ascended to almost 37, indicating the most bullish sentiment since the bull cycle of 2017. In the crash of May 2021 the DI+ dropped down to a mere 17 and recovered to 23 in October. While the gap between DI+ and DI- lasted for 125 days in the summer correction of 2021, the current correction has only lasted 95 days in DMI terms.
If we assume that the current correction is at least as long as during summer 2021, the bearish downtrend could continue for another 30 days. The Average Direction Index ADX shows how the bullish trend of early 2021 and correction of summer 2021 had relative strength. According to ADX the November’s spot price peak was unsupported by technical DMI. Additionally ADX shows a recent positive signal as it changed direction at the turn of January and February, meaning that the current negative sentiment is losing its strength.
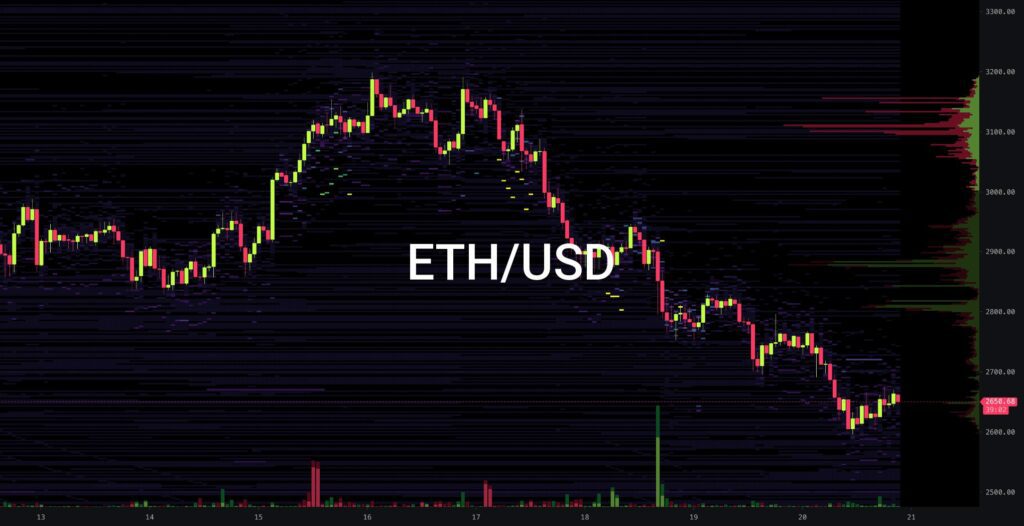
Weakening Volume for Ethereum
Ethereum’s Volume Profile Visible Range (VPVR) shows radically weakening volume on week seven as the spot price dropped from 3200 USD level into 2700. The VPVR shows gaps in 2800 and 3000 levels, meaning that spot price might later gravitate towards these higher levels. Buying volume also peaked at 2900, signaling higher demand on these levels.
Accumulation in 3Y-5Y UTXOs, Long Term Holders Still in Profit
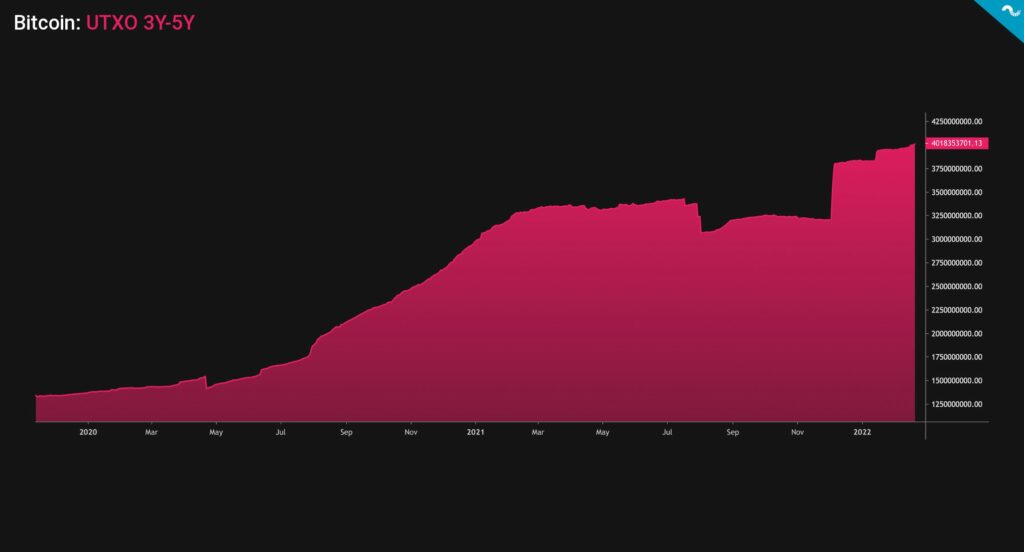
Bitcoin was originally designed as a transparent network. The transparency allows researchers to deeply explore the system and its UTXO structure. UTXO Age Distribution, or more commonly known as HODL Waves, presents a macro view of Bitcoin investor behaviour.
The recent UTXO data shows how 3Y-5Y bands are in accumulation mode after dropping briefly in last quarter of 2021. These UTXO bands of 3Y-5Y age represent institutional investors that have particularly long investment horizons.
Other shorter UTXO age bands like 6M-12M and 2Y-3Y are giving signs of capitulation. This would mean that native bitcoin units are again shifting hands from short term investors to stronger long term hands.
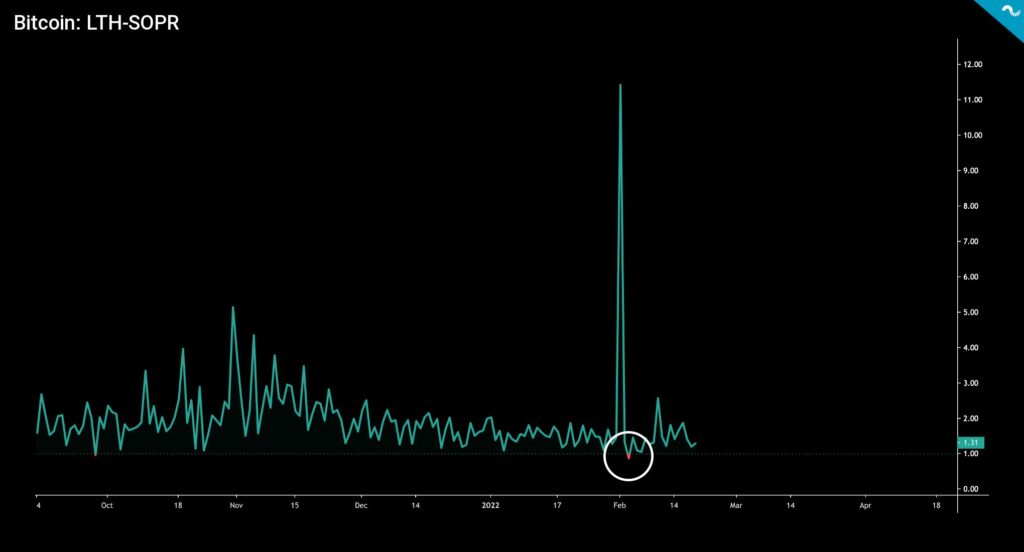
The Spent Output Profit Ratio of Long Term Holders is still showing green despite a bad start into February 2022. Compared to short term investors the long term holders are much more likely to be in profit across market cycles. Bitcoin is known to be a volatile asset class, however it has a tendency to favor long term investor behavior.