
The technical analysis of week 39 reviews the significant weekend price action and bitcoin’s return to the 200-day and 200-week moving averages. Additionally, we will explore the halving event schedule and its implications. We will also examine how short-term and long-term investors have performed in recent months.
The crypto market has experienced a new wave of demand during the week, with bitcoin surging by 10 percent over the weekend. Investors are trying to factor in the upcoming halving event of the spring 2024 and the future impact of a spot ETF on bitcoin’s price, with expectations for the turn of the year now clearly elevated.
Charles Edwards shared his market-related views on the X platform, mentioning that bitcoin serves as an “insurance” for the upcoming cycle of quantitative easing (QE). Bitcoin can also be interpreted as being in a front-run position with respect to the QE cycle. There is a well-established correlation between the spot price of the cryptocurrency and periods of quantitative easing.
“As more and more metrics of consumer and employment risk start to emerge, the value of QE insurance will sky-rocket.” – Charles Edwards
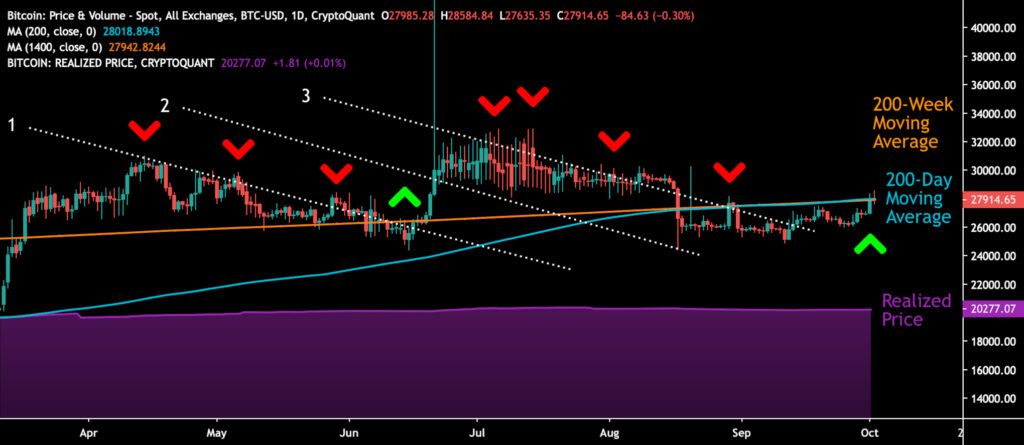
From a purely technical perspective, the three descending channels (white, 1-3) have defined the spot market since the beginning of this year. Bitcoin managed to rise above channels one and two during the summer and broke through channel three after a brief hesitation in September. At the same time, bitcoin was oscillating within its multi-year confluence zone, where the 200-day (turquoise) and 200-week (orange) moving averages intersect.
Sources: Timo Oinonen, CryptoQuant
Bitcoin’s primary support level is represented by its realized price wave (violet), which is considered a market watershed. The realized price reflects the average price of all bitcoin purchases and indicates that the average investor is in a profitable position.
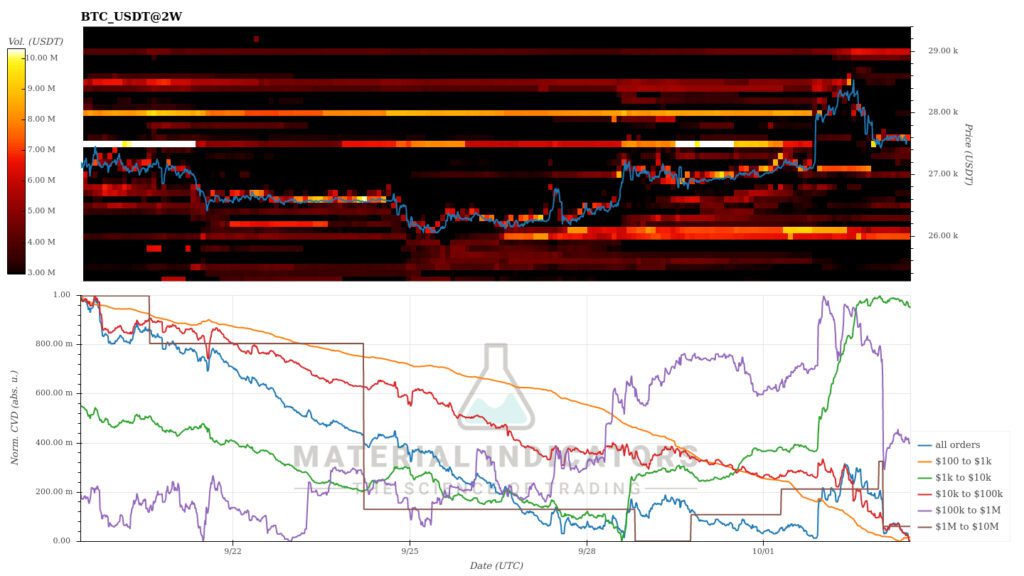
Material Indicators’ heat map indicates a strong support level at $26 000, with bitcoin’s short-term target price set at $29 000. Cumulative volume delta suggests that mid-sized investors’ appetite is growing.
Source: Material Indicators
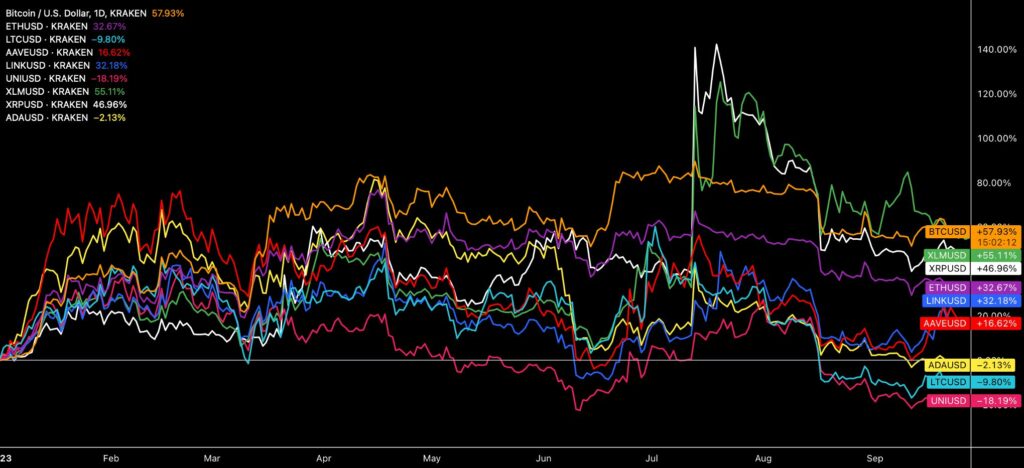
Bitcoin, which has risen by about three percent since last week, maintains its position at the top of the annual performance chart for cryptocurrencies listed on Coinmotion, surging over 66 percent since the beginning of January. Following closely behind are XRP and Stellar, which have strengthened by 58 and 56 percent, respectively. The dominant theme in the market continues to be the growth of bitcoin dominance, with investors focusing on the upcoming halving event and fund speculations.
Meanwhile, the U.S. Securities and Exchange Commission’s (SEC) division between “commodity tokens” and “securities tokens” continues to maintain a clear market divergence. So far, the SEC has classified only bitcoin, Ethereum, and XRP as commodities, solidifying their status.
Source: TradingView
Kaiko’s chart reflects the fading of the cryptocurrency market between the second and third quarters. With bitcoin and Ethereum closely correlated with each other, especially smaller higher-beta tokens have taken a hit. Decentralized exchanges like Uniswap (-17% YTD) have seen a steep decline, with a drop of -30 percent in quarter two and over -20 percent in quarter three.
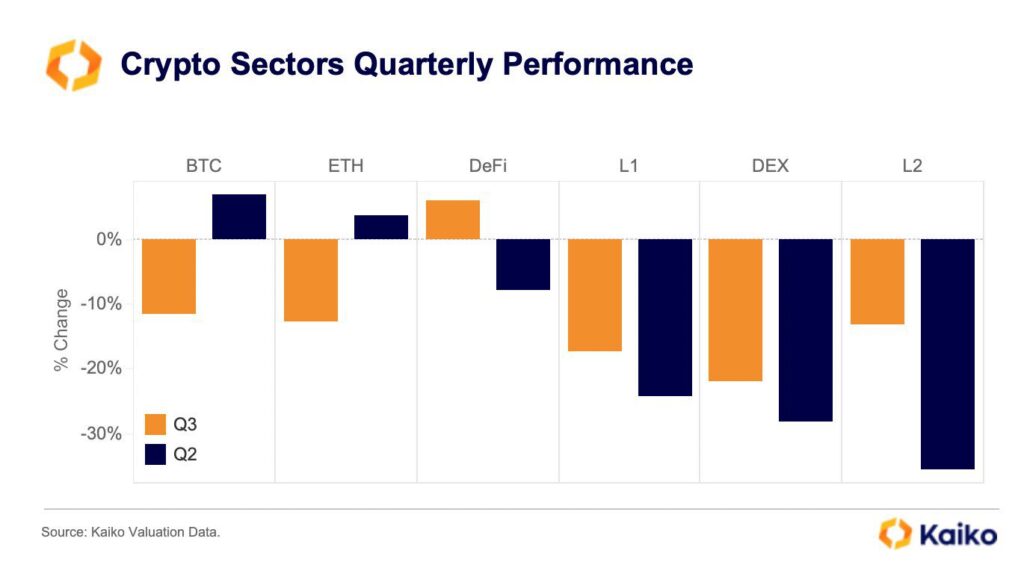
Source: Kaiko
7-Day Price Performance
Cardano (ADA): 3,8%
200 Days Until the Halving
One clear factor behind the weekend’s price surge is the upcoming halving event of spring 2024. Halving events, which recur in four-year cycles, are an essential part of the Bitcoin market, literally halving the block reward paid to miners, which dropped from 12,5 bitcoins to 6,25 bitcoins in 2020. Similarly, the 2024 halving will halve the block reward again, reducing it to 3,125 bitcoin units.
A look at historical data shows that bitcoin’s price increased by 1263 percent between the halvings of 2016 and 2020. Furthermore, between the May 2020 halving and the subsequent all-time high, bitcoin strengthened by 654 percent. Assuming bitcoin trades at a moderate valuation of $30 000 during the spring 2024 halving, a 654 percent increase would propel BTCUSD to $226 200.
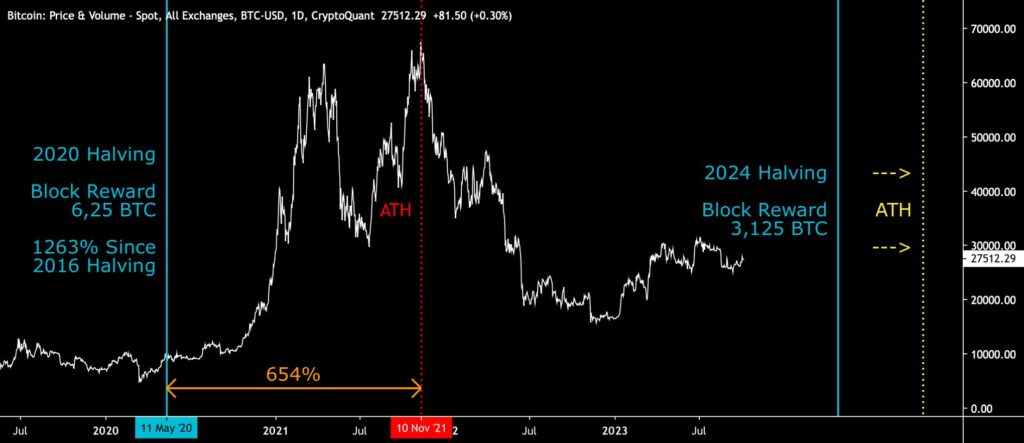
Sources: Timo Oinonen, CryptoQuant
If bitcoin’s starting point is $40 000 at the April halving event, a 654 percent increase would respectively propel it to above and beyond of $300 000. Of course, these scenarios are speculative, and halving cycles do not necessarily mimic each other linearly. The presented valuation levels are approximate.
As the halving approaches, many investors are now considering how to trade the upcoming event. The most classic approach is likely the buy-and-hold strategy, where investors accumulate bitcoin when the price is relatively low. Due to bitcoin’s scarcity features, I have personally favored a low-time-preference buying program.
Another approach is the tactic recommended by the creator of the stock-to-flow model, PlanB. He has advised investors to use position trading, where bitcoin purchases are made six months before the halving event. At the same time, PlanB suggests selling the position 18 months after the halving.
In combination with a spot ETF, the halving cycle is expected to increase the appetite of both retail and institutional investors. Quoting the famous words of Anthony Pompliano, bitcoin’s return profile is asymmetric because its potential significantly outweighs the downsides.
“Bitcoin has an asymmetric return profile, there is much more upside than downside in owning the asset.” – Anthony Pompliano
Short-Term Investors Above the Break-Even
While bitcoin has managed to strengthen by 66 percent since the beginning of the year, the surrounding macro market has required investors to either exercise patience or exhibit good navigational skills. The SOPR indicator, which compares the behavior of short-term and long-term investors, indicates that the recent price surge has provided relief, especially for short-term investors.
The SOPR indicator was originally developed by Renato Shirakashi, and it’s calculated by dividing the realized value of bitcoin (USD) by the value of the original bitcoin transaction. Or in simplified terms, the selling price is divided by the purchase price. The SOPR indicator can be interpreted with the following logic:
SOPR > 1 = Seller in profit
SOPR < 1 = Seller at a loss
The yellow STH indicator, which describes short-term investors, plunged deep amid August’s selling pressure, dropping to a level of 0,965. Subsequently, STH rebounded strongly in early October, aiming to reach summer levels once again. Therefore, the recent spot price increase has pushed short-term investors above their break-even (red, 1).
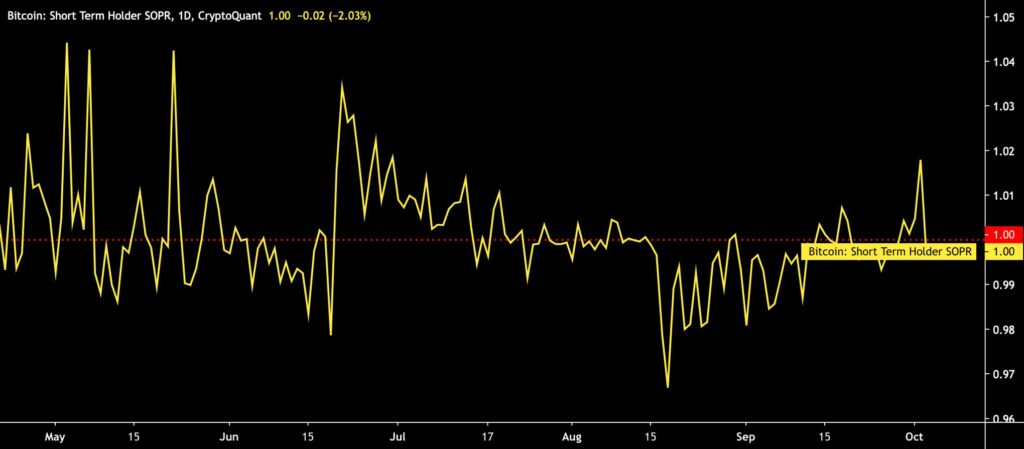
Sources: Timo Oinonen, CryptoQuant
The turquoise LTH indicator, reflecting long-term investors, remains at a level of 1,24, indicating that holders are clearly above their break-even. From the perspective of bitcoin’s historical price development, a long-term buy-and-hold strategy has been more profitable than short-term trading. Those who safeguard their bitcoin holdings in cold storage are relatively immune to market fluctuations, while traders are exposed to larger losses. Short-term investors also tend to react more reflexively, buying and selling the asset within shorter intervals.
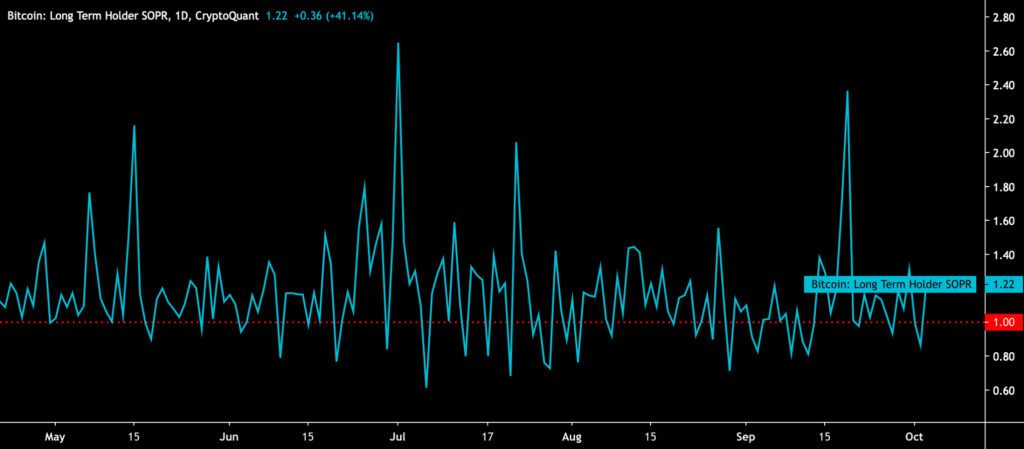
Sources: Timo Oinonen, CryptoQuant
What Are We Following Right Now?
Liberland, located on a border island between Croatia and Serbia, has launched its own blockchain-based currency called the Liberland Dollar (LLD). The decision has divided opinions within the blockchain community, with some considering bitcoin superior to the LLD.
However, the founder of Liberland assured that a significant portion of the government’s assets is in a bitcoin form. In addition to the Liberland Dollar, the area also offers a governance token called Liberland Merit (LLM), representing a “share” of the region. The supply of LLM tokens mimics the scarcity features of bitcoin, with its supply limited to 70 million.
Liberland, a self-declared state, has faced challenges recently as Croatia attempted to block access to the island. Liberland’s founder, Vit Jedlička, is Czech, and its declaration of independence is based on the idea of freedom and limited government. Liberland aims to leverage cutting-edge technology, including cryptocurrencies and tokens.
Zuger Kantonalbank enables its customers to engage in bitcoin and cryptocurrency trading.
Luke Gromen’s views on the position of the dollar in the new multipolar world. Can the hegemony of the world’s reserve currency continue?

Stay in the loop of the latest crypto events
- Dive into Cardano (ADA): A newcomer’s comprehensive guide
- Asset allocation and diversification: Lesson #8
- Could an ETF Scenario Uplift Bitcoin by 73%?
- Identify trends, buy and sell signals with technical indicators: Lesson #7
- How to send money home via crypto: Remittance made easy
- Continuing the Transformation: Coinmotion Welcomes New CEO Antti-Jussi Suominen
- Aave: The DeFi Powerhouse Changing the Crypto Landscape

The views, thoughts, and opinions expressed in the text belong to the author and not necessarily to the author’s employer, organization, committee, or other group or individual.