

This new 11-part series is designed for beginners who want to invest in cryptocurrencies but need more information before taking the plunge. Our goal is to provide clear and concise explanations of the fundamental concepts in the world of cryptocurrencies.
Over the following weeks, we’ll publish a weekly lesson covering one topic regarding investing in cryptocurrencies. Each lesson will take less than 5 minutes to read. At the end of the course, you will better understand how to invest in cryptocurrencies, what to invest in, and when is the right time to do it.
This week, we will provide a concise overview of the top 5 technical analysis indicators that can help you make better-informed decisions in the market. These indicators make it easier to identify patterns and spot buy or sell signals in the current market environment. These tools can benefit traders and investors alike, so let’s dive in.
📊 Relative Strength Index (RSI)
RSI is a momentum indicator that helps you determine if an asset is overbought or oversold. By measuring the rate of price changes, RSI can signal the strength of a trend. Be cautious, however, as RSI can sometimes produce false signals. Always consider additional factors before making a move.
💡 Buy & Sell Signal: A traditional RSI buy signal occurs when the indicator was below 30 and rises back above 30, indicating that the asset may be oversold and is starting to trend upwards. Conversely, an RSI sell signal is generated when the indicator was above 70 and drops back below 70, suggesting that the asset could be overbought and is starting to trend downwards.
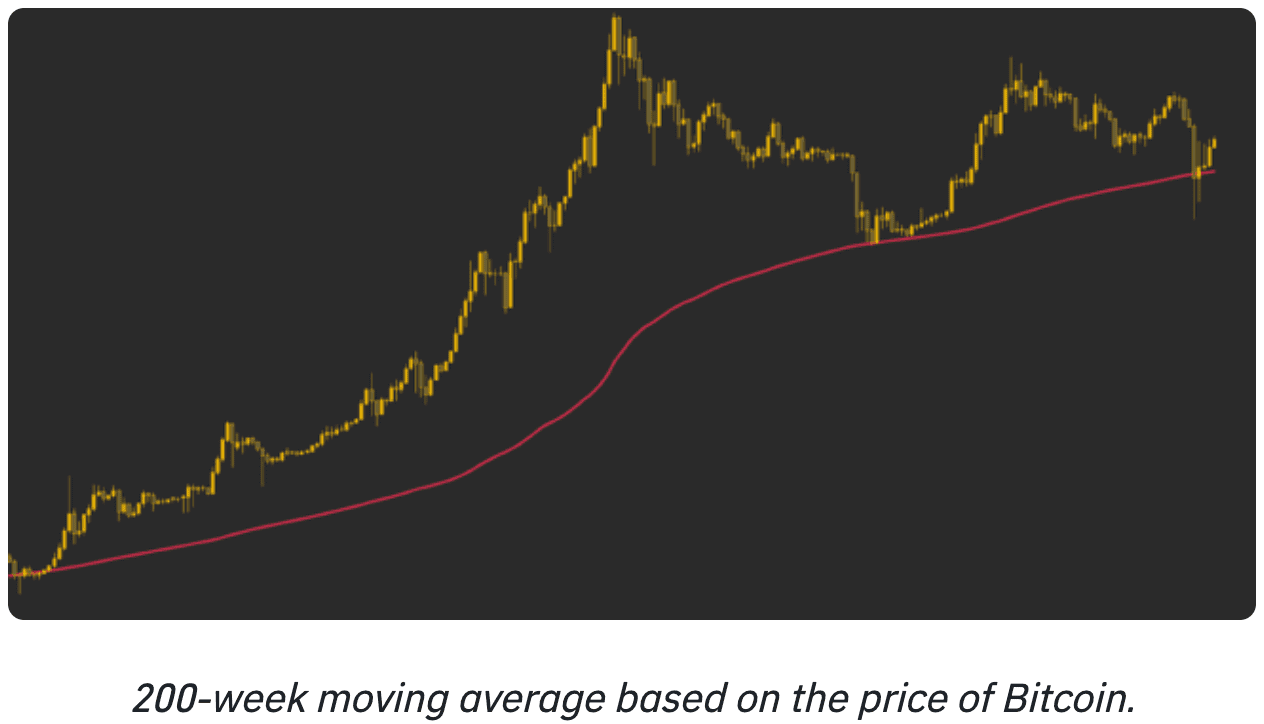
📉 Moving Average (MA)
MA is a lagging indicator that smooths out price action and highlights trends. The simple moving average (SMA) and the exponential moving average (EMA) are two common types. Traders may use the price’s relationship with specific MAs to gauge the market trend or use MA crossovers as buy or sell signals. Remember that MAs are lagging indicators, so they’re based on past price data.
💡 Buy & Sell Signal: An MA buy signal occurs when a shorter-term moving average (e.g., 50-day SMA) crosses above a longer-term moving average (e.g., 200-day SMA), indicating a bullish trend and potential price increase. On the other hand, a sell signal is triggered when the shorter-term moving average crosses below the longer-term moving average, suggesting a bearish trend and potential price decline.
🔄 Moving Average Convergence Divergence (MACD)
MACD shows the momentum of an asset by comparing two moving averages. By examining divergences between the MACD and price action, traders can gain insight into the strength of a trend. Additionally, crossovers between the MACD and signal lines can provide buy or sell signals. Combining MACD with RSI can give a more comprehensive technical outlook on the market.
💡 Buy & Sell Signal: A MACD buy signal is generated when the MACD line (12 EMA – 26 EMA) crosses above the signal line (9 EMA of the MACD line), suggesting that momentum is shifting towards the bulls and that the price may continue to rise. Conversely, a MACD sell signal occurs when the MACD line crosses below the signal line, indicating that momentum is shifting toward the bears and that the price may decline.
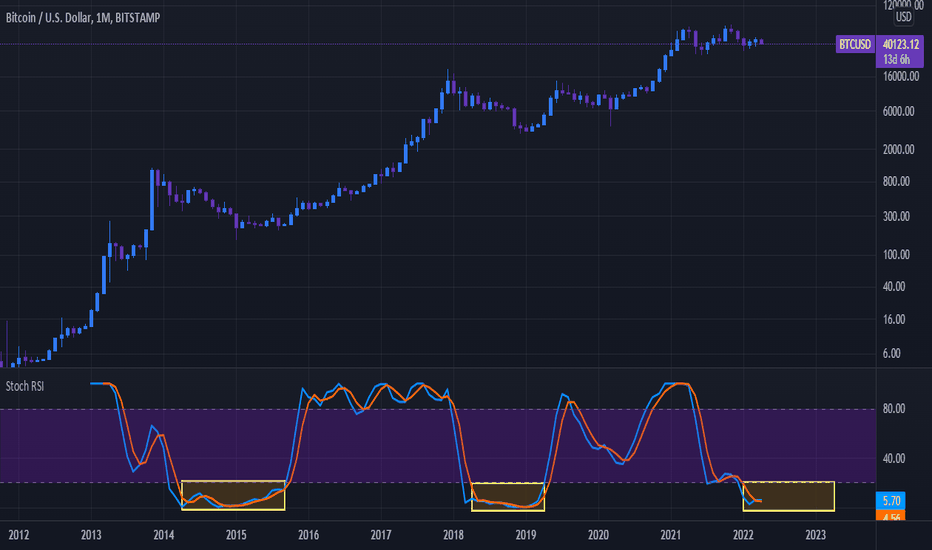
⚡ Stochastic RSI (StochRSI)
StochRSI is a momentum oscillator that helps determine overbought or oversold conditions. It is derived from RSI values and is generally most useful when near the upper or lower extremes of its range. Remember that StochRSI is more sensitive than the RSI indicator and may generate more false signals.
💡 Buy & Sell Signal: A StochRSI buy signal is generated when the indicator moves below 0.2 (or 20), suggesting that the asset is oversold, with the price potentially increasing as the StochRSI rises back above 0.2 (or 20). On the other hand, a StochRSI sell signal occurs when the indicator moves above 0.8 (or 80), indicating that the asset is overbought, with the price potentially decreasing as the StochRSI drops back below 0.8 (or 80).
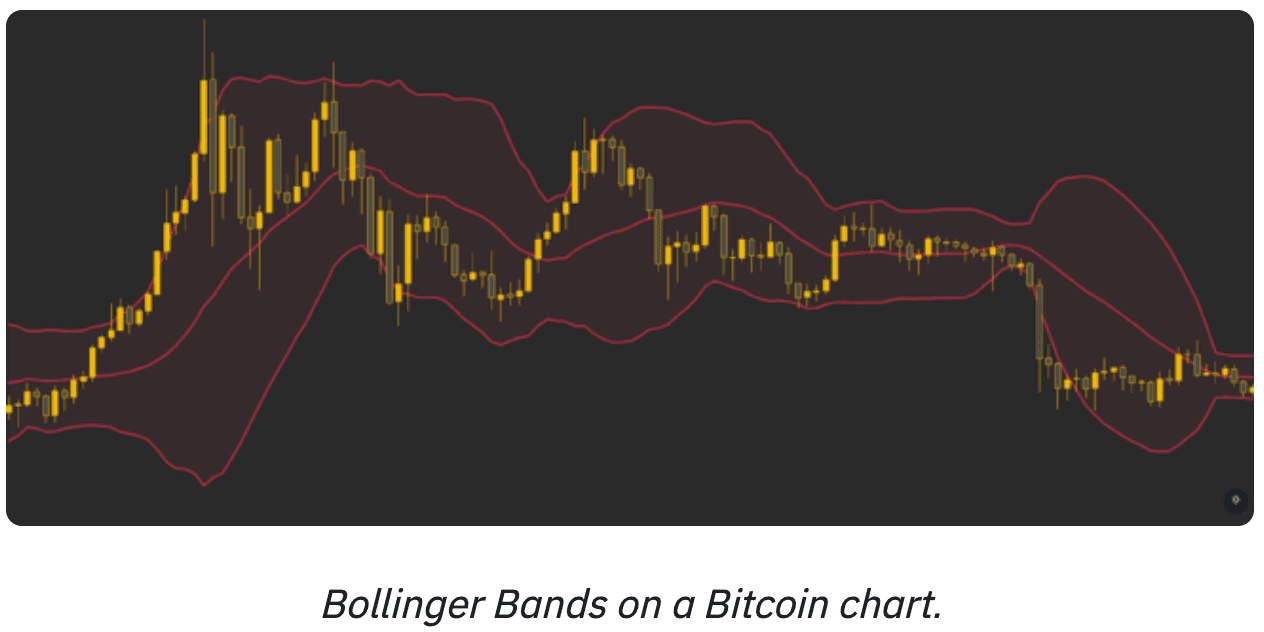
📈 Bollinger Bands (BB)
BBs measure market volatility and overbought/oversold conditions. They consist of three lines: an SMA and an upper and lower band. The bands’ distance increases or decreases with volatility, and the price’s proximity to the bands indicates overbought or oversold conditions. Additionally, periods of low volatility (called squeezes) can show potential future volatility.
💡 Buy & Sell Signal: A BB buy signal may be generated when the price touches or moves below the lower band, indicating that the asset may be oversold, with a potential price increase as the price moves back toward the middle band (SMA). Conversely, a BB sell signal occurs when the price touches or moves above the upper band, suggesting that the asset could be overbought, with a price drop possible as the price moves back toward the middle band (SMA).
💡 In short
Remember that while indicators provide valuable data, their interpretation is subjective. It’s essential to be aware of personal biases and to use a combination of indicators or other methods, such as fundamental analysis, to make informed decisions.
The best way to learn technical analysis is through practice. So why not head to Coinmotion and apply your newfound knowledge today?

The views, thoughts, and opinions expressed in the text belong to the author and not necessarily to the author’s employer, organization, committee, or other group or individual.