

The technical analysis of week 35 assesses bitcoin’s recent technical weakness and long-term value drivers. At the same time, we explore what the mutual hierarchy of Coinmotion-listed tokens looks like and why bitcoin’s trading volume is decreasing. We also delve into the profitability thresholds for short-term and long-term investors.
The sentiment of the cryptocurrency market has remained somewhat negative within seven days, as the leading cryptocurrency bitcoin slipped down by -6,2 percent. Despite the weakening momentum, bitcoin is still up over 55 percent since the beginning of the year, and the market is looking forward to the upcoming halving event of spring 2024.
Investment bank J.P. Morgan’s strategist Nikolaos Panigirtzoglou commented on the cryptocurrency market outlook in his recent report, noting that Grayscale’s legal battle victory has boosted overall optimism. Panigirtzoglou sees the U.S. Securities and Exchange Commission (SEC) now being on the defensive side as a counterbalance to the aggressive stance taken in the spring.
“The court ruling on the Grayscale case against the SEC has boosted crypto markets optimism. With this decision following on from the recent SEC vs. Ripple court decision, it has in turn raised optimism that the SEC crackdown against crypto companies, that has been very intense since the beginning of the year, would lessen going forward as the SEC faces legal challenges.” – Nikolaos Panigirtzoglou
From a purely technical perspective, bitcoin is currently trading below both the 200-day (turquoise) and 200-week (yellow) moving averages while also hovering within a multi-year confluence zone. During the spring and summer, bitcoin broke above three technical channels (1-3, white), but it recently fell out of channel number 3.
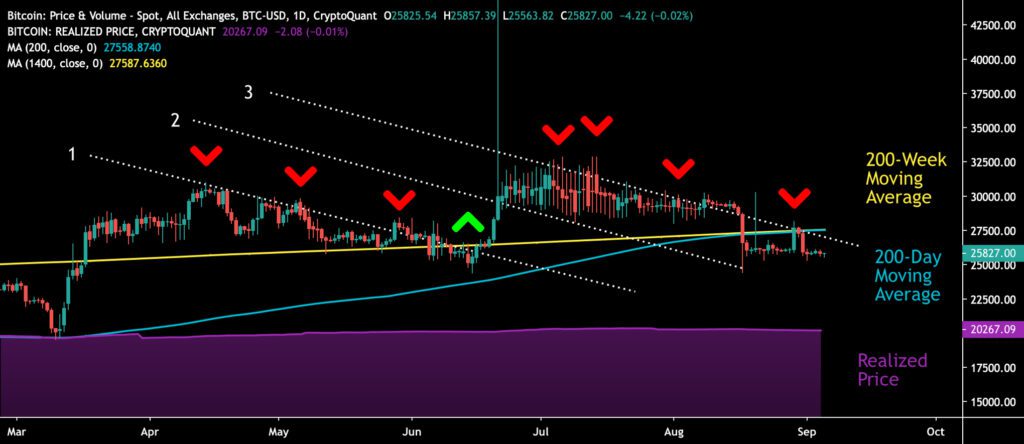
Sources: Timo Oinonen, CryptoQuant
Now, bitcoin needs a demand spike similar to June’s to rise above the third channel; otherwise, there is a risk of the spot price weakening toward the realized price’s purple wave. The realized price serves as a market watershed, reflecting the average price of all bitcoin purchases. The realized price currently trades at $20 267, indicating that the average bitcoin investor is in profit.
In the bigger picture, bitcoin’s trajectory shifted dramatically at the turn of 2022-2023, as the long-term downtrend line gave way to an uptrend cycle. Simultaneously, the turn of the year marked the end of the distribution cycle for bitcoin and the beginning of a new pre-halving accumulation cycle.
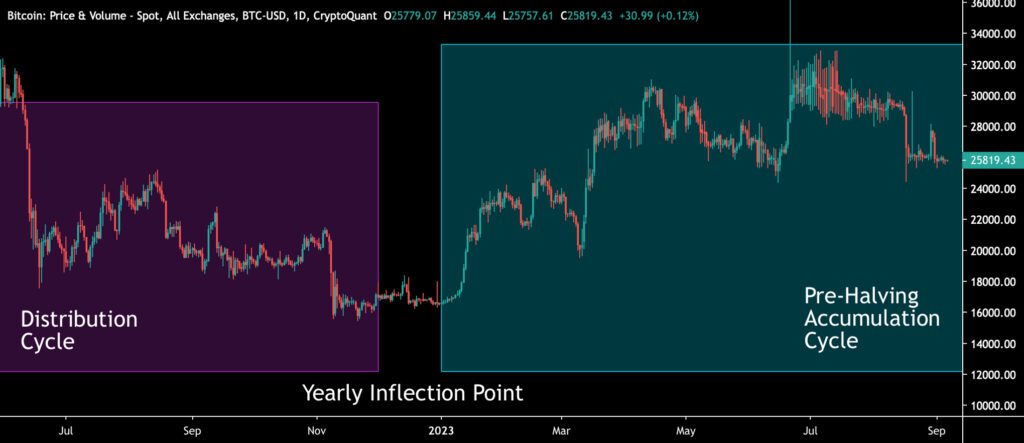
Sources: Timo Oinonen, CryptoQuant
The Material Indicators’ heat map indicates the formation of a strong support level at $25 000. Meanwhile, the cumulative volume delta reveals a decline in short-term demand across all segments.
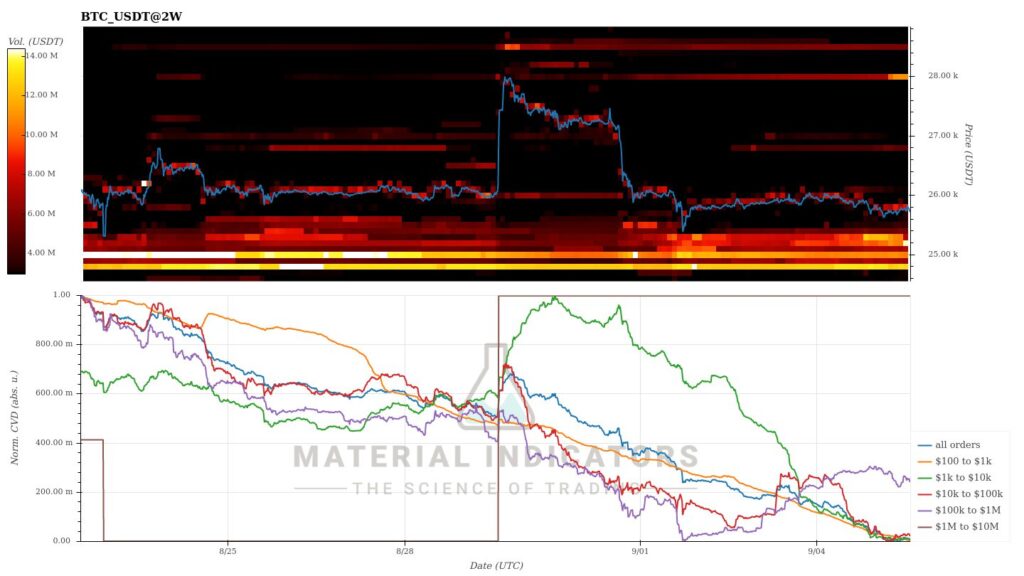
Source: Material Indicators
The weekly price development of the cryptocurrency market has been moderately bearish. Cryptocurrencies listed on Coinmotion closely correlate with bitcoin, which has dipped by about six percent. The market sentiment is cautious as investors weigh short-term technical uncertainty against favorable long-term drivers, including the potential ETF approval and the 2024 halving event.
7-Day Price Performance
Bitcoin’s Volume in a Downtrend
According to Velo Data, bitcoin’s weekly trading volume reached $194 billion in mid-March but has since plummeted to $62 billion. This marks a decline of -68 percent from March to September. The downward trend reflects a cooling market as the spot price gradually declines. However, the current period of low trading volume can still be seen as attractive from an accumulation perspective.
James Butterfill of CoinShares attributes bitcoin’s declining trading volume to a growing appetite for the U.S. dollar (USD) and its related stablecoins. In particular, the Bitfinex-backed stablecoin Tether (USDT) has increased its market share this year, reaching a market cap of $82,9 billion. Butterfill points out that bitcoin’s trading volume is still greater than that of London-listed stocks combined.
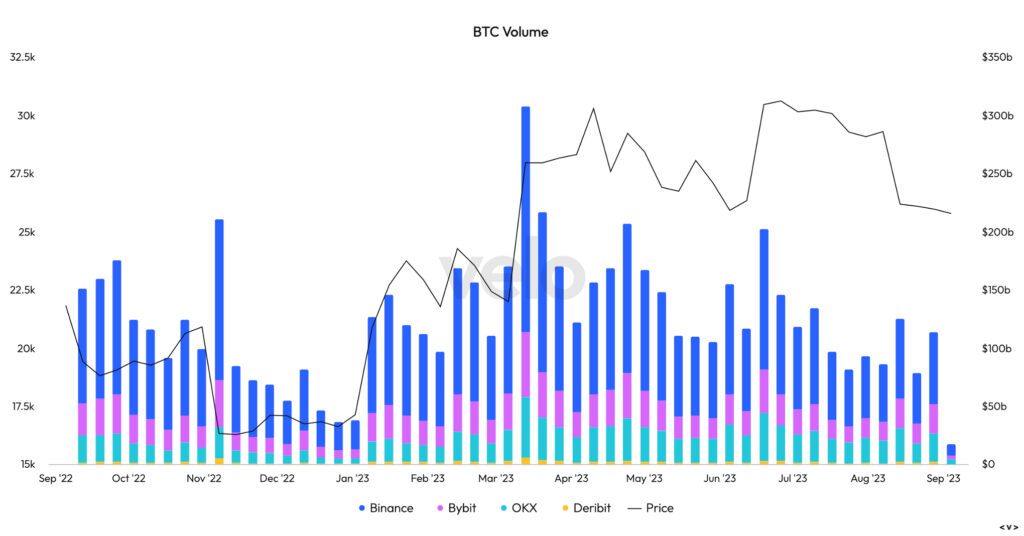
Source: Velo Data
In the downtrend of spot prices, Stellar has maintained its YTD lead among the cryptocurrencies listed on Coinmotion. Stellar has strengthened by 68 percent since the beginning of the year, surging to over 120 percent at its peak during the July rally. XRP, fueled by classification speculations in July, saw an increase of over 140 percent but has since dropped to the third position on the list with a 49 percent YTD value.
As XRP declined, bitcoin has secured the second position in YTD price performance, rising by 55 percent since the beginning of the year. Ethereum has strengthened by 36 percent since the start of the year, closely correlating with bitcoin. Among the listed cryptocurrencies, Litecoin and Uniswap have been the negative surprises, both plummeting by over 10 percent since the beginning of the year.
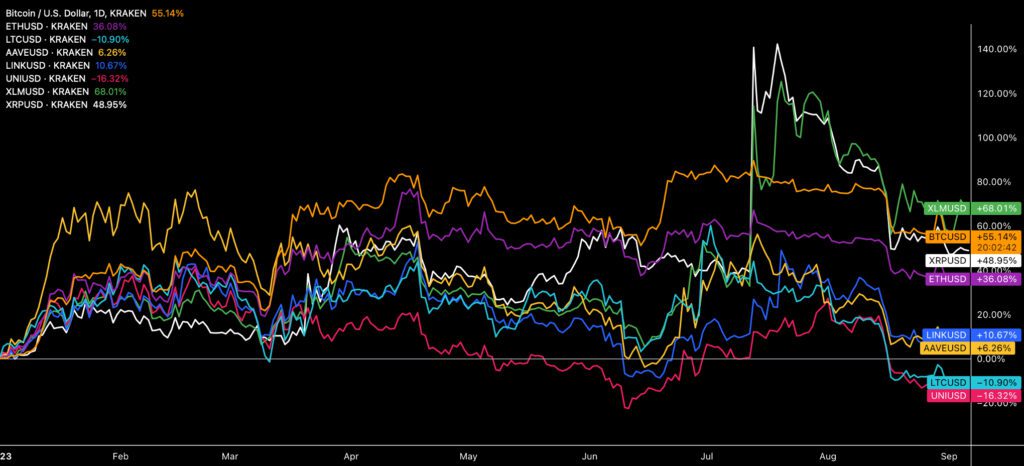
Source: TradingView
The segmentation created by the U.S. Securities and Exchange Commission (SEC) in early June continues to act as a market watershed. The commission divided cryptocurrencies and tokens into two main categories, with one being “commodity tokens” and the other being “security tokens.” This radical classification originally placed only bitcoin and Ethereum in the commodity group, securing their position. Now, XRP can also be included among the commodity-classified tokens.
Short-Term Investors Facing Losses
Originally developed by Renato Shirakashi, the SOPR indicator indicates that short-term investors are significantly more in the red compared to long-term investors. The SOPR indicator is calculated by dividing the realized value of bitcoin (USD) by the original bitcoin transaction value, or put, the selling price divided by the buying price.
From August to September, the yellow STH-SOPR reading for short-term investors dropped to a minimum of 0,97, inching slightly up toward the current value of 0,98. Short-term investors falling below the profitability threshold (1, red) may generate additional buying pressure as traders in this group aim to break their losing streak. A falling spot price would likely create a reflexive market reaction, where panicked traders could drive bitcoin sharply downward.
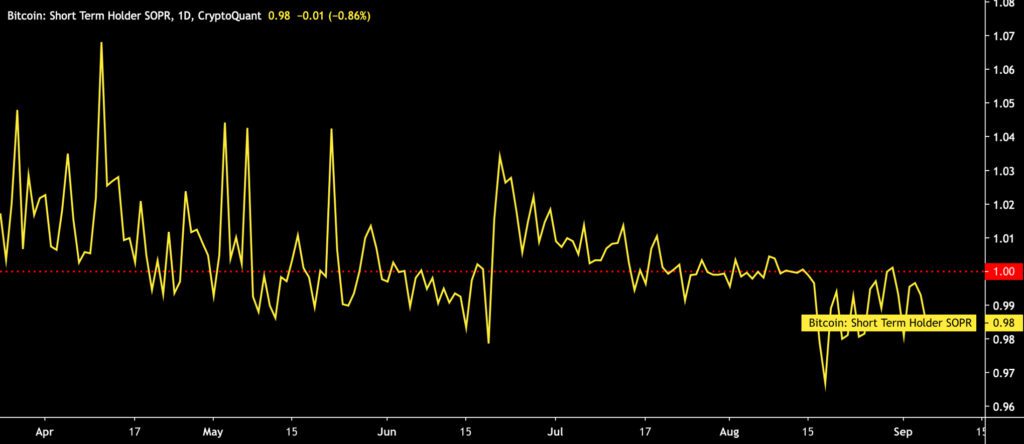
Sources: Timo Oinonen, CryptoQuant
In contrast to short-term investors, long-term investors (LTH-SOPR) are still above their profitability threshold, with a SOPR reading of 1,02. The so-called “buy and hold” strategy has been successful despite bitcoin’s historical price fluctuations, and the price is still relatively affordable.
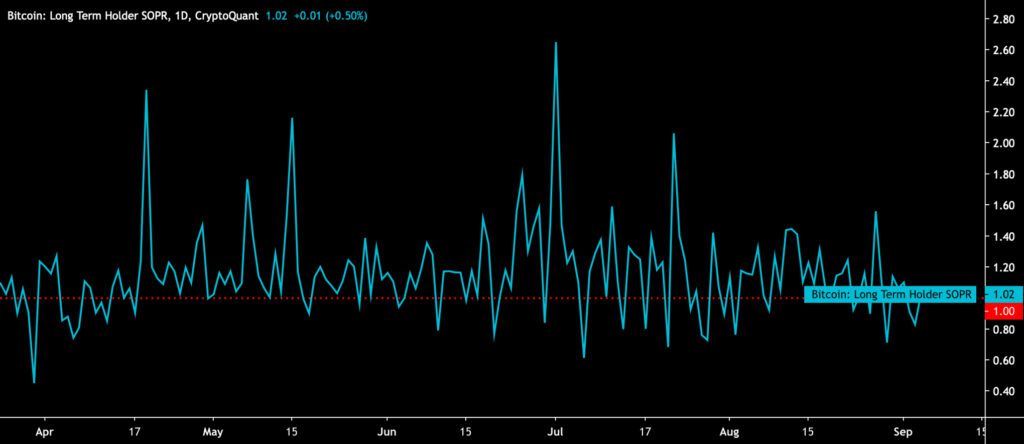
Sources: Timo Oinonen, CryptoQuant
Is Grayscale’s GBTC Undervalued?
Last week, we discussed Grayscale’s victory in its legal battle against the SEC. The so-called positive black swan briefly boosted the bitcoin market by 10 percent, but the price has since returned to its previous levels. Grayscale’s plan to convert its classic GBTC fund into a spot ETF format has now moved forward after the court ruled in the company’s favor.
Many experts have now suggested that the GBTC fund is undervalued, with the chart below depicting the relationship between the NAV’s simple moving average (30SMA) and the bitcoin price. According to Axel Adler Jr., any NAV readings below zero indicate undervaluation of the fund.
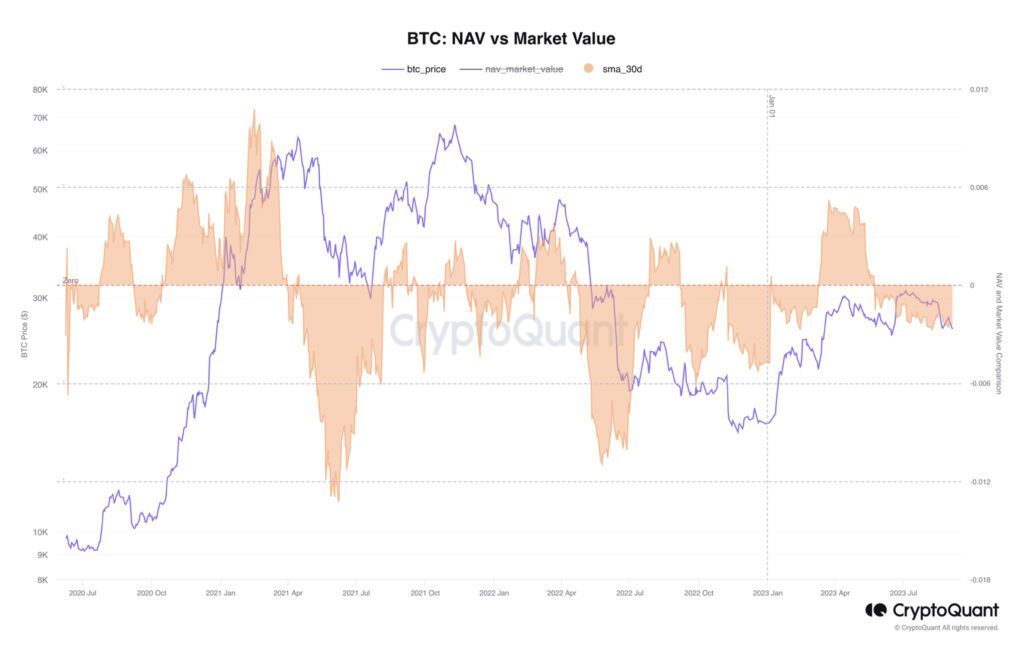
Sources: Axel Adler Jr, CryptoQuant
The potential success factor of GBTC is reflected in its premium rising to -18 percent, representing the highest figure since 2021. Historically, the premium peaked at 132,6 percent at the end of May 2017. The declining premium (or discount) has acted as a leading indicator for bitcoin’s price in previous years.
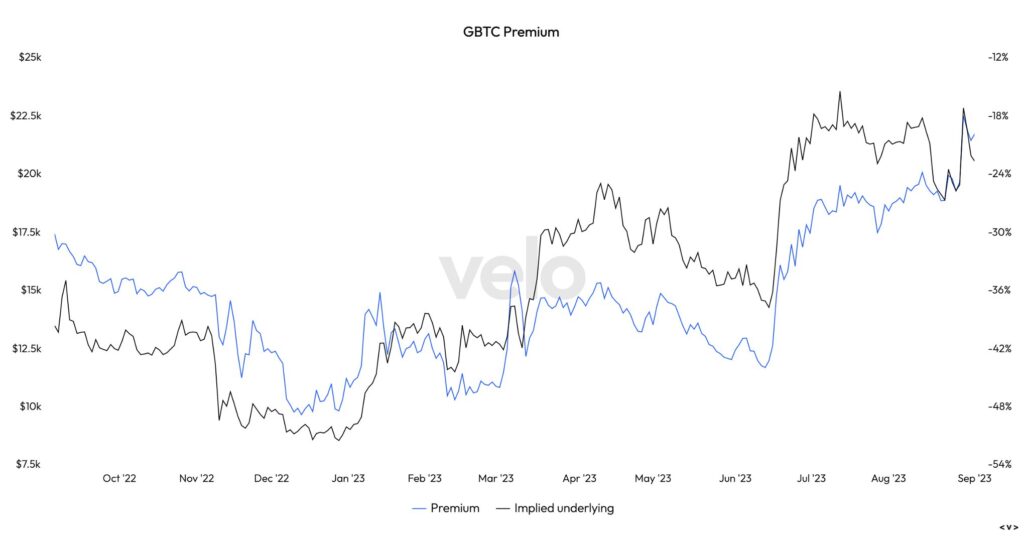
Source: Velo Data
An investor with a high-risk appetite can still engage in a “premium trade”, meaning they can acquire GBTC shares at a “discount” of -18 percent and potentially benefit from the assumed ETF listing later on. Of course, this scenario assumes that the spot ETF will be approved.
What Are We Following Right Now?
The multinational credit company Visa has announced an expansion of its stablecoin use through the smart contract platform Solana. Visa has previously utilized the USD Coin (USDC) stablecoin, which operates on the Ethereum platform. The positive news led to a several percentage increase in Solana’s SOL token on Tuesday, as a contrast to the overall market downtrend. Purchasing SOL tokens can be done through Coinmotion’s OTC service.
According to some analysts, the challenges facing the Chinese construction sector are expected to have broader repercussions. China has been the engine of global economic growth for the past few decades, and its macroeconomic effects have extended to digital assets as well. It’s also possible that the position of the economic locomotive could shift from China to India.
The world’s largest digital asset exchange platform, Binance, is once again facing criticism. Travis Kling, a fund manager at Ikigai, has warned about escalating issues with Binance and their potential ripple effects throughout the entire industry.
Stay in the loop of the latest crypto events
- Aave: The DeFi Powerhouse Changing the Crypto Landscape
- Pick your strategy: Trading vs. investing: Lesson #4
- Bitcoin Uplifted by a Positive Black Swan
- Understanding market dynamics, cycles, and bubbles: Lesson #3
- The Halving Cycle Is Not Priced In
- Crypto Investing Made Simple: Lesson #1
- Price Projections for 2023 and 2024
- Stellar Lumens — Unveiling a global digital payment protocol

The views, thoughts, and opinions expressed in the text belong to the author and not necessarily to the author’s employer, organization, committee, or other group or individual.