

The technical analysis of week 34 evaluates the market’s momentary euphoric sentiment amidst Tuesday’s parabolic price surge. At the same time, we are mapping out the situation of bitcoin at the confluence point of the 200-day and 200-week trendlines. Additionally, we delve into topics such as realized price, Grayscale, and UTXO analysis.
Positive news related to Grayscale’s legal battle propelled the leading cryptocurrency, bitcoin, to nearly a 10 percent elevation angle on Tuesday, marking the epilogue of months of sideways price movement. Investors have long been anticipating a new ETF launch, with contenders like BlackRock, Grayscale, and Fidelity vying for the coveted first-mover advantage. Grayscale’s plan to convert its classic GBTC fund into a spot ETF took a step forward as the court ruled in favor of the company.
In a recent report, Dan Morehead, the well-known hedge fund manager from Pantera Capital, commented on the cryptocurrency market’s trajectory, noting that predicting positive black swan events is usually impossible. By positive black swan, Morehead refers to Grayscale’s victory over the SEC, and he anticipates that the regulatory environment is now evolving in a favorable direction.
“Everybody ignores (positive) black swans until one happens. But if you make me say something, I would say regulatory clarity is the one thing nobody’s expecting.” – Dan Morehead
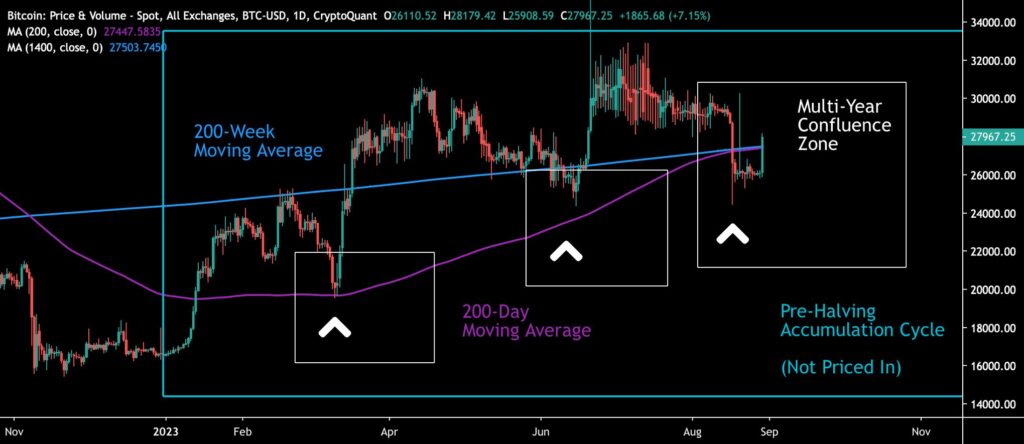
From a purely technical standpoint, bitcoin’s previous August price development can be considered precarious, with the spot price gradually moving lower within a sideways trend. The price is currently at a multi-year watershed moment, as the 200-day (purple) and 200-week (blue) moving averages converge with the spot price.
Sources: Timo Oinonen, CryptoQuant
In the spring and summer markets, bitcoin found support from the 200-day moving average (white box), leading toward a multi-year confluence zone. The recent rise above the 200-week moving average is an extremely positive signal. Bitcoin is still in its pre-halving cycle leading up to the spring 2024 halving event (turquoise), which acts as a bullish fundamental for the spot price. As mentioned in the previous week’s TA, the halving cycle still isn’t priced in.
Read more: The Halving Cycle Is Not Priced In
The Material Indicators’ heat map reflects $25 000 as a strong support level for bitcoin, while a weakish demand wave extends up to $30 000. Cumulative Volume Delta (CVD) indicates that whales are actively buying.
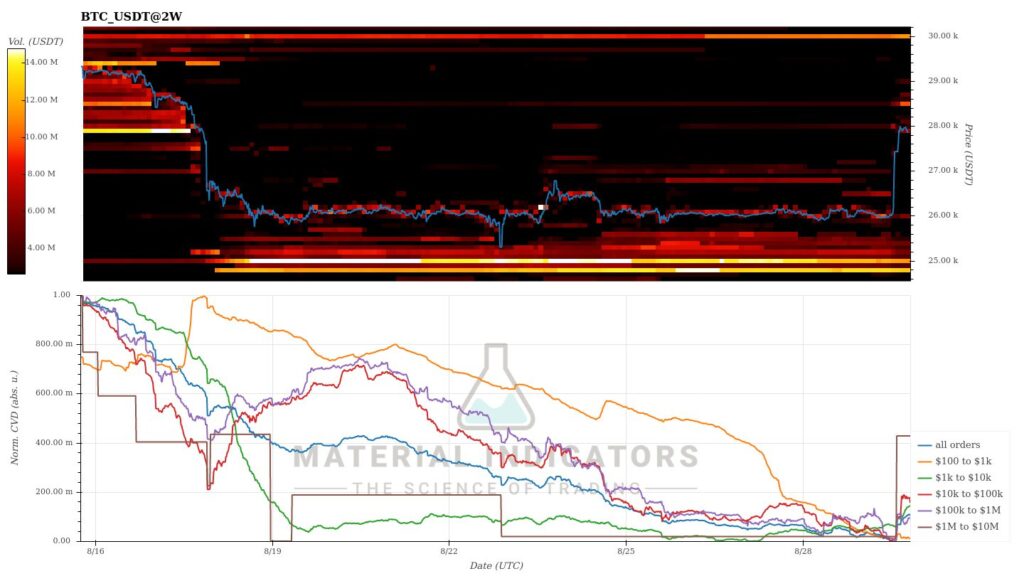
Source: Material Indicators
Tuesday’s market reaction was mainly confined to the leading cryptocurrency, bitcoin, as its correlation to the altcoin category decreased. Stellar and XRP, which were the subjects of classification speculations in July, continued their decline, with the latter weakening by more than -10 percent. Bitcoin dominance is currently at 49.81 percent and can be expected to rise further with the introduction of new funds and the halving cycle. The uptrend for higher-beta tokens will have to wait for a more favorable interest rate environment.
7-Day Price Performance
Binance’s Position Is Weakening in Relation to Coinbase
In the early part of the year, we were concerned about Binance’s spot market share rising to over 90 percent, strengthening the exchange following FTX’s collapse. Now, with actions taken by the U.S. Securities and Exchange Commission (SEC), Binance’s fortress seems to be shaking, as indicated by its declining Cumulative Volume Delta compared to Coinbase.
Binance’s challenges are also reflected in the -11 percent decrease in the exchange’s native token BNB since the beginning of the year. Meanwhile, bitcoin has seen a year-to-date increase of 64 percent, and MicroStrategy’s MSTR stock has risen by 156 percent. The decline in Binance’s dominant market position is a positive development for the industry and aligns with the principle of decentralization. The 2022 FTX episode demonstrated how market concentration in one entity can become a single point of vulnerability.
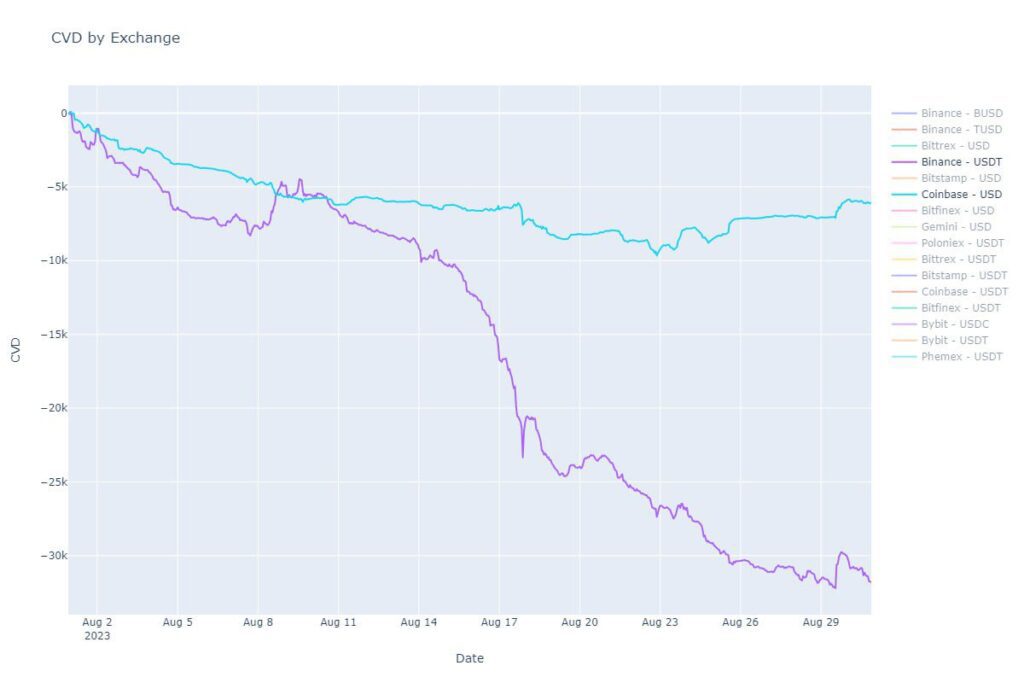
Source: João Wedson
Bitcoin’s Realized Price Gradually Increasing
The realized price of bitcoin is one of the market’s key indicators, as it represents the average price at which all bitcoin purchases have been made. Meanwhile, with the spot price trading around $28 000, the majority of bitcoin investors are at a profit, as the realized price remains around the $20 000 mark.
The drop of bitcoin’s spot price below the turquoise wave of the realized price is historically a temporary anomaly, with the most recent occurrences happening during the years 2020 and 2022. However, last year, the spot price remained below the realized price for an exceptionally long period, reflecting the depth of the bear market.
From the perspective of the realized price, the bear cycle of 2022 exceeded the duration of the 2018-2019 bear market, during which the spot price fell below the realized price for 133 days. The realized price served as a long-standing resistance level for the spot price, but it has once again become a strong support level.
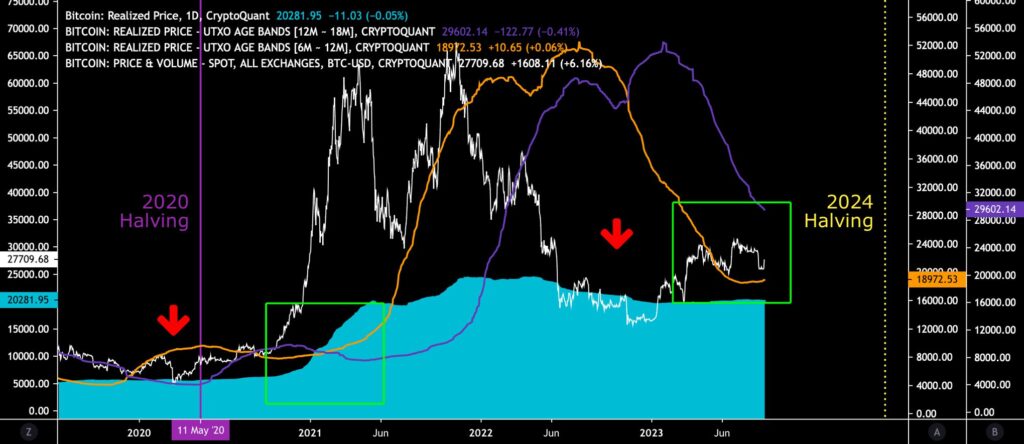
Sources: Timo Oinonen, CryptoQuant
The realized price UTXO waves can be used for market interpretation, with the embedded chart containing the 6M-12M (orange) and 12M-18M (purple) waves. These UTXO waves are repeating the structure seen in 2020, where the orange 6M-12M wave rose above the purple 12M-18M wave. Given that this configuration in 2020 led to a parabolic increase in the spot price, one can expect a similar event to boost the price this year as well.
Highest Premium for Grayscale’s GBTC Since 2021
Established over a decade ago, Grayscale is one of the iconic companies in the crypto industry, known for its traditional funds like GBTC and ETHE. Grayscale Bitcoin Trust, or GBTC, was the preferred Bitcoin instrument for institutional money, and its monopoly position allowed for significant management fees (2%). Recently, Grayscale has been facing increasing competition from new ETF funds, first from Canada and then from the United States. Grayscale’s plan is to convert GBTC into a spot ETF fund as soon as possible.
Grayscale’s recent victory against the SEC seems to give the green light for this conversion. At the same time, the company’s success factor is reflected in GBTC’s premium, which has risen to -18 percent, representing the highest level since 2021. Historically, the premium reached its peak at 132,6 percent at the end of May 2017. The falling premium (or discount) has served as a leading indicator for bitcoin’s price in previous years.
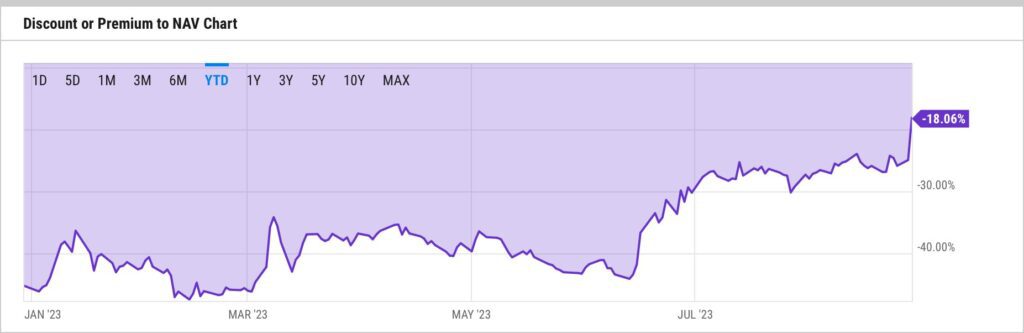
Source: YCharts
The recovering premium also reflects the changing paradigm of the market as bitcoin sails toward the spring 2024 halving event. Investors with a higher risk profile can still acquire GBTC shares at an “18 percent discount” and potentially benefit from the assumed ETF listing later on. This strategy, of course, assumes that the spot ETF gets approved, ceteris paribus.
The chart from Ecoinometrics illustrates the massive scale of GBTC, with the company holding a total of 635 236 Bitcoin units. In previous analyses, we have considered publicly-listed MicroStrategy as a leading indicator for bitcoin, although its treasury only holds 152 800 units (incorrectly reported in the chart).
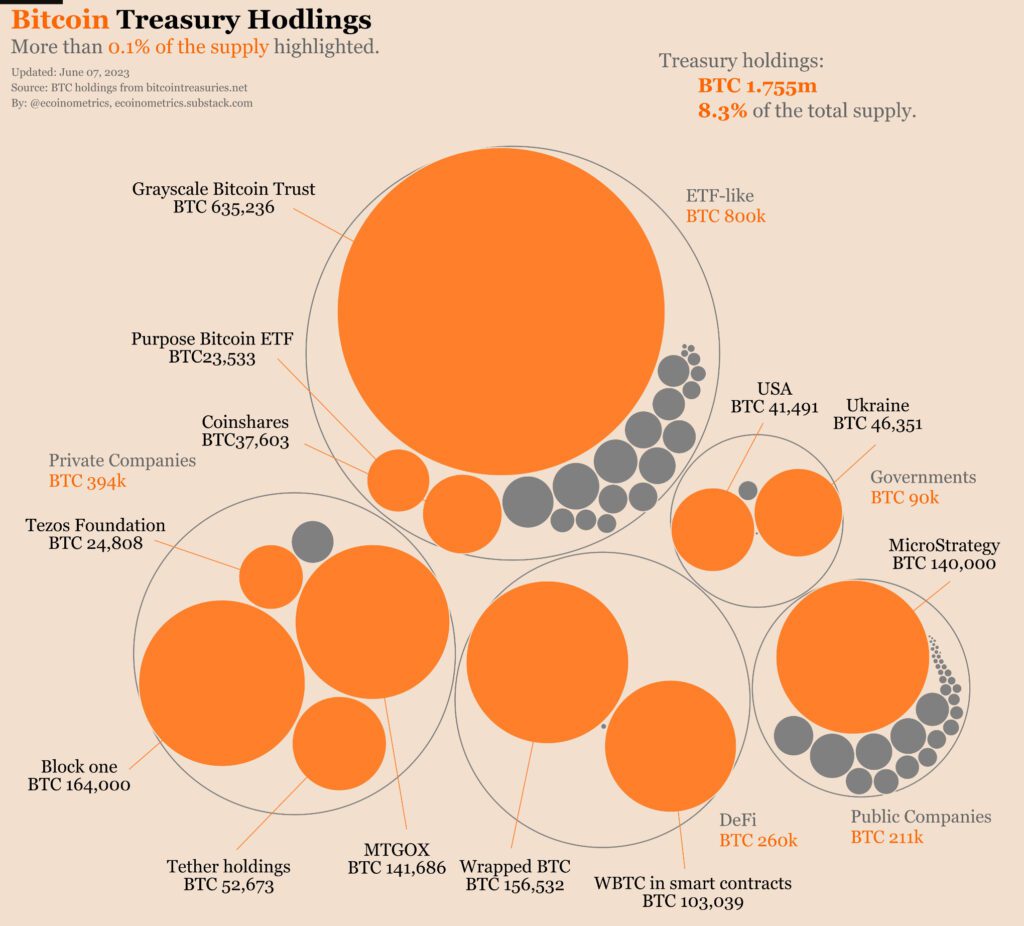
Source: Ecoinometrics
Do the UTXO Waves Foreshadow an Uptrend?
Satoshi Nakamoto originally designed Bitcoin as a transparent system. This inherent transparency enables in-depth exploration of the Bitcoin system through UTXO analysis. The age distribution of UTXOs, also referred to as HODL waves, provides a macro-level perspective on the entire Bitcoin network’s activity. HODL waves can be effectively studied by dividing them into six segments.
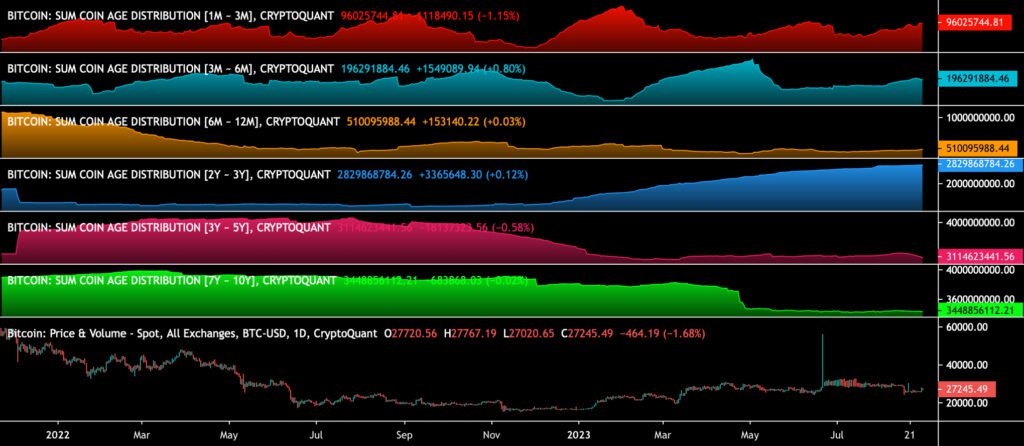
Sources: Timo Oinonen, CryptoQuant
The UTXO age distribution waves highlight the growth in short-term waves of 1M-3M (red), 3M-6M (turquoise), and 6M-12M (yellow). In previous years, it has been precisely the growth in these waves that has indicated a market bottom and upcoming growth cycles. Delphi Digital’s 2019 investment thesis was based on a similar UTXO analysis.
The long-term 7Y-10Y wave (green) has remained sideways for years, reflecting the perspective of very long-term Bitcoin holders toward the market. These extremely long-term holders provide fundamental support to the Bitcoin network and do not generate selling pressure, even in the face of significant volatility. In contrast, the 2Y-3Y wave (blue) shows clear accumulation, indicating the view of smart money and institutions. These investors are following an accumulation strategy similar to that of Michael Saylor.
What Are We Following Right Now?
Tether, known for its stablecoins, is expanding its operations into Bitcoin mining.
Read more: How did Norway become the largest Bitcoin mining hub in Europe?
Analyst Lyn Alden discusses the content and thought processes behind her recent book “Broken Money” in an interview with Peter McCormack.

Is the institutional money returning to Bitcoin? Fintech company Bakkt’s Gavin Michael shares his views.

Stay in the loop of the latest crypto events
- Aave: The DeFi Powerhouse Changing the Crypto Landscape
- Understanding market dynamics, cycles, and bubbles: Lesson #3
- The Halving Cycle Is Not Priced In
- Crypto Investing Made Simple: Lesson #1
- Price Projections for 2023 and 2024
- Understanding cryptocurrencies and the blockchain: Lesson #2
- Stellar Lumens — Unveiling a global digital payment protocol
- Fenergo FinTalks with Coinmotion Interim CEO Pasi Matilainen | Navigating Crypto Regulation
- Ripple (XRP): Empowering the future of digital currency

The views, thoughts, and opinions expressed in the text belong to the author and not necessarily to the author’s employer, organization, committee, or other group or individual.