


Big spike up, strong bull move and plenty of bear blood.
In a technical analysis a month ago I wrote that the moving average from 100 weeks (weekly SMA100) is a strong support and that I trust it quite a bit to stop the drop which realized at least on the weekly chart.
I also wrote that the weekly SMA20 is the obvious resistance where the price would go in the case of an up move and there this strong spike stopped.
I thought the same in the previous analysis too and warned not to trust the ‘bear flag’ pattern too much.
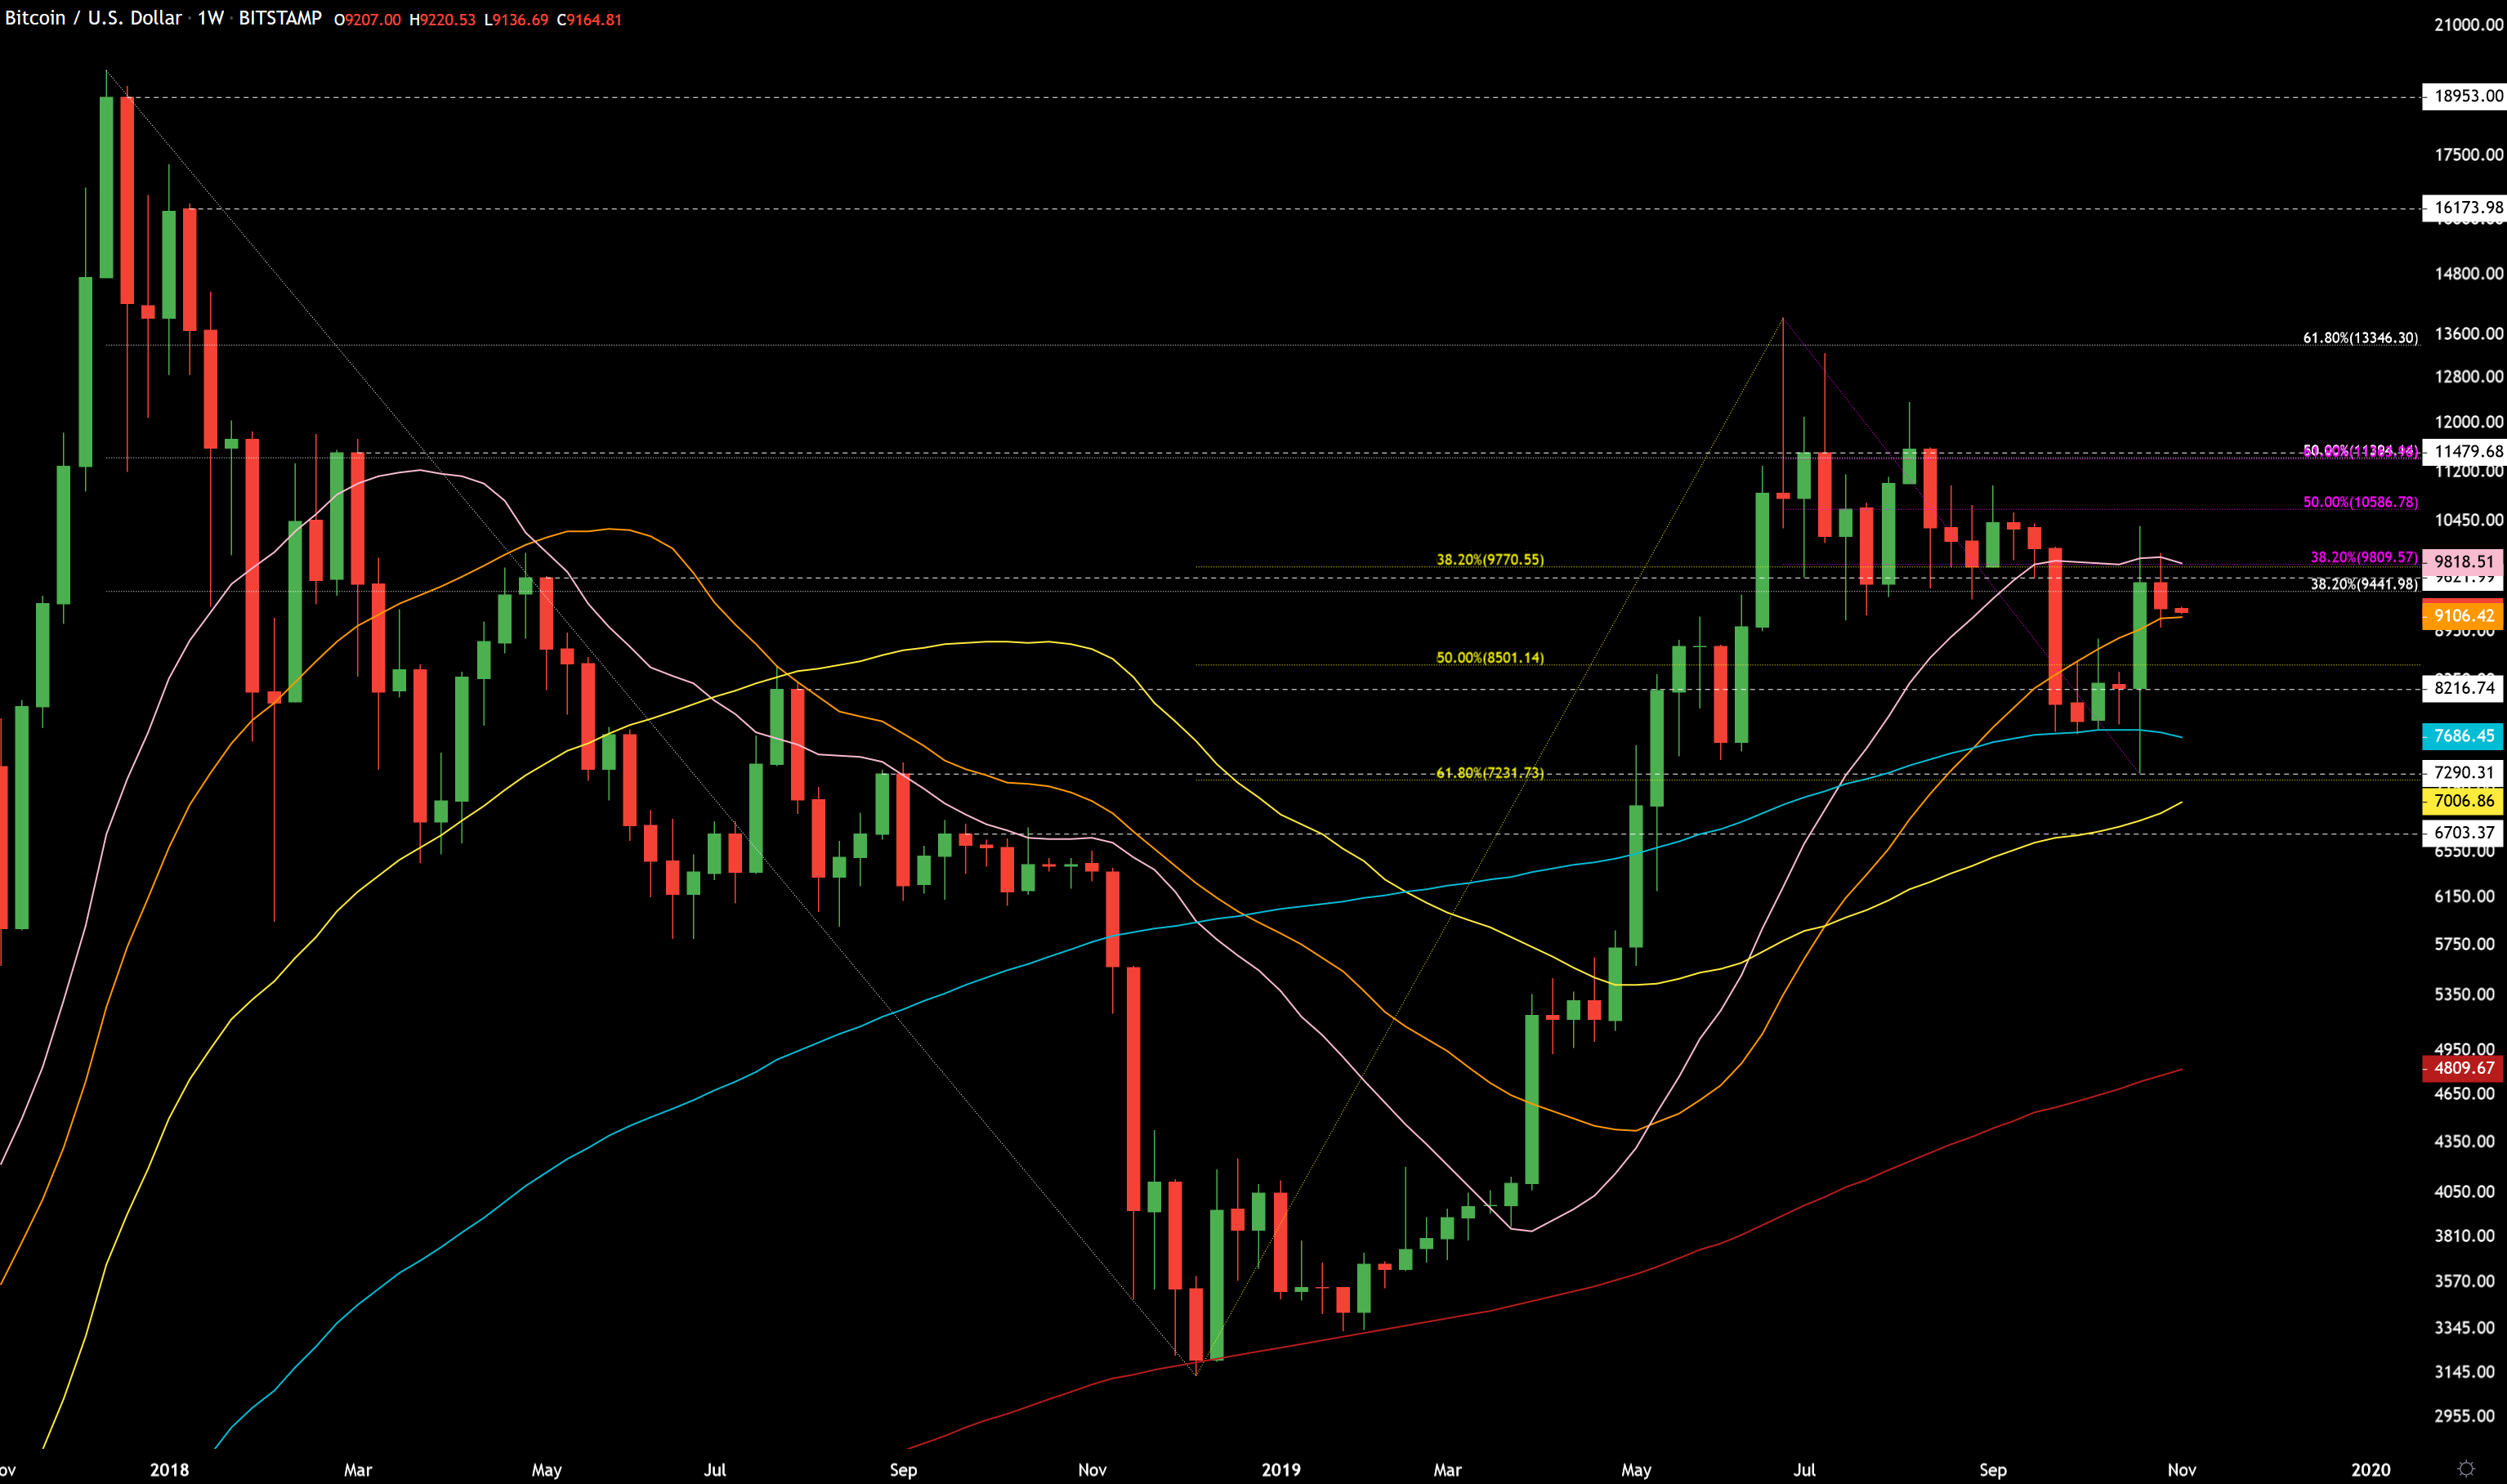
Weekly chart with pink weekly SMA20, orange daily SMA200, teal weekly SMA100, yellow weekly SMA50 and red weekly SMA200. There are also fibonacci levels from $20000 to $3100 (white), from $3100 to $13900 (yellow) and from the recent drop from $13900 to $7300 (purple). Then there are also few important horizontal lines from bear market tops with white dashed lines.
When the drop from above the weekly SMA20 started the price went right through the daily SMA200 and stopped at the weekly SMA100. Daily SMA200 acted as resistance level while price was finding its bottom. At the end we had a spike below the weekly SMA100 to yellow 62% fibonacci level and weekly horizontal level at about $7300, but weekly did not close below weekly SMA100. Instead we got a very nice reaction and closed way above daily SMA200.
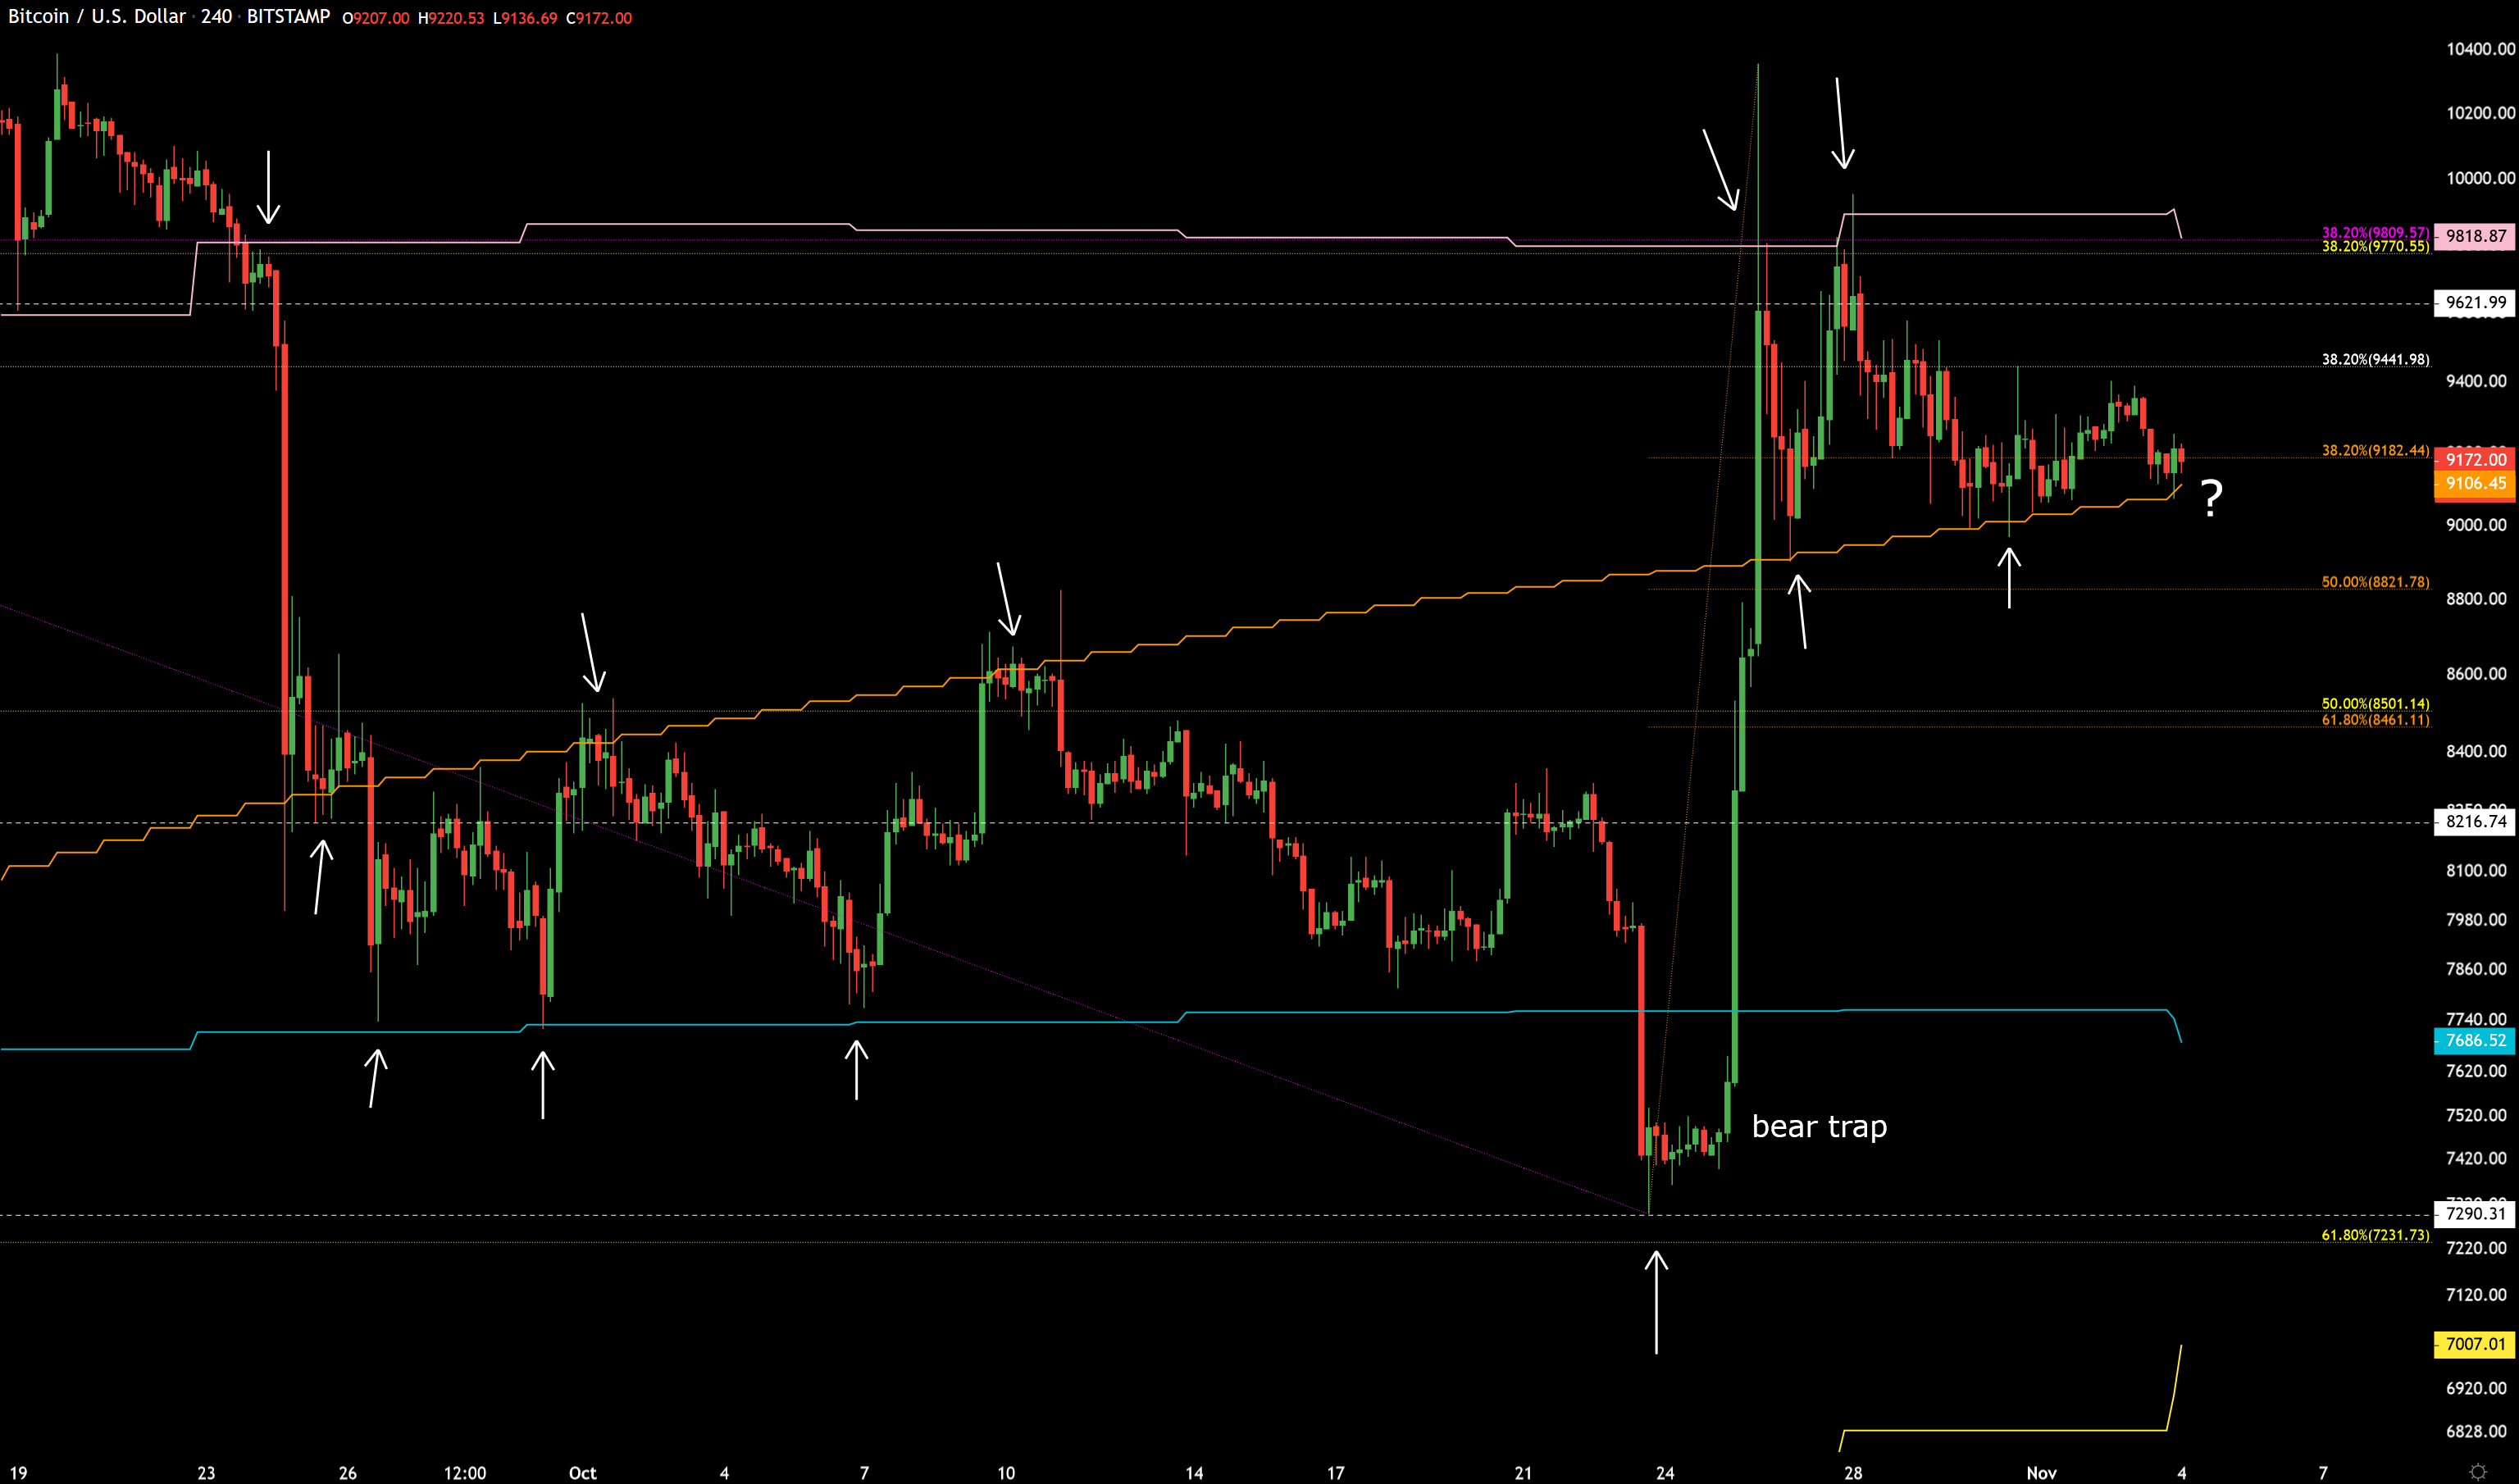
Same tools in 4H chart to show better how well these support/resistance levels worked during this price action. I added one more fibonacci level from $7300 to the recent top at $10350 (orange).
This was a strong move from $7300 and because of that probably the end of the correction from $13900. Now the question is when this smaller correction from $10350 is going to end. For now the daily SMA200 is holding nicely as you can see from the chart, but if it were to get broken then dump to $8800 to $8500 would probably end the correction.
Any strength up from here and we might very well get above the weekly SMA20 and that would mean probably strong buying. This buying might take us fast as high as $16000 in my opinion. You can see a weekly horizontal level there on the first chart.
The author has written over hundred bitcoin analyses in the span of five years and is very experienced in trading bitcoin.