

Unspent output from bitcoin transactions, or UTXO, offers notable possibilities for analysing the cryptocurrency market. Inside the bitcoin blockchain, every transaction creates a new UTXO, and the certain age of UTXO shows the block that the transaction was firstly included in. UTXO data can be utilized to track buying and selling patterns in the previous, current and upcoming market cycles.
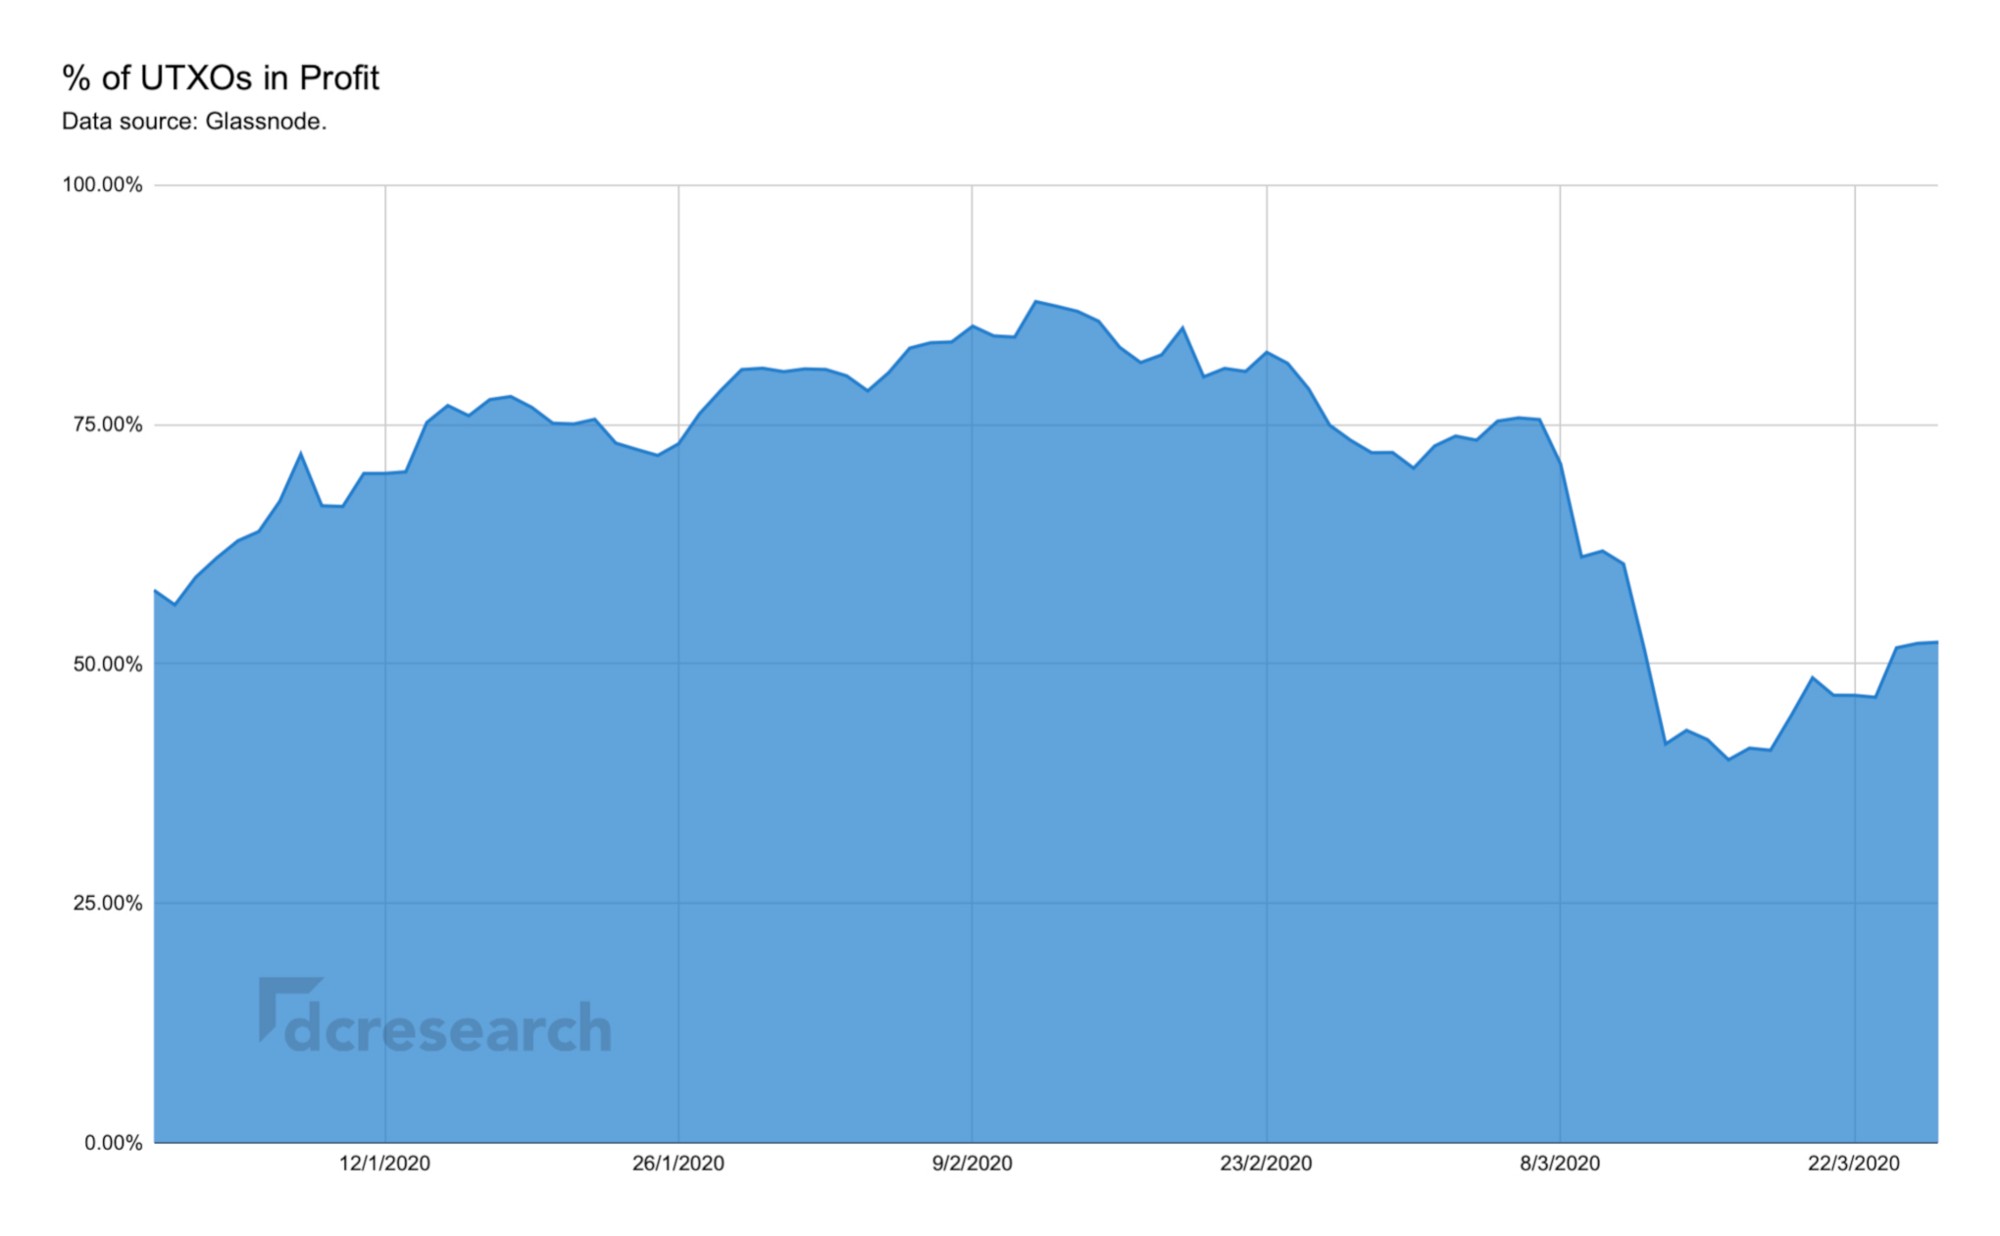
Recent data by Glassnode shows a majority of UTXOs being in profit, despite the early March BTCUSD meltdown. Over mid-February >75 percent of UTXOs were estimated to be in profit.
“Hodl Waves”, firstly showcased by Unchained Capital, calculate the age of a specific Bitcoin UTXO, meaning when it was last used in a transaction. A Hodl Wave is a time frame when many accumulated bitcoin and put them into cold storage. There have been 3 to 4 such mass accumulations with a large amount of UTXOs which have not moved since.
When exploring UTXO data, the trend clearly shows rapid growth in the UTXO line corresponding with uptrends and downtrends. As we saw at the end of 2017, continued price appreciation leads to a rapid influx of new users and fresh investments into bitcoin.
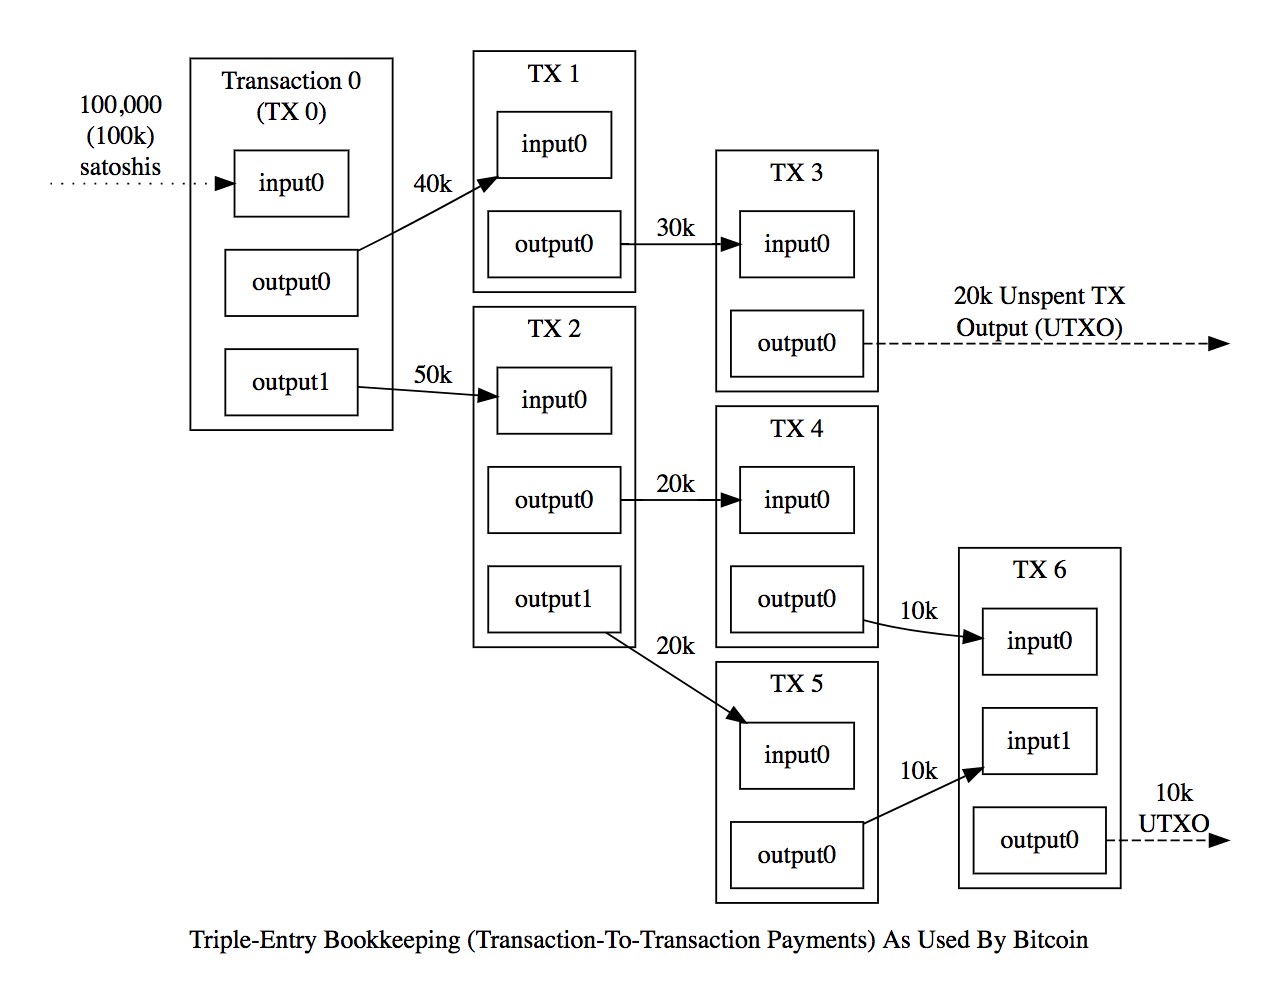 Each time bitcoins are sent, the network creates a new UTXO. The age of UTXO points to which block the particular transaction was first added and representing the last time when said bitcoin was moved. UTXO data allows bitcoin analysts to track the last time coins have moved.
A drop in cumulative UTXO age usually renders to increase in bitcoin activity. A rise in cumulative UTXO age represents more holding in the market, as smart investors typically accumulate when price decreases. The correlation between UTXO bands and BTCUSD is a relevant indicator for forecasting bitcoin market cycles.
UTXO Analysis
Let’s analyze different UTXO bands and their correlation with bitcoin’s price (BTCUSD) by historical data. We analyzed four UTXO bands during major market trends from 2013 to 2020.
As bitcoin’s price increases, UTXO age bands increase respectively, indicating accumulation and growing amount of bitcoin holders. Vice versa, as BTCUSD decreases, the amount of holders usually decrease along with sell-offs and investor capitulation.
2013 Q3-Q4
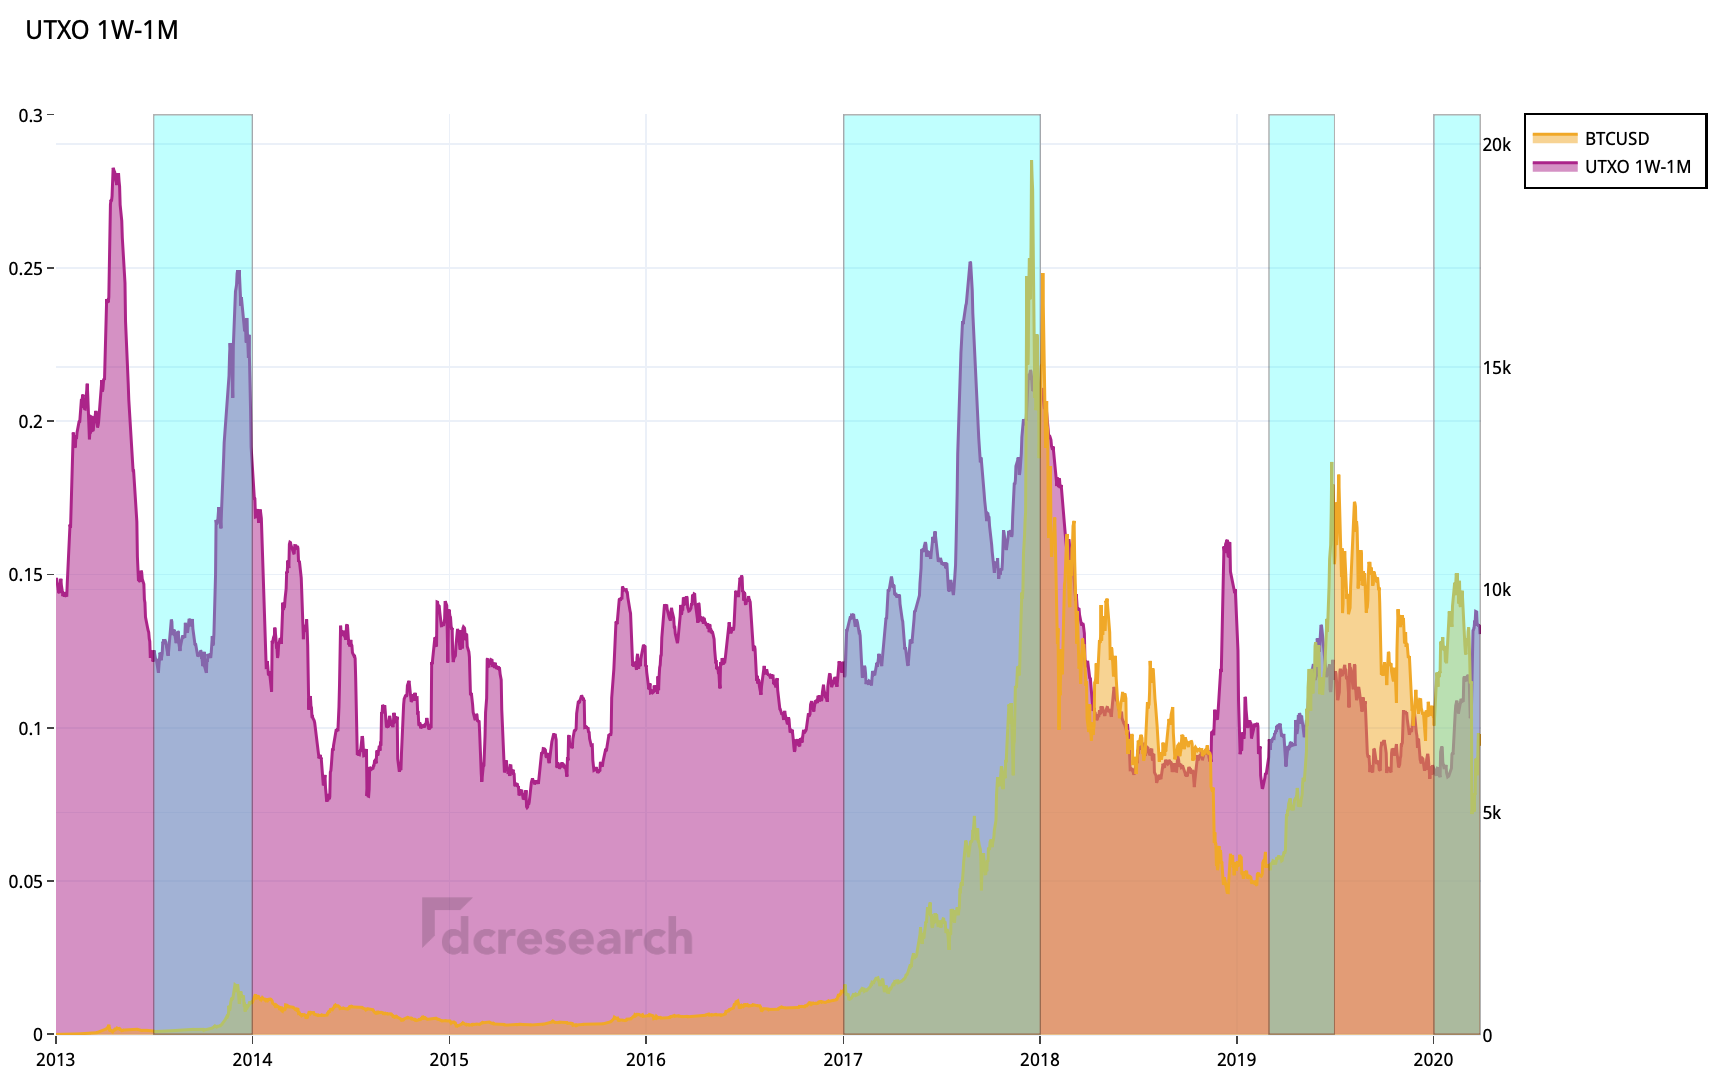
The UTXO data shows a clear correlation between 1W-1M UTXO band and BTCUSD in 2013 Q3-Q4 bull market. In late 2013, BTCUSD reached >1000$ for the first time after rising over 5000 percent. The amount of holders quickly increased with BTCUSD uptrend and accordingly decreased with downtrend.
2017–2018 YoY
USDBTC correlated with 1W-1M UTXO band in 2017–2018 ascent, fuelled by a huge inflow of retail investors and the emerging ERC-20 token market. UTXO band shows steady accumulation through 2017 and subsequent sell-off.
2019 Q2-Q3
After the late 2018 capitulation. 1W-1M UTXO band had a positive relationship over the second and third quarters of 2019.
2020 Q1-Q2
1W-1M UTXO band was correlated with BTCUSD anew during first and second quarters of 2020. BTCUSD has been reaching new highs again in Q2 as the market tries to price in the upcoming halving event. Early 2020 UTXO band shows accumulation and increasing holding with BTCUSD pointing up.
2013 Q3-Q4
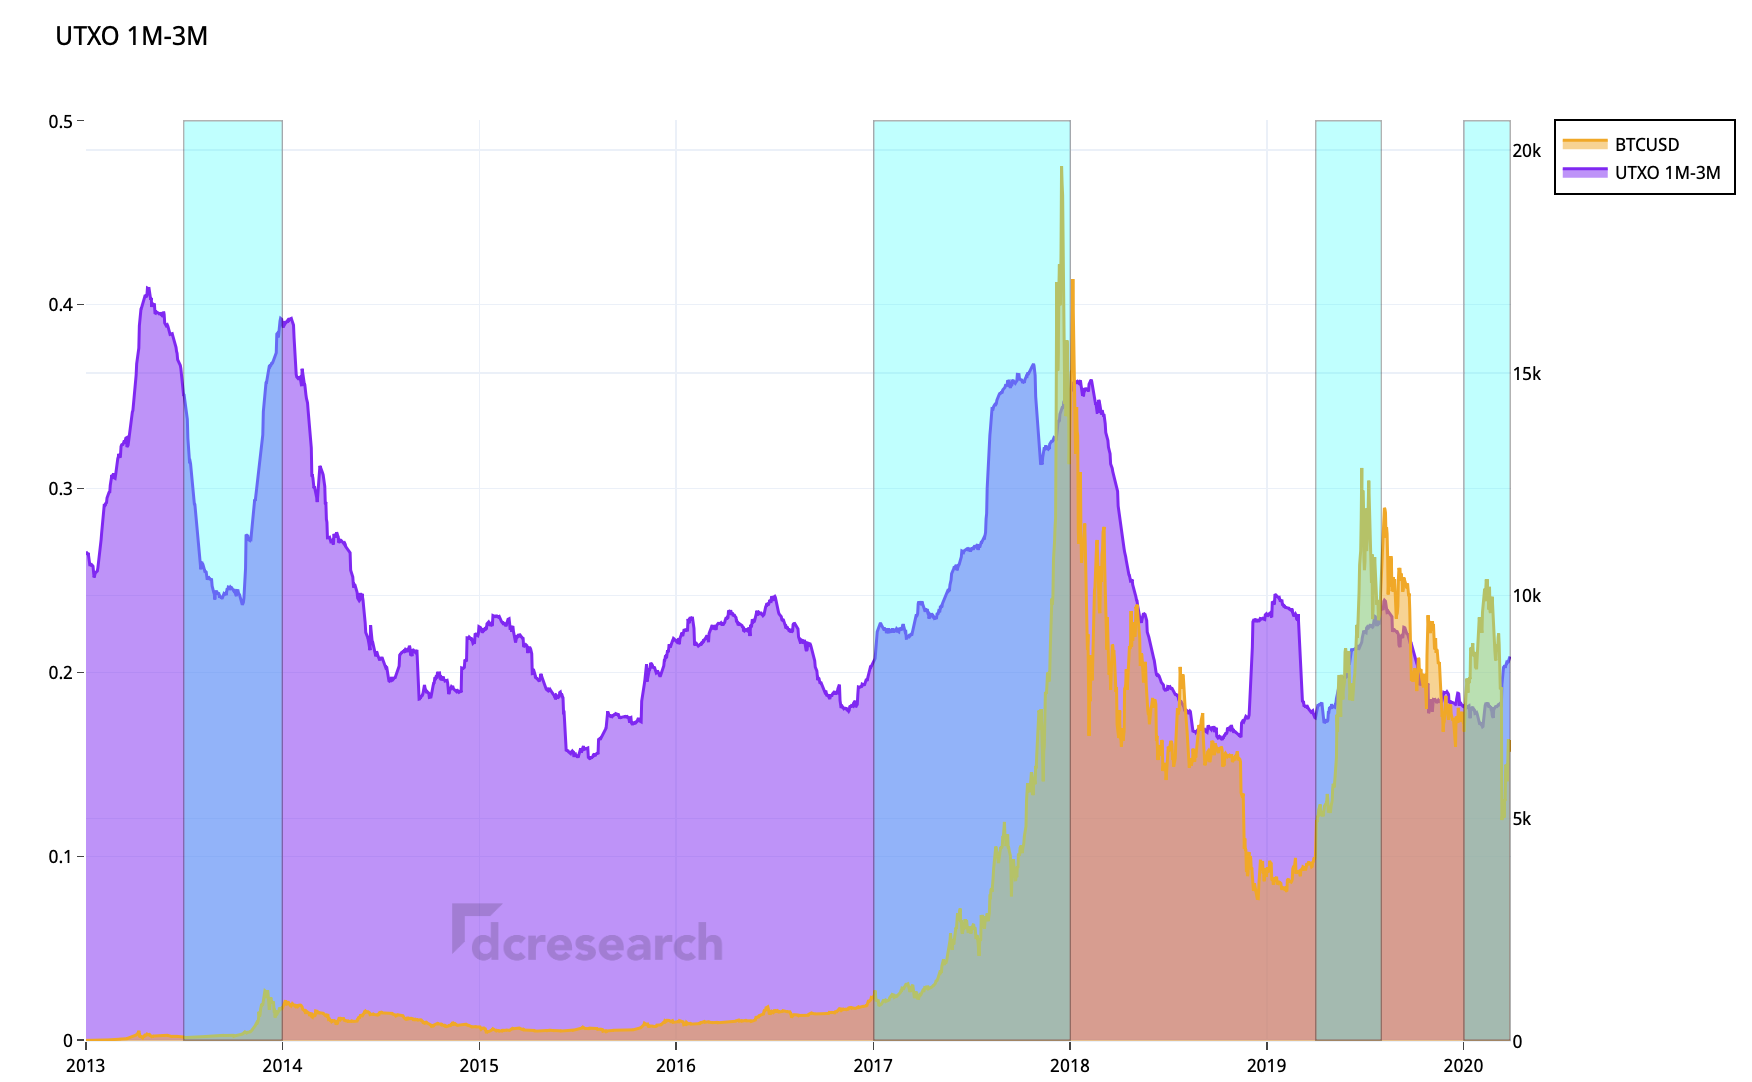
1M-3M UTXO band showcased notable correlation with BTCUSD over 2013 Q3-Q4. 1M-3M also correlated with early 2013 price consolidation.
2017–2018 YoY
2017 uptrend saw 1M-3M UTXO band and BTCUSD in notably positive relationship. 2017 uptrend lured in many new holders.
2019 Q2-Q3
1M-3M UTXO band reacted to late 2018 price capitulation, rising around the BTCUSD bottom, indicating 2019 accumulation.
2020 Q1-Q2
Correspondingly to other UTXO bands, 1M-3M UTXO correlated with BTCUSD price after bottoming in Q1.
2013 Q3-Q4
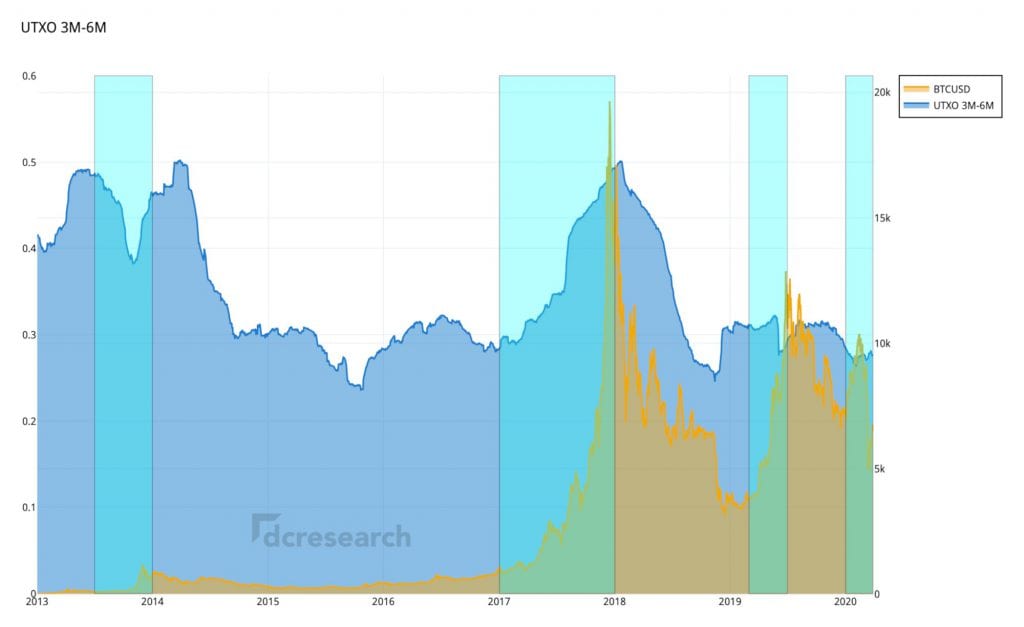
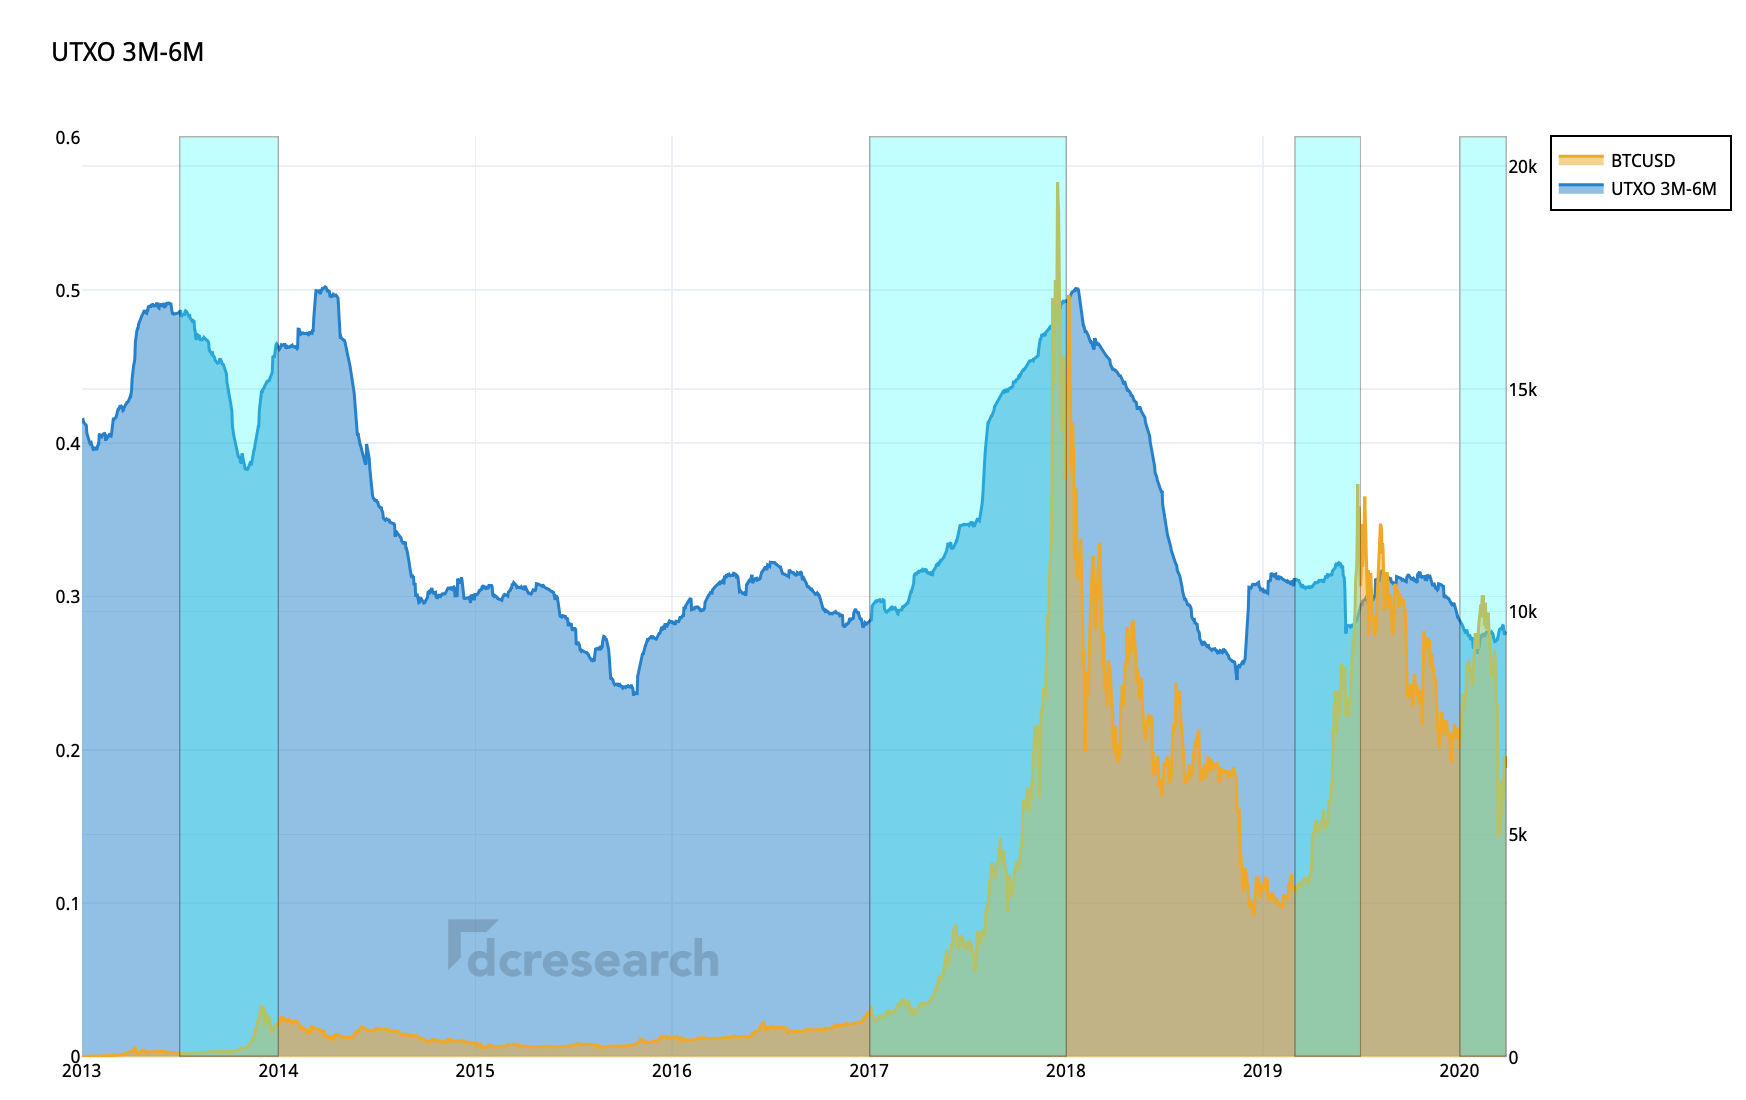
Like younger UTXO bands, 3M-6M UTXO formed a double top pattern over 2013–2014, rising with early 2013 build-up and later upflow past $1000.
2017–2018 YoY
3M-6M UTXO was positively correlated with 2017 BTCUSD bull run.
2019 Q2-Q3
3M-6M UTXO stayed relatively steady during mid-2019, after rising with late 2018 capitulation.
2020 Q1-Q2
With BTCUSD reaching a bottom during mid-March, 3M-6M UTXO is pointing slightly upwards again.
2013 Q3-Q4
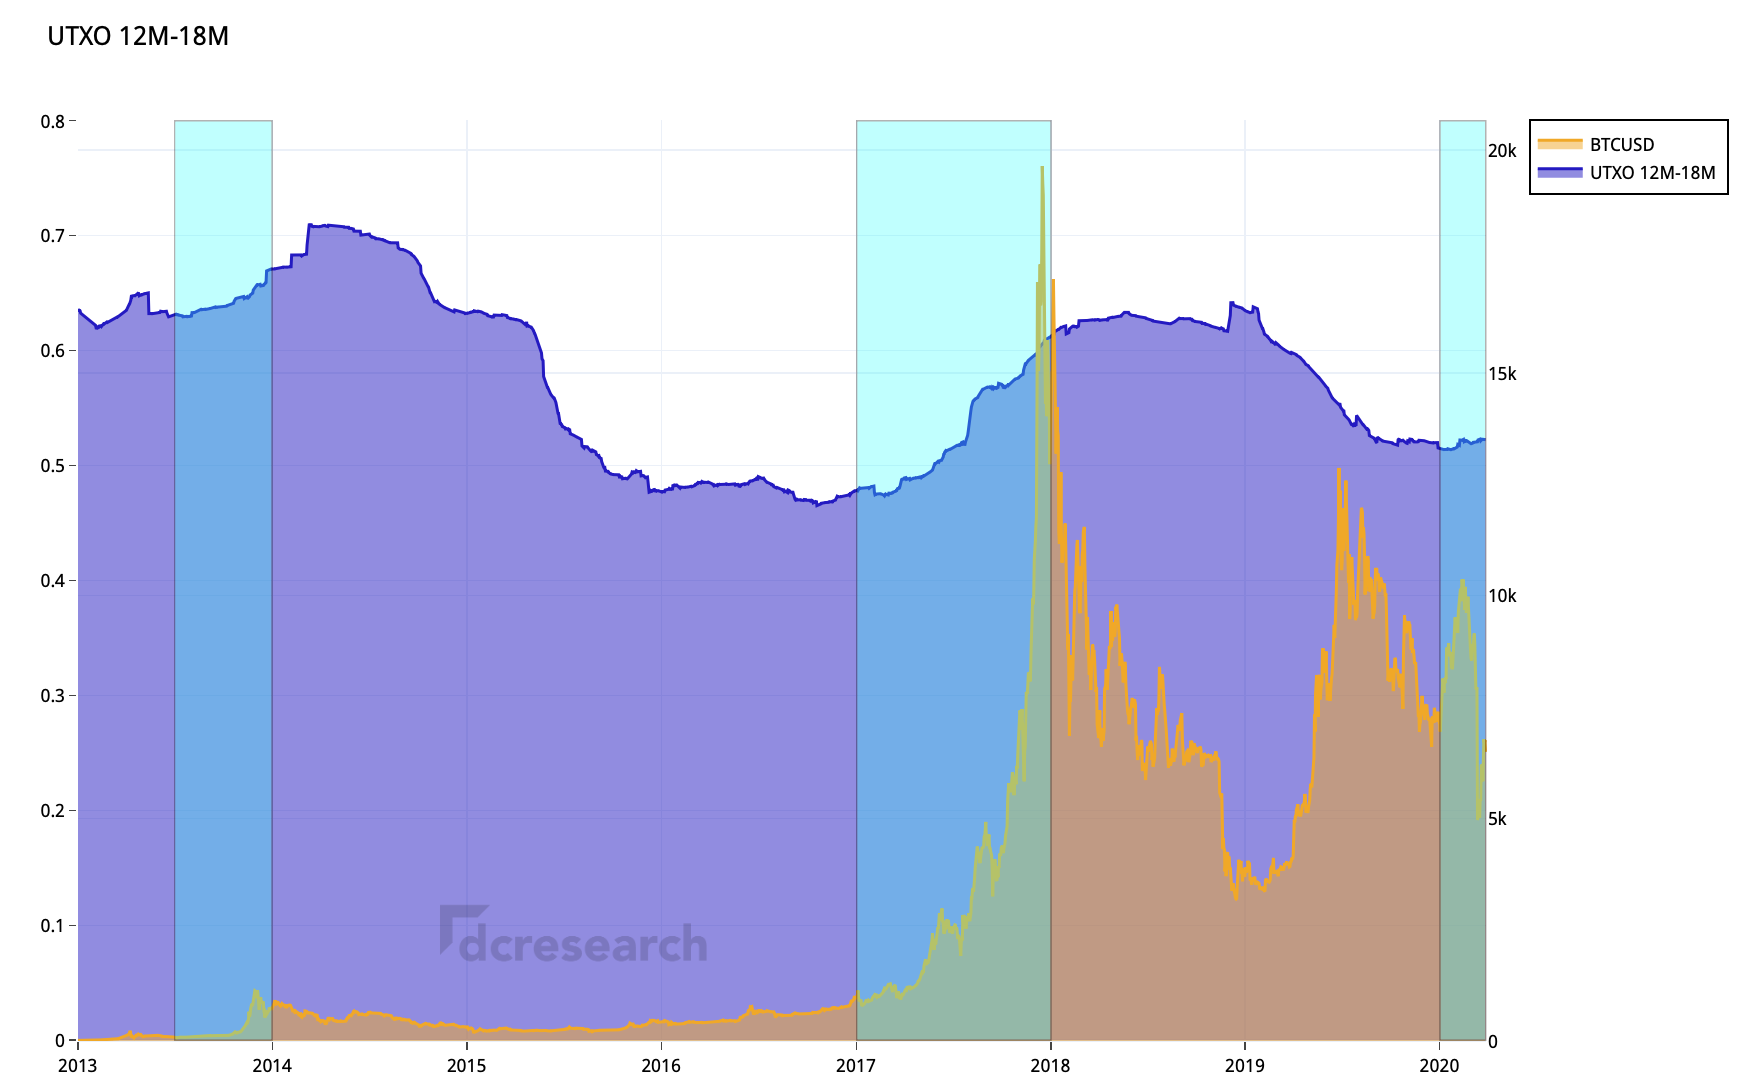
12M-18M UTXO band showed positive correlation with BTCUSD in 2013 uptrend.
2017–2018 YoY
Respectively, 2017–2018 season represented a accumulation pattern for longer term bitcoin investors.
2020 Q1-Q2
Early 2020 and H1 show slight accumulation of bitcoin and correlation with BTCUSD. Possible beginning of a bull market in close proximity to 2020 halving.
Bitcoin Re-Accumulation
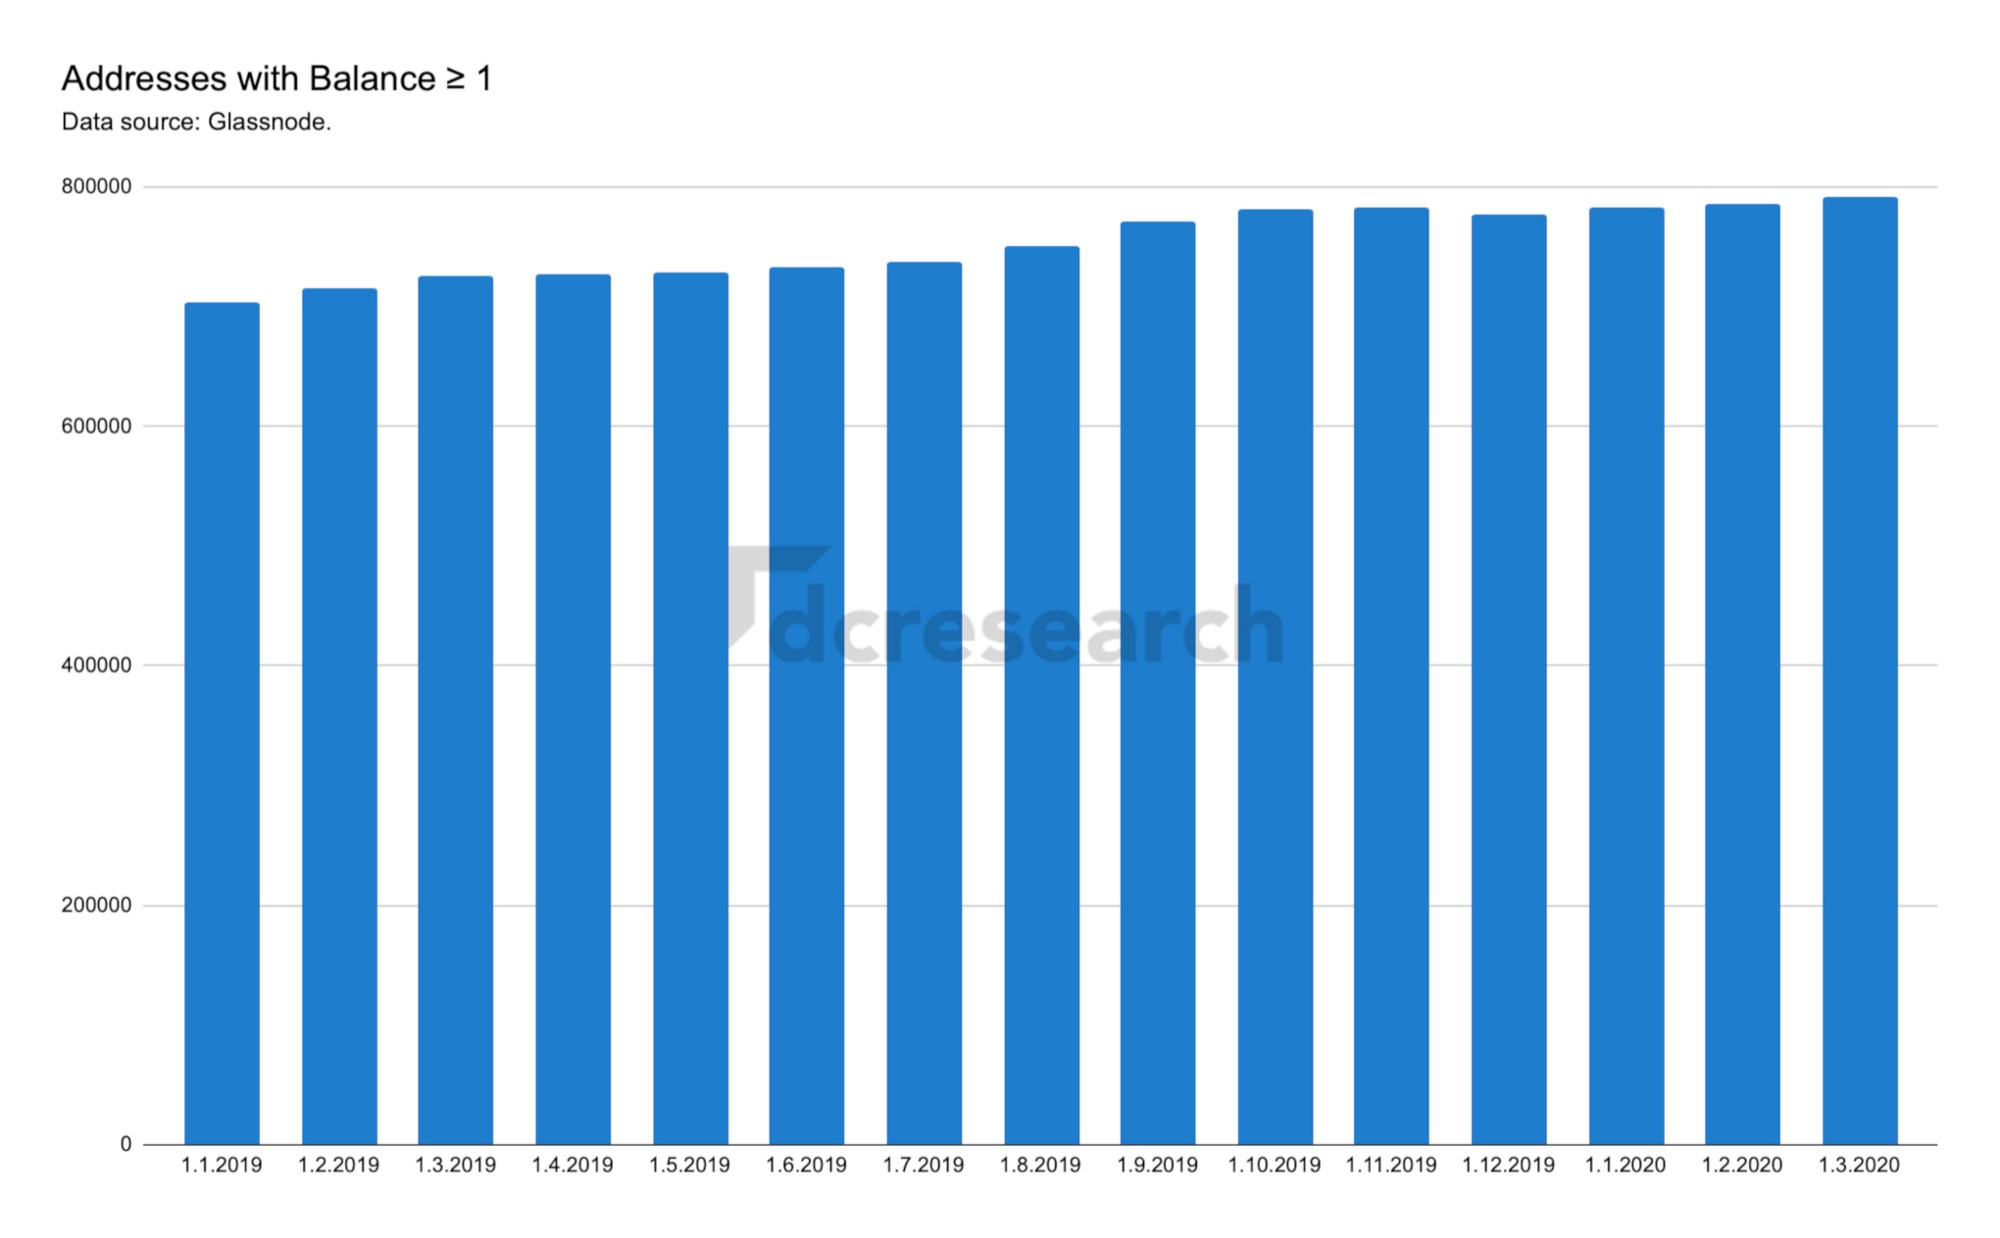
2019-2020 data shows retail investor segment accumulating bitcoin, as the amount of addresses containing from 0,01 to 1 bitcoin or more, has grown from 2019 into H1 2020.
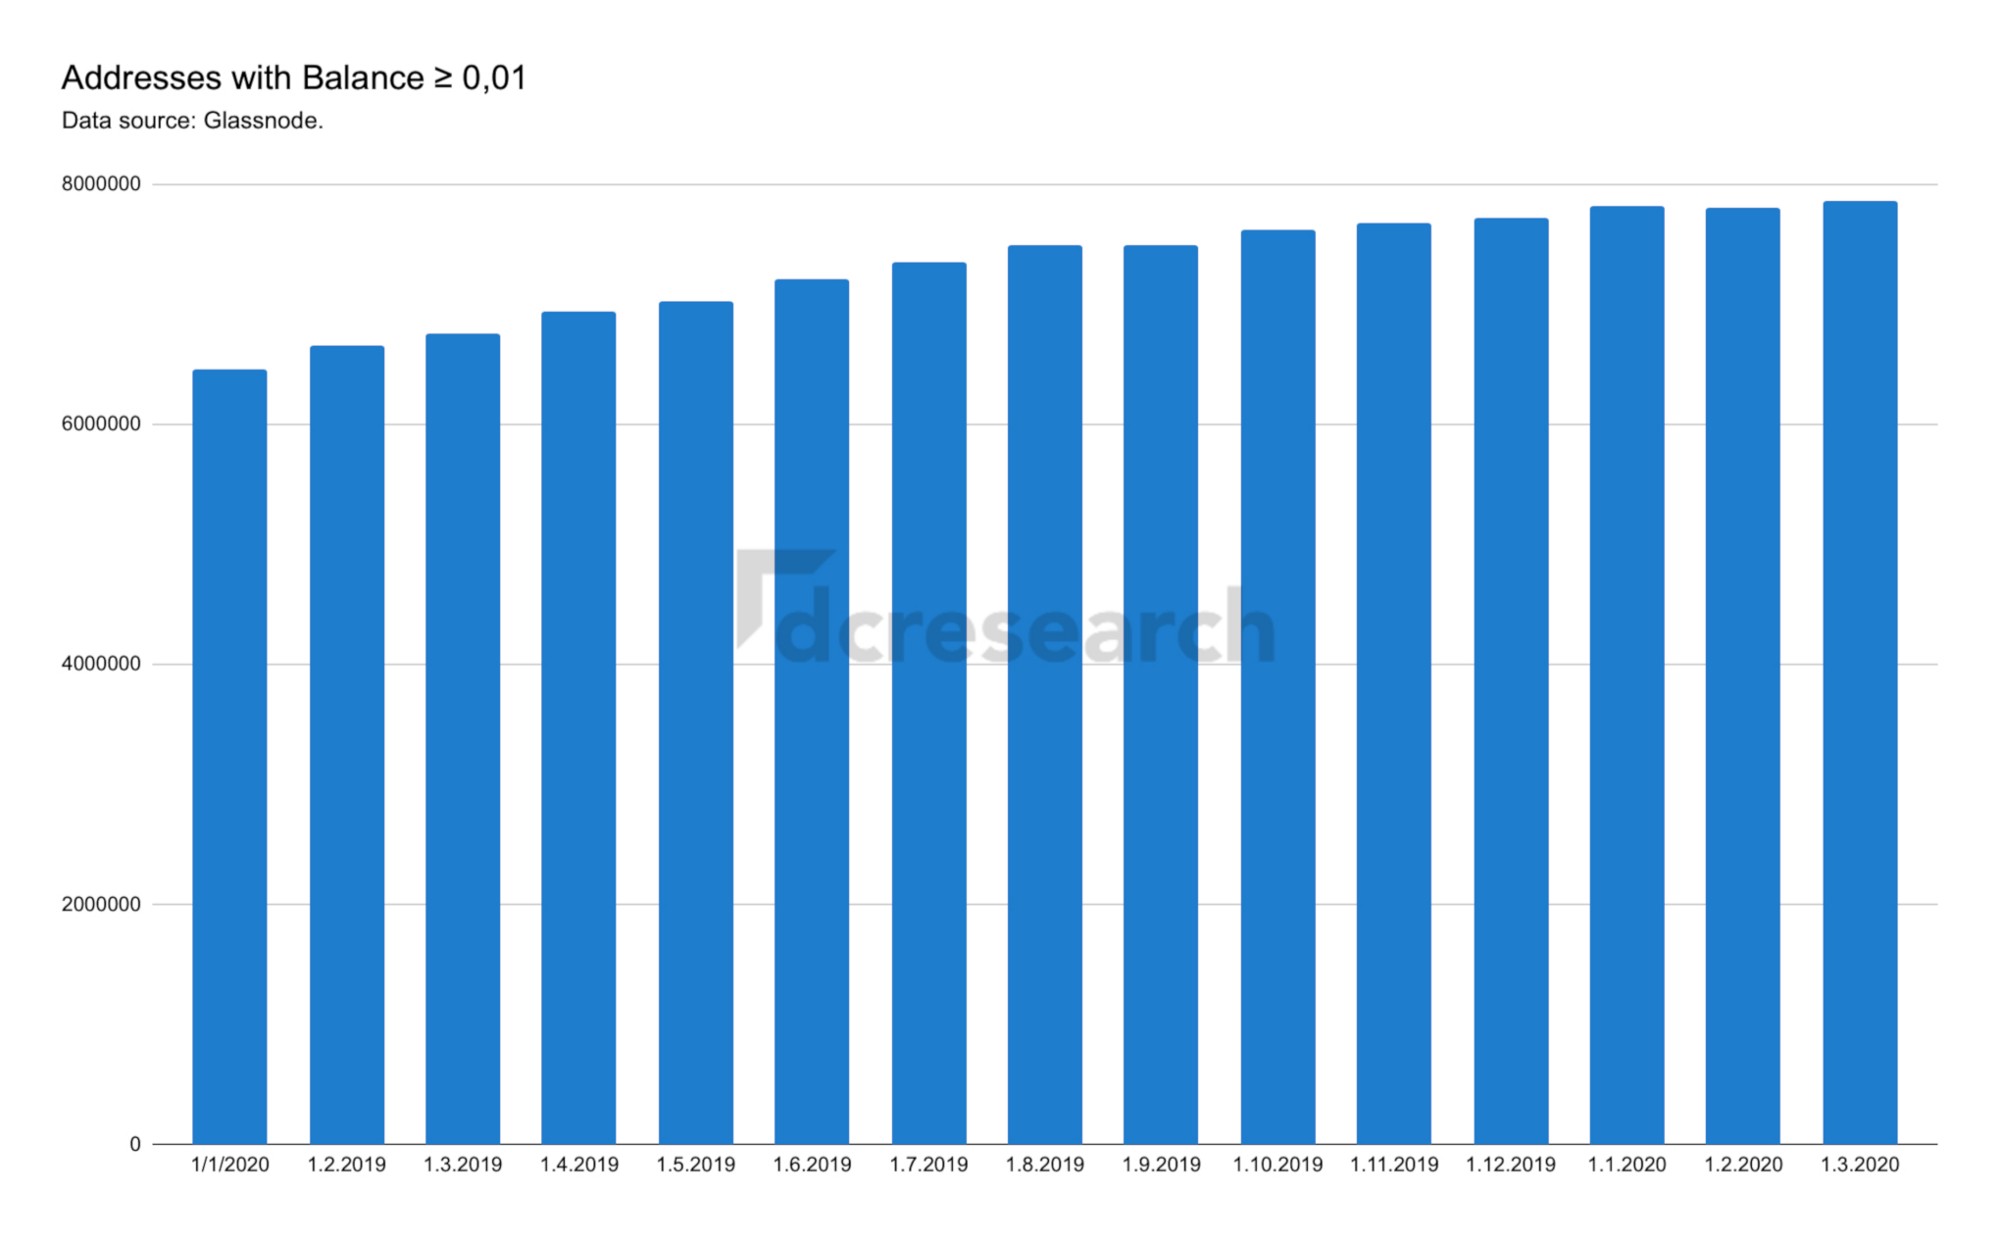
The growing amount of small addresses supports the pattern indicated by UTXO and BTCUSD correlation: Weakening selling pressure and retail investors accumulation.
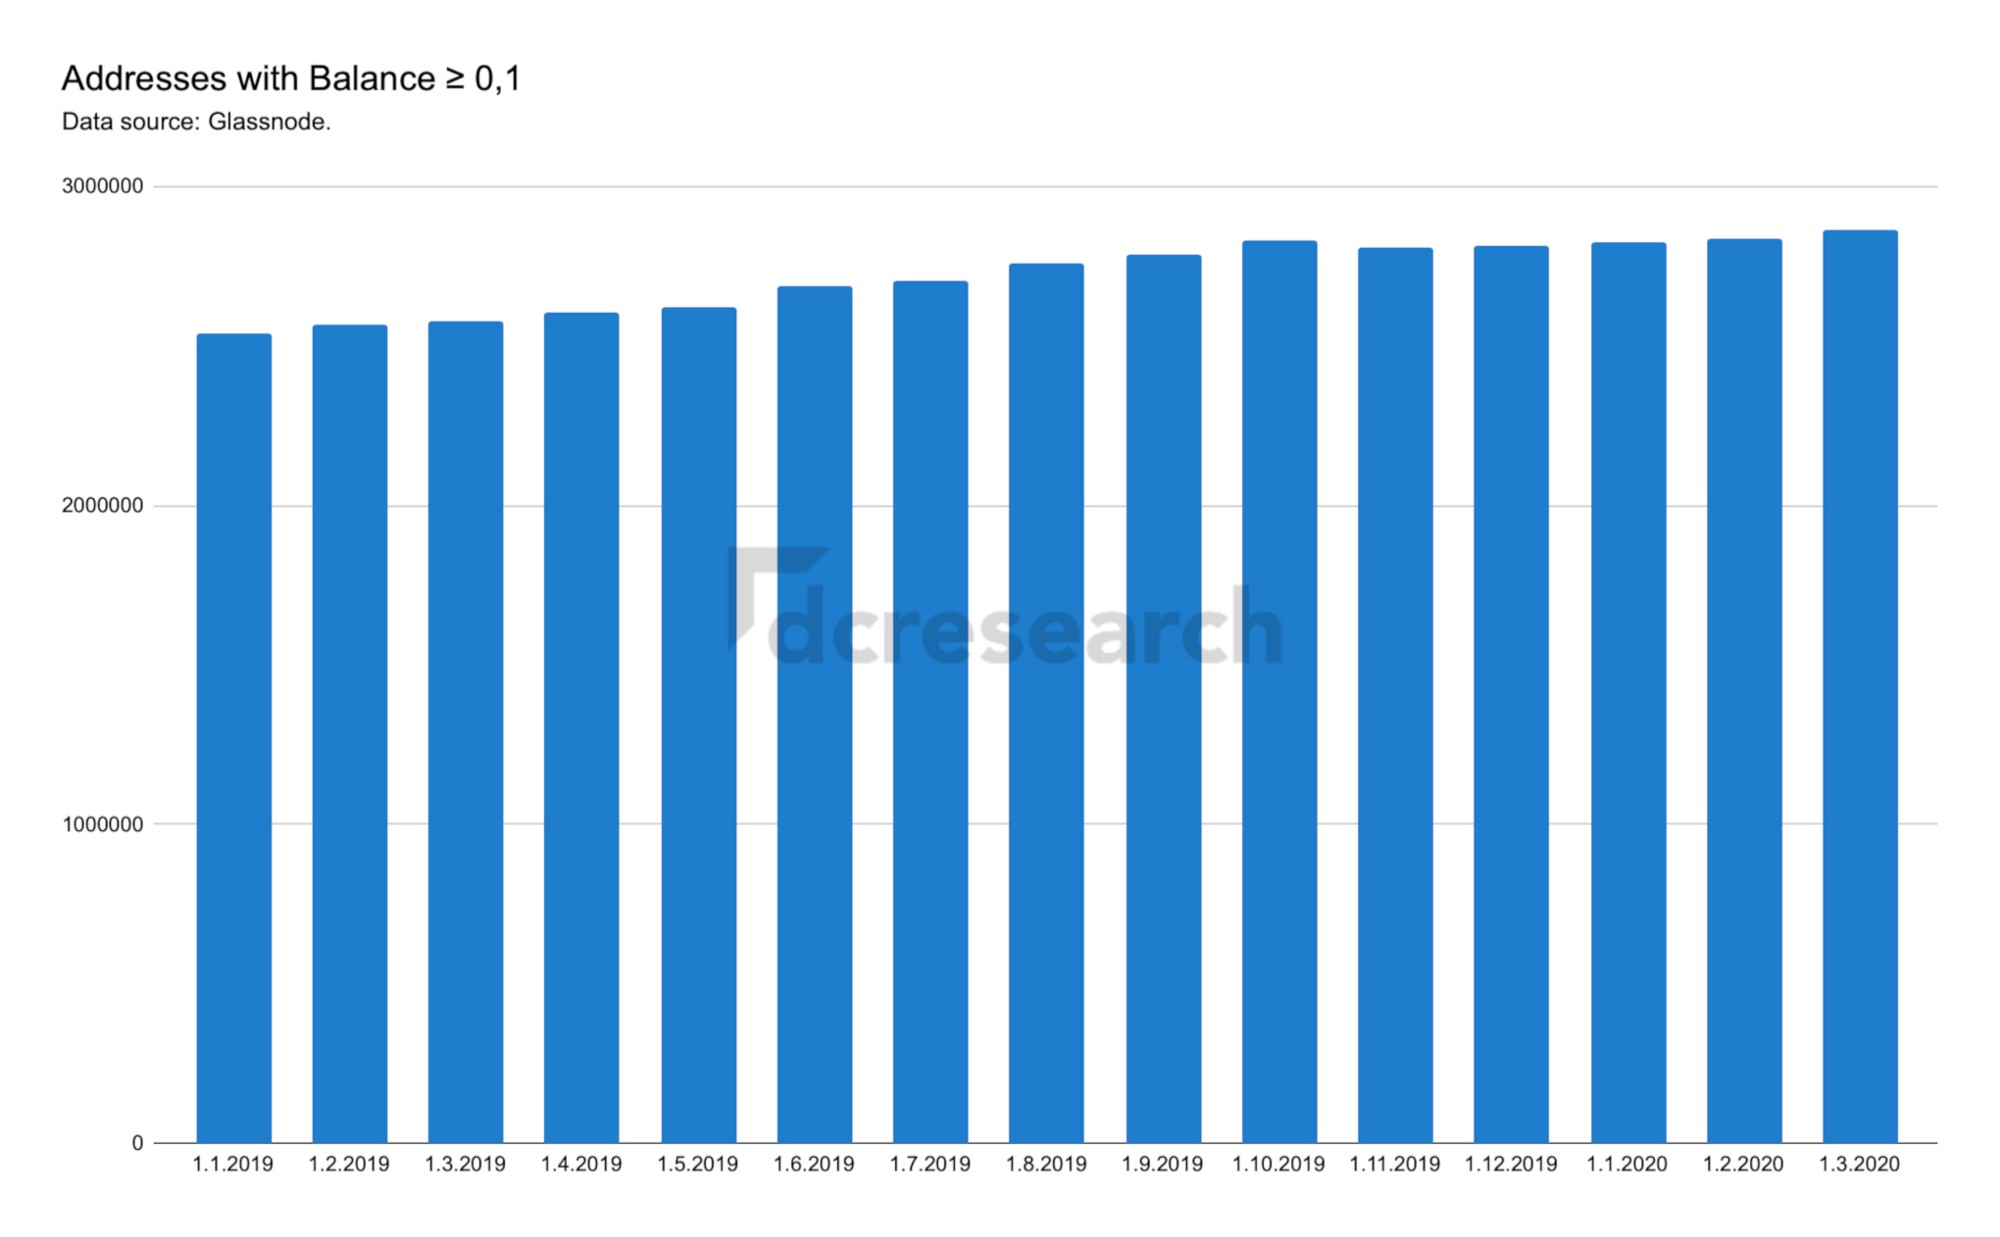
The amount of small addresses also indicates growing segment of investors buying small amount of bitcoin, for the first time.
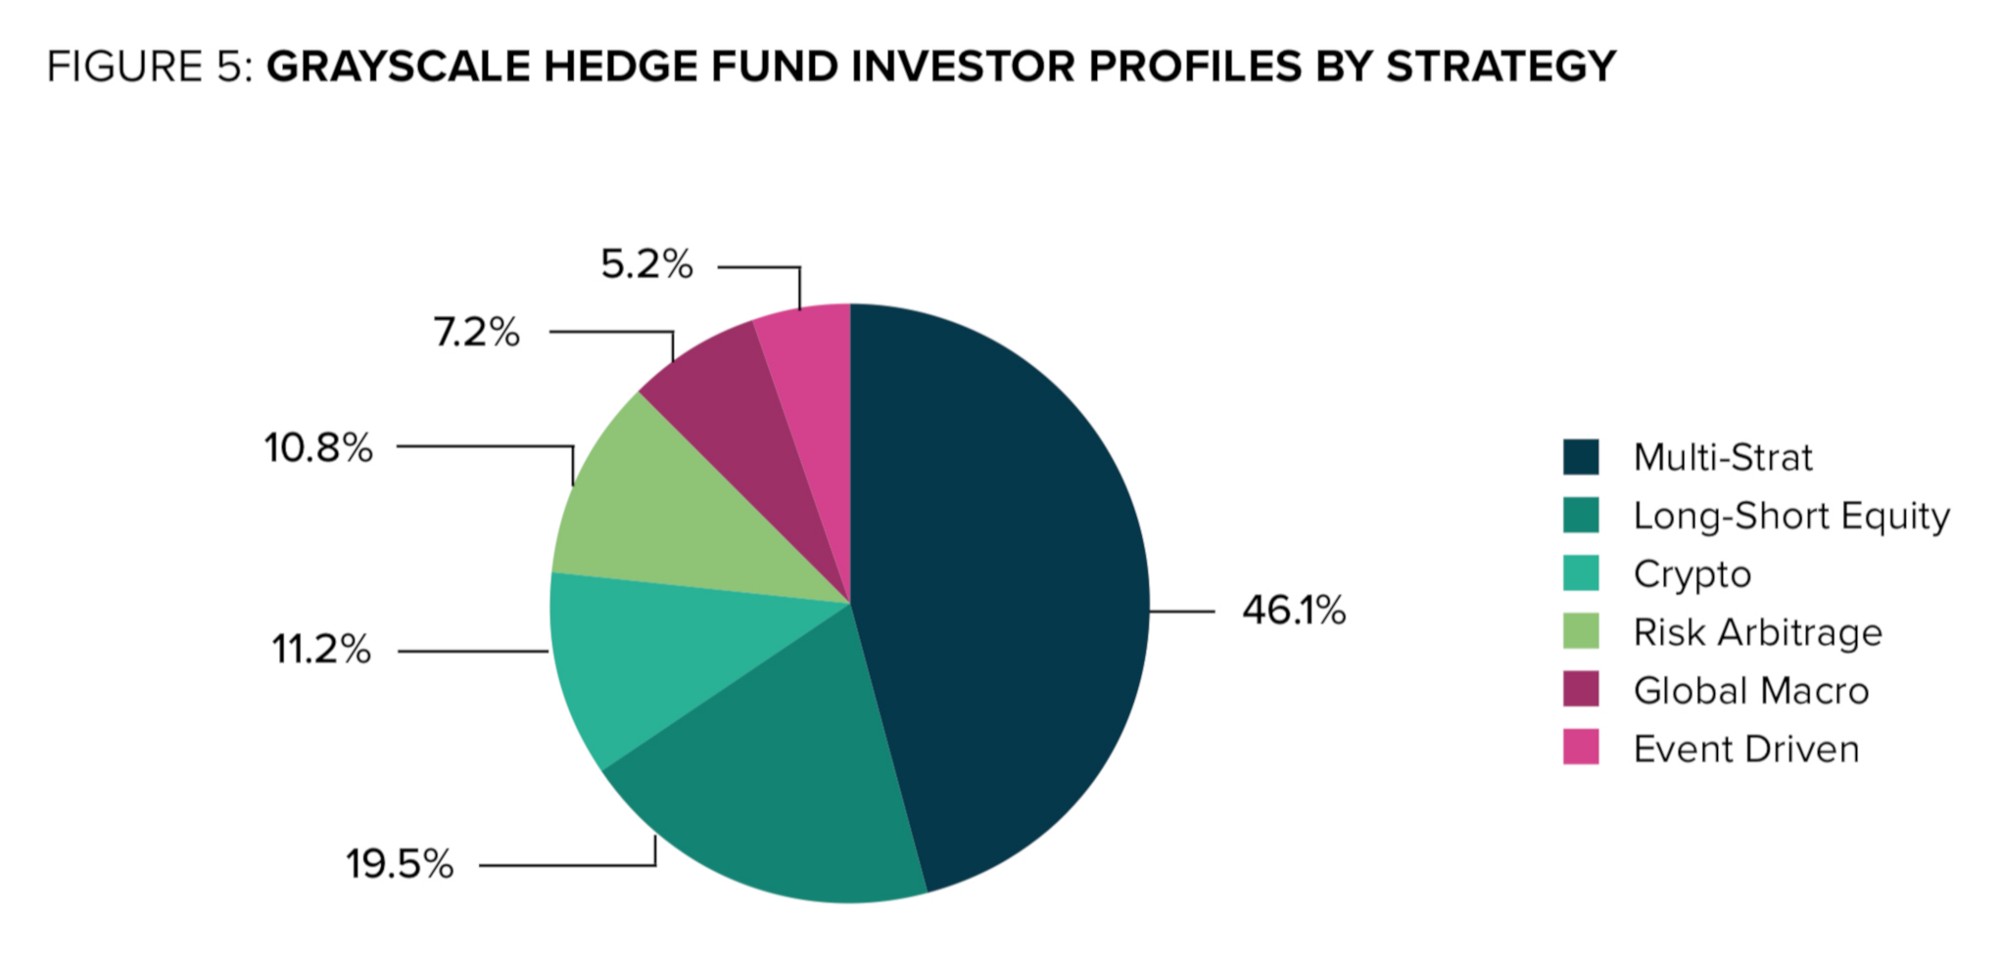
In addition to increasing retail investors, institutional interest is growing. Over the first quarter of 2020, 88% of Grayscale’s investors were institutional, including a large share of hedge funds. A majority of these hedge funds were multi-strategy (46,1%).
Renaissance Technologies, one of the largest hedge funds globally, has shown interest in the bitcoin futures market. The firm announced their Medallion Funds are now permitted to enter into bitcoin futures transactions. The firm would limit its trading activities to contracts traded on the CME, for now.
https://files.adviserinfo.sec.gov/IAPD/Content/Common/crd_iapd_Brochure.aspx?BRCHR_VRSN_ID=636807.
Summary
- Construing UTXO age distribution allows for pinpointing crucial bitcoin market cycles.
- By historical data, multiple key UTXO bands are correlated with BTCUSD price movements.
- Most recent early 2020 UTXO and price data shows distinct re-accumulation.
- Address sizes between 0,01 and 1 BTC indicate escalating accumulation in retail segment.
- Institutional investors, i.a. Renaissance Technologies LLC, are entering the industry.
— — —
Data sources: Coin Metrics. dcresearch. Glassnode. Grayscale. Renaissance Technologies. SEC. Unchained Capital.
Author: Timo Oinonen. Twitter. LinkedIn.
Feedback / questions? Ping me -> [email protected].
Follow dcresearch on Twitter -> twitter.com/dcresearch_io.
Originally published in Medium.