

Coinmotion Quarterly Report Q3 2022
Web 3 - The creators strike back
Table of Contents
ANTIFRAGILE BITCOIN
Despite the prevalently bearish landscape of the second quarter of 2022, the third quarter included many signs of new hope for digital assets. The decentralized finance platform Ethereum excelled particularly well in the third quarter, gaining 31,8 percent. Bitcoin was able to strengthen its spot price by 3,7%.
The strong performance of digital assets is especially impressive posthac the technology-related stock decline. In late October, Meta Platforms, formerly known as Facebook, weakened by almost -20 percent. And Snap, which develops social media platforms, fell -30% in early quarter four. Cryptocurrencies are seemingly decoupling from the correlation of favorite technology stocks. [1]
Q3 2022 Performance
Data source: Bloomberg
No Data Found
Q3 2022 Performance
Data source: Bloomberg
No Data Found
Although many popular technology stocks have fallen significantly, the Nasdaq Composite only weakened by -3,9 percent compared with S&P 500’s -4,9 % decline. Crude oil prices fell -24,8 percent, and the alleged “safe haven” gold weakened by -8,11 in Q3. Gold’s drop is notable in its historical perspective and truly questions its investment narrative.
THE ANNUAL TRANSFER VOLUME
Bitcoin’s on-chain transfers have reached $14 trillion in 2022 so far, rising above 2021’s 13,1T. This data excludes exchange trading volume. Bitcoin is on track to increase its year-to-year transfer growth by over 30 percent in 2022, as we can expect the total transfer volume to reach $17 trillion.
Bitcoin: Annual Transfer Volume
Source: Glassnode
No Data Found
Bitcoin: Annual Transfer Volume
Source: Glassnode
No Data Found
Bitcoin’s growing transfer volume mirrors the staying power of the Bitcoin network, despite the macro-induced price fragility. Compared with 2017’s 2,7 trillion transfer volume, the volume in 2021 increased almost five times.
If you believe that money should be controlled by the state, then nothing in crypto will ever make sense to you.
Naval Ravikant
SEASONAL COMPOSITION
Markets have made it past September’s tough seasonality and are now entering a period of historical positive returns: Q4. In the last 10 years, October, November, and December have fared better than September for both bitcoin and the S&P 500.
Bitcoin’s average return throughout the 2012 – 2021 calendar years of 22,3% for the month of October compares to a loss of 3,6% in September, while the S&P 500 averages 1,3% in October and a -0,4% loss in September in the same period.
Bitcoin: Seasonal Composition
Source: Coin Metrics
No Data Found
Bitcoin: Seasonal Composition
Source: Coin Metrics
No Data Found
For the full fourth quarter, bitcoin averages a 97,5% gain versus Q3’s average of 15,3%, while the S&P 500 averages 4,6% in Q4 versus 2,9% in Q3. This is through the same 2012 – 2021 period. Given that this has been a tough year for markets, seasonality may support renewed positivity in a world of negative sentiment. Seasonals as a potential “invisible hand” paired with any improvements in macro stress factors could set the tone for positive performance in the fourth quarter.
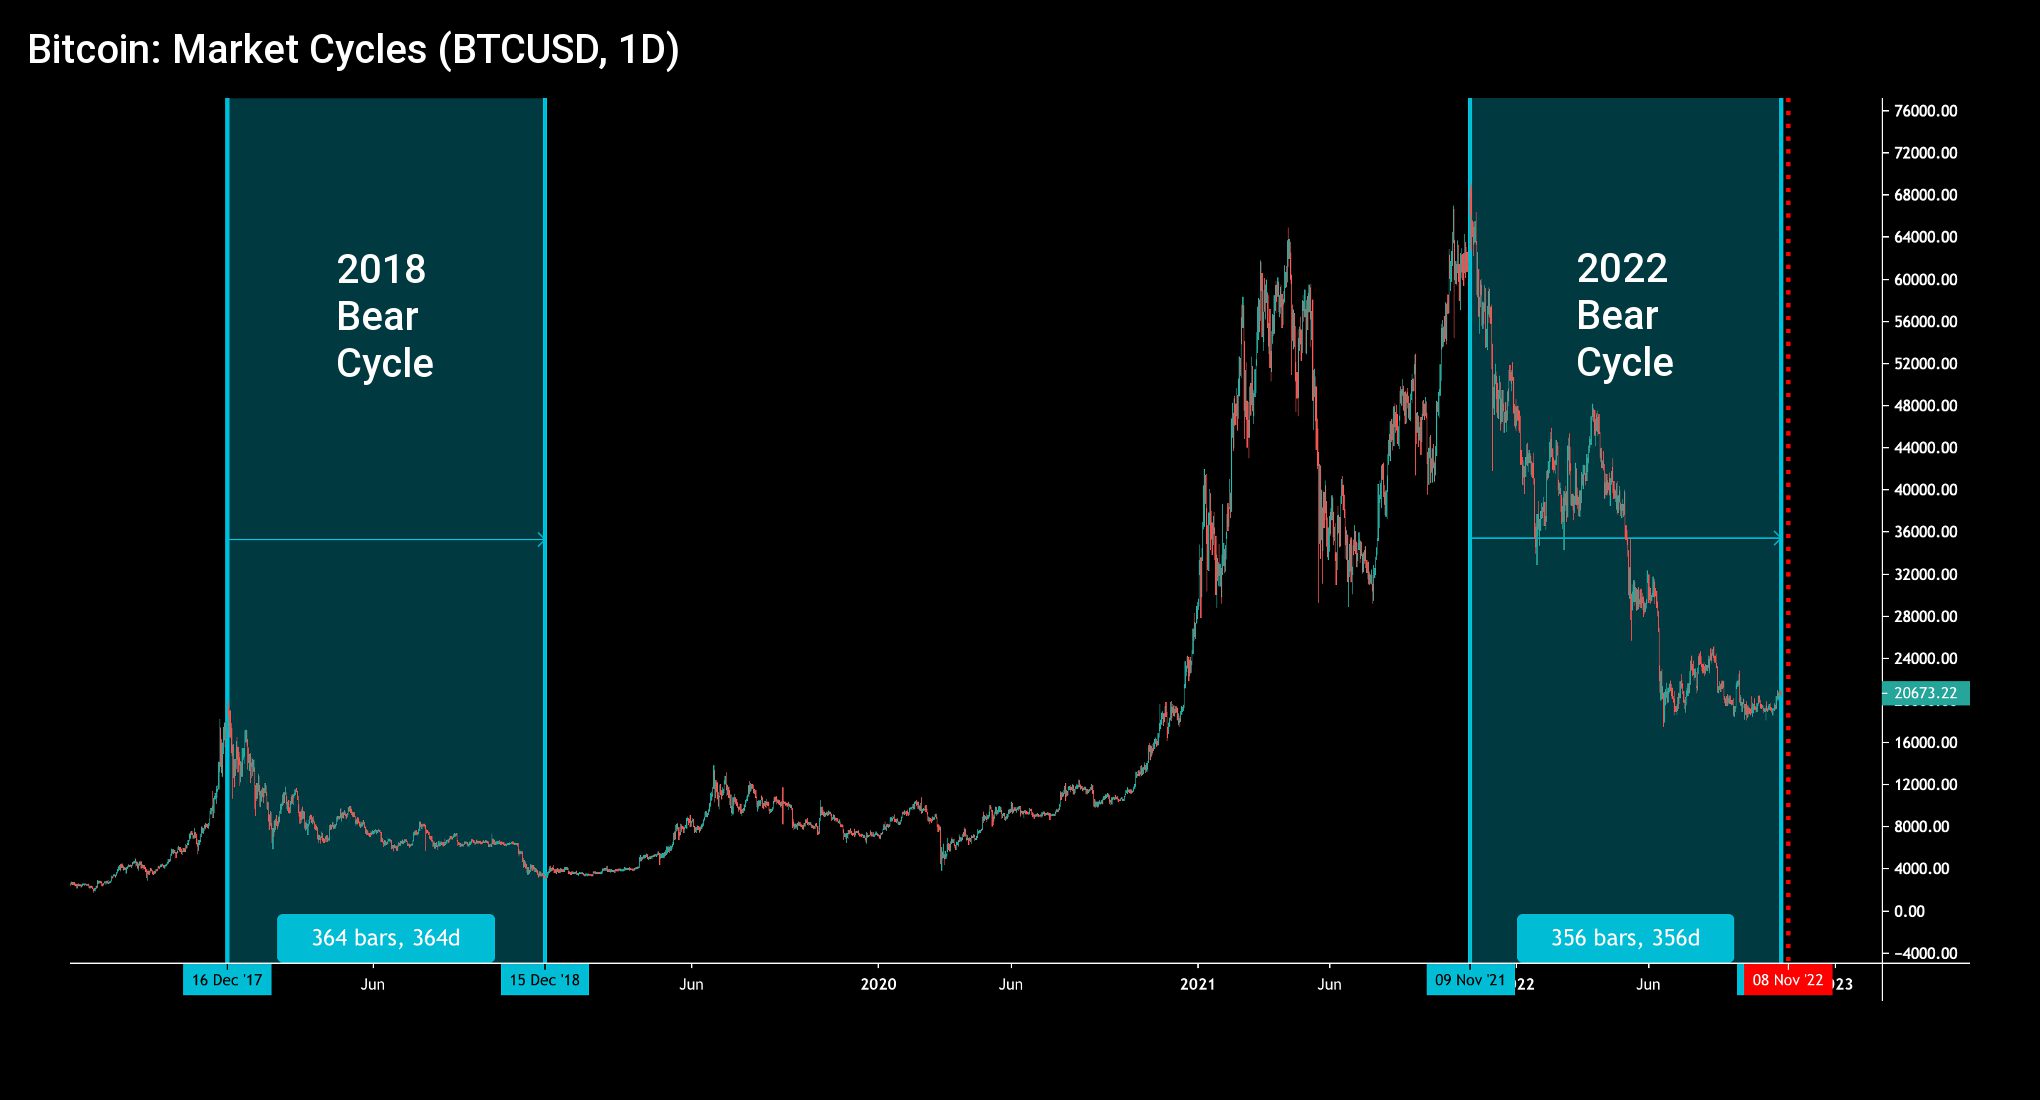
END OF CYCLE IN SIGHT?
Bitcoin’s current “crypto winter” has now lasted for 343 days, and many investors are wondering when we’re about to see proper positive momentum again. When benchmarked against the last major bear cycle of 2018, bitcoin could quickly be approaching its spot price bottom. The 2018 bear cycle (left segment) lasted for 364 days before reaching its eventual bottom, while the current cycle (right segment) is only 21 days from that target (red). In summary, the last bear cycle would indicate bitcoin bottoming in 21 days.
The bull cycle of 2021 had a special and rare double-top structure, while 2017’s single-cycle top in December was very sharp. After 2017, it took almost three years for bitcoin to fully recover. Some analysts argue that market cycles are getting shorter over time; however, the macro environment of 2022 remains highly uncertain. Markets regarded the zero interest rate policy as a “new normal,” and climbing rates now form a wide shock effect across the field. However, rate hikes are nothing new in a historical context, and markets will likely absorb the stress over a longer time horizon.
Bitcoin is a particularly volatile asset, and it has seen multiple long drawdowns since its inception. The current bear cycle has lasted 303 days, meaning we’re quite close to the 366-day length of the last major bear (2017-2018). If we use the 2017-2018 bear cycle as a benchmark, bitcoin might find a market bottom within 60 days, i.e., two months.
Bitcoin Market Cycles and Spot Price Drawdowns
Sources: Coinmotion Research, Coin Metrics
No Data Found
When we explore the 2017-2018 bear cycle in detail, bitcoin’s spot price saw its last correction during the cycle’s last 60 days. If we assume that bitcoin will follow the same path, there should still be a major capitulation event ahead. In order to reach 2018’s market bottom, bitcoin’s spot price should further decline by -45 percent, and that would drop BTCUSD to 10 290 US dollars. However, bitcoin’s current price action is not closely correlated with the year 2018, meaning the outcomes might quickly diverge.
DECOUPLING?
The recent collapse of the Meta Platforms stock and the antifragility of the crypto market again raised speculations about bitcoin’s decoupling from the technology stock market. Data from Coin Metrics reveals how the 90-day Pearson correlation between bitcoin and the S&P 500 index has fallen from its peak of 0,64 in September to the current level of 0,53. The correlation has therefore weakened by -17 percent from September to October.
Correlation: BTC / S&P 500
Source: Coin Metrics
No Data Found
The attached correlation matrix reveals that the correlation between bitcoin and the Nasdaq 100 index is 0,52. So, Bitcoin has a weaker correlation with the technology sector than the S&P 500. Ethereum’s correlation to the Nasdaq is only 0,5. The correlations of Bitcoin and Ethereum to the dollar index are significantly negative (-0,76, -0,77), but the composure may change as DXY approaches its inflection point.
HALVING
Bitcoin’s halving essentially means the split of the payout of a new block. The halvings have been a fundamental factor for Bitcoin as they incrementally increase Bitcoin’s scarcity. The Block reward was reduced to 25 in 2012, 12,5 in 2016, and 6,25 in 2020. With the upcoming halving in 2024, the block reward will be further reduced to 3,125. [2]
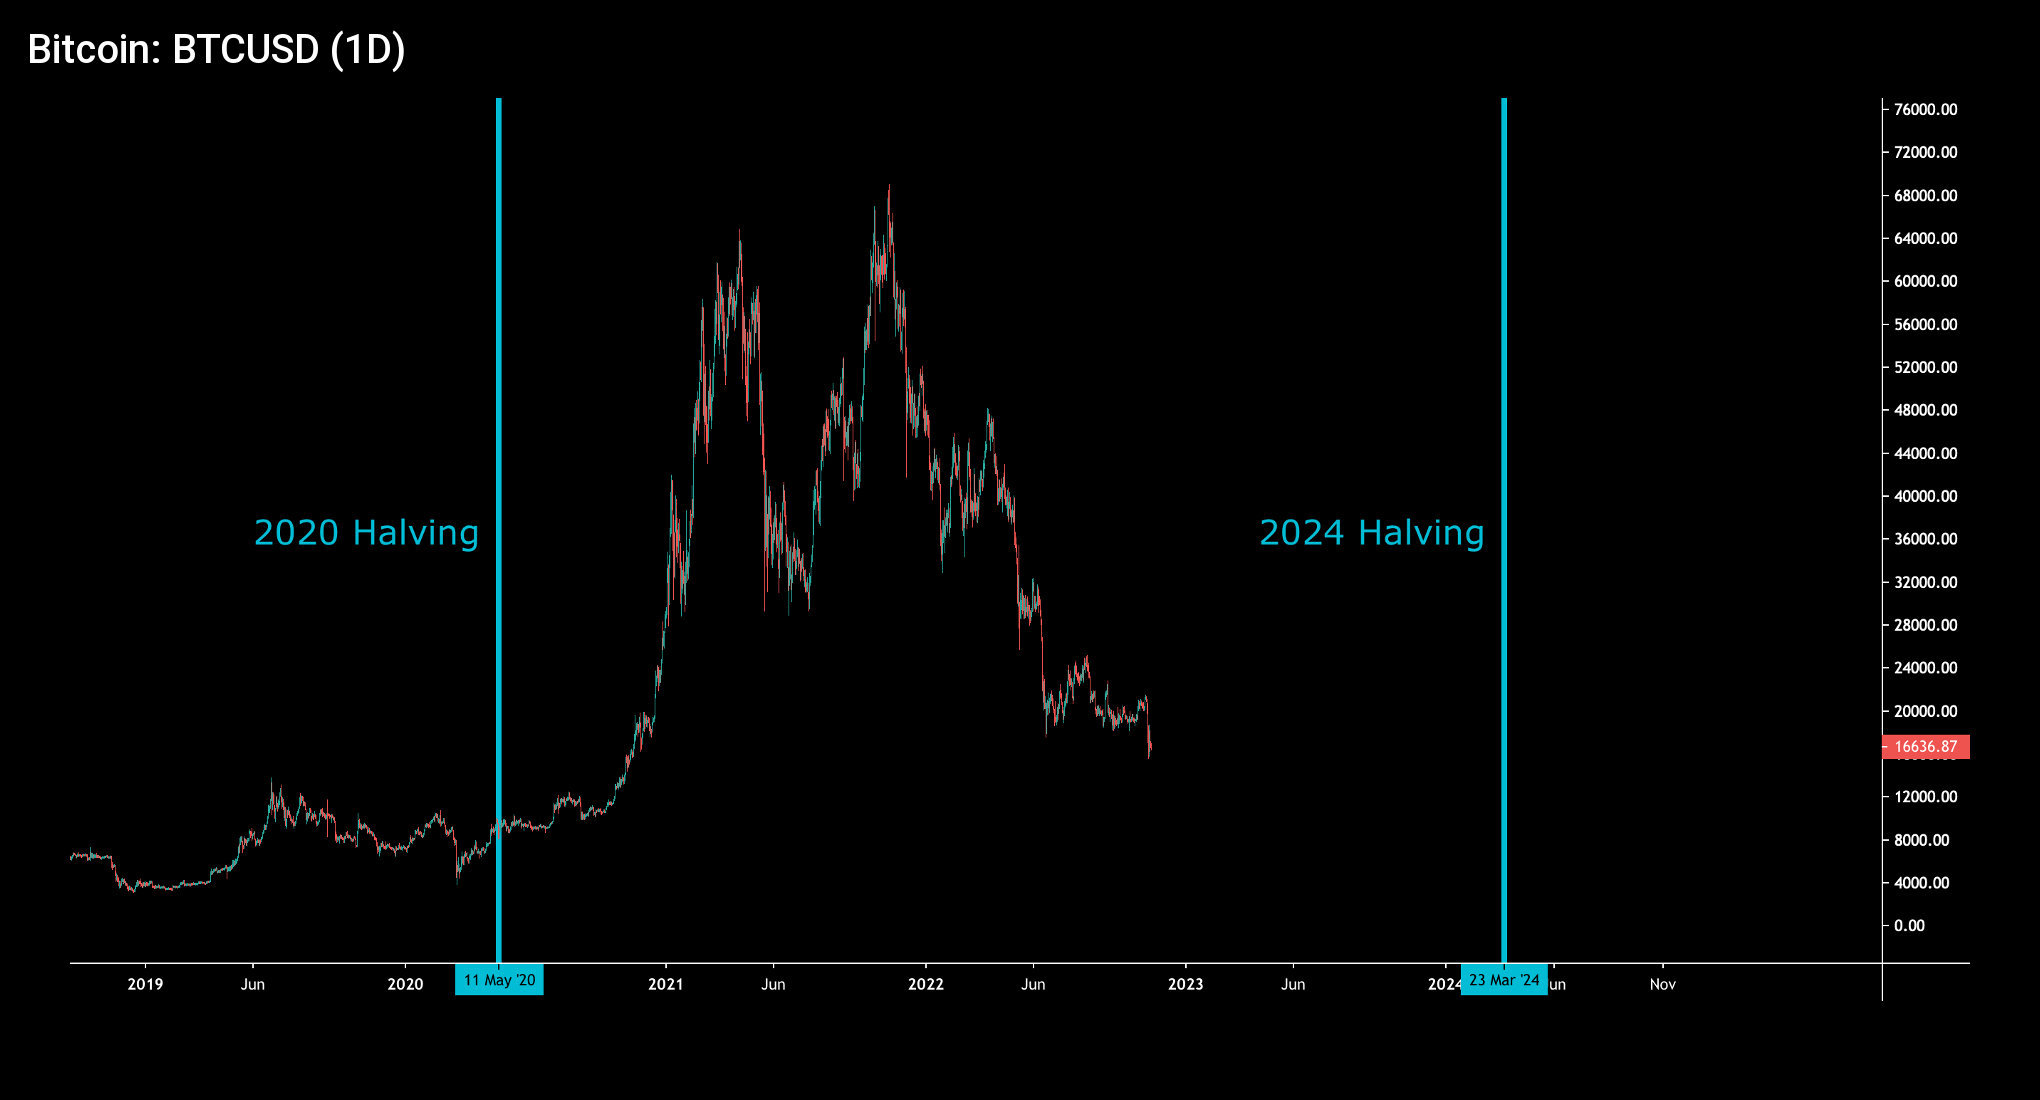
When looking at the embedded chart, the last two halvings in 2016 and 2020 (purple) have occurred during accumulation cycles (green) and acted as triggers to distribution phases (red). The spot price increased 1238,59 percent between the halvings of 2016 and 2020. If we use the previous halving cycle as a reference, bitcoin could rise to 117 162 USD by the halving moment of 2024.
A HOLDER TERRITORY
While Bitcoin’s year 2022 has been brutal in terms of price action, however, the correction can be seen as a mandatory “purge” of excess speculative money. As the following chart shows, speculative money started to enter the market in early 2021, wildly pushing the spot price up. The speculative money also significantly increased the amount of leverage in markets. Over a longer time span, the excess leverage starts to act as a speculative ballast to spot price, and it needs to be “flushed out” on a timely basis.
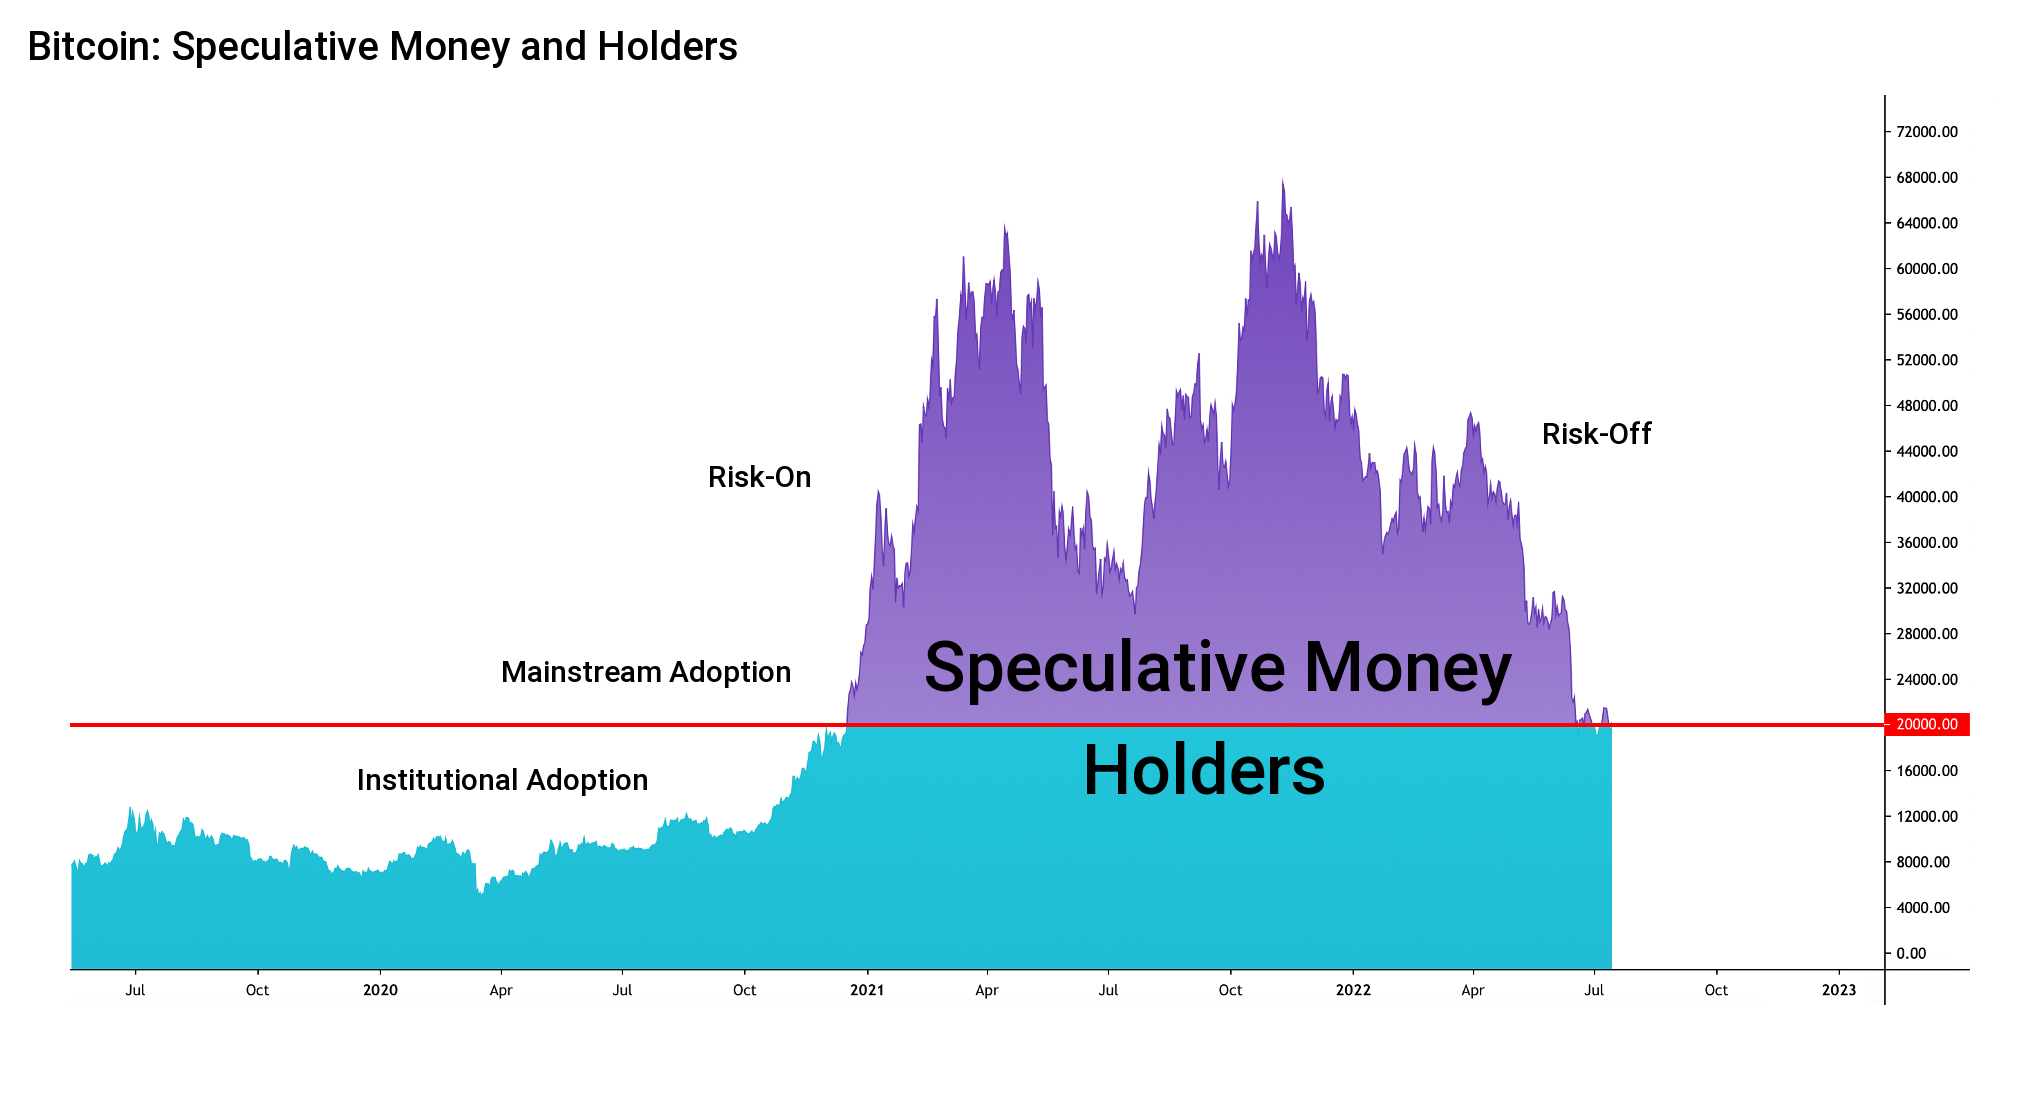
As the embedded chart shows, under $20K valuations are skewed towards long-term holders, or “holders of last resort.” Now with the fresh risk-on sentiment, we’ll see speculative money enter the markets again.
History never repeats itself, but it often rhymes.
Mark Twain

WEB3
By definition, Web3 is a new iteration of the internet, including features such as decentralization, blockchain technologies, and token economics. The name “Web3” was originally created by Ethereum’s founder Gavin Wood in 2014. Back then, Wood described how the web requires too much trust. According to him, the internet we use today relies on trusting a handful of private companies to act in the public’s best interests. Let’s compare the differences between Web1, Web2, and Web3. [3]
Web1: Primarily built on simple static websites. Most protocols were open, decentralized, and community-governed
Web2: The internet we know today. Most of the value is accrued to huge technology companies
Web3: The value proposition is to re-decentralize the internet. The web would be again owned by the builders and creators
Web 1
(Read)
1990-2005
Open protocols that were decentralized and community-governed. Most of the value accrued to the edges of the network – users and builders
Web 2
(Read - Write)
2005-2020
Siloed, centralized services run by corporations. Most of the value accrued to a handful of companies like Google, Apple, Amazon, & Facebook.
Web 3
(Read - Write - Own)
2021+
Internet owned by the builders and users, orchestrated with tokens.
The core principle of Web3 is that it is decentralized: instead of large swathes of the internet controlled and owned by centralized entities, ownership gets distributed amongst its builders and users. Web3 is also permissionless: everyone has equal access to participate in Web3, and no one gets excluded.
Web3 incorporates native payments: it uses cryptocurrency for spending and sending money online instead of relying on the outdated infrastructure of banks and payment processors. Additionally, Web3 is trustless: it operates using incentives and economic mechanisms instead of relying on trusted third parties.
The Web3 scene has also been growing domestically here in Finland, and according to the seasoned blockchain specialist Mikko Ohtamaa’s list, there are at least 60 active Web3-related projects with Finnish roots. Particularly the NFT scene has been gaining traction in Finland, alongside the emergence of new NFT art galleries. Let’s dive into some of the most relevant projects on Ohtamaa’s list.
KLEOVERSE
Kleoverse is a remote-first Web3 startup, founded in the summer of 2021 and launched in early 2022. According to Kleoverse’s team, they are building the platform of work in Web3 with a mission to revolutionize talent measurement, signaling, and discovery on the web.
Kleoverse believes that the way we work will be transformed in the coming years, and Web3 turbocharges this change. DAOs and permissionless working opportunities will play a key role, on-chain verified reputation, built on top of proven working history, will become the foundational layer forinternet-native professionals. We want to be a core part of building this future. [4]
STRUGGLE C&C
Struggle C&C is a Helsinki-based independent digital studio dedicated to making technological advancements available to all. According to Struggle C&C, they are devoted to recognizing disruptions destined to change the world and
using them to redefine the predominant digital experience. [5]
Struggle C&C also manages Struggle Lab, an NFT gallery and creative space in Punavuori Helsinki. The Struggle Lab focuses on showcasing emerging and established artists, both domestic and international. [6]
TOKEN TERMINAL
Token Terminal is the go-to platform for translating complex crypto data into standard financial and business metrics fluently. The goal of the company is to help crypto holders easily quantify and compare their assets.
Token Terminal says its focus is to extract raw smart contract event data from multiple different blockchains and aggregate, clean, and transform it into standardized and comparable business metrics. Their data shows that an increasing number of blockchains and decentralized applications can be valued based on the revenue that they generate.
Total Value Locked in DeFi (USD B)
Source: DeFi Llama
No Data Found
Total Value Locked in DeFi (USD B)
Source: DeFi Llama
No Data Found
When looking at the Web3 and decentralized finance industry from a wider perspective, lending is the dominating sector by the total value locked metric ($24,8 billion). After lending, decentralized exchanges (DEX) also accounted for $23,8B worth of TVL. Bridges represented $10,8B worth of TVL and asset management $8,8 B. The role of staking has been decreasing, only reaching a TVL of $7,9 billion.
Decentralized Exchange Trading Volume
Source: DeFi Llama
No Data Found
Uniswap continued to dominate the trading volume of decentralized exchanges, crabbing 50,5 percent of the total trading volume. Curve had the second largest share of trading volume, taking 12,9% of the market. A newcomer dodo has been able to take 11,9% of the trading volume.
BITCOIN DOMINANCE
Bitcoin’s dominance has been one of the most essential market indicators, as it mirrors the relationship between the leading cryptocurrency and its alternatives. The dominance is calculated by dividing the market capitalization of Bitcoin by the total market cap of all cryptocurrencies.
Bitcoin & Altcoin MCAPs (SINCE 2019)
Sources: Coinmotion Research, Coin Metrics
No Data Found
Bitcoin & Altcoin MCAPs (Last quarter)
Sources: Coinmotion Research, Coin Metrics
No Data Found
Bitcoin’s dominance has undergone huge shifts over the years. The recent years can be divided into epochs of high and low dominance. The season of high Bitcoin dominance spanned from mid-2019 to early 2021.
BTC Dominance (since 2019)
Sources: Coinmotion Research, Coin Metrics
No Data Found
The high Bitcoin dominance season was characterized by low spot price action and bearish sentiment. During the “high season,” Bitcoin’s dominance climbed from 50 percent level to well above 70%.
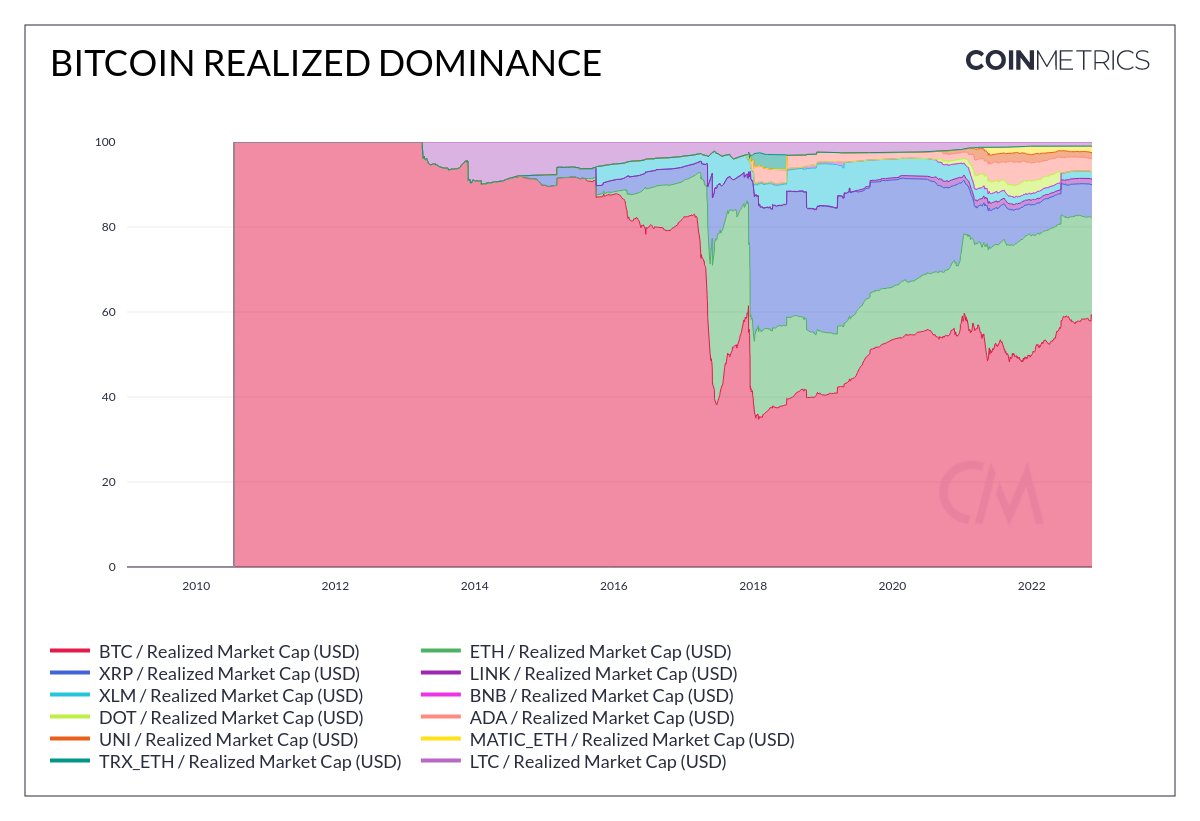
The leading on-chain analyst of Glassnode, called “Checkmate,” recently introduced an alternative way to calculate bitcoin’s dominance. This “realized dominance index” shows how bitcoin’s dominance could be 59 percent.
ETHEREUM
Ethereum’s Merge event received significant attention during the third quarter, as it finally occurred on September 15th. Investors have particularly anticipated the Merge because it promises to fundamentally enhance the protocol and reduce its supply. [7]
The main selling point of the merge was the classification of Ethereum as a “green” and “ESG friendly” blockchain. Wealth managers are increasingly aware of ESG-related topics, and significantly lower energy consumption would make Ethereum easier to sell to investors. The green narrative would also allow Ethereum to differentiate itself from PoW-based Bitcoin.
Ethereum: Supply
Data source: Coin Metrics
No Data Found
As expected, Ethereum’s supply has now turned south, effectively becoming more scarce. By Coin Metrics data, the Ethereum supply peaked at 119,75 million ether units on September 15th, while now the supply has declined to 119,65M. This represents a 100 000 ether unit in the total supply.
Geographical Distribution of Ethereum Nodes
Source: ethernodes
No Data Found
The geographical distribution of Ethereum nodes still shows the vast majority (45%) of them being in the U.S. Europe is also well represented, as Germany takes the second place with 11,9 percent of the nodes.
Surprisingly, Finland is also on the list, hosting 3% of all Ethereum nodes, which is an excellent result compared to the population.
MACRO CORRELATIONS
Correlations: Macro
Source: Coin Metrics
No Data Found
Bitcoin has been heavily correlated with the leading stock market index S&P 500, with the average 90-day Pearson correlation between the two being 0,33. Bitcoin’s correlation with the stock market escalated in the third quarter.
Gold failed in large part because the attributes that made it good money necessitated counterparty risk (high storage cost, difficult to move in large quantities, difficult to verify authenticity quickly). Bitcoin retains Gold’s monetary properties with none of these limitations.
Bryan Jacoutot
CRYPTO CORRELATIONS
Cryptoassets are known to be heavily correlated with each other. The decentralized finance tokens, like Aave, formed a divergence to the leading cryptocurrency bitcoin, in early 2022, however, the correlation has since tightened. The 90-day Pearson correlation between AAVE and BTC was at 0,56 in early January, rising to over 0,84 in the third quarter.
Correlations: Crypto (90-Day, Pearson)
Source: Coin Metrics
No Data Found
The cryptocurrencies have a tendency to diverge in bull cycles and converge in bear cycles, and vice versa. In a negative market environment, the correlations are reaching towards one (1).
EXCHANGE RESERVES
Exchange reserves simply mean the total amount of digital asset units held in exchanges. Per se, exchange reserves tell us how many coins are potentially available for market selling.
↑ Increasing Exchange Reserves: Bearish, indicating bitcoin selling pressure
↓ Decreasing Exchange Reserves: Bullish, indicating accumulation to cold storage
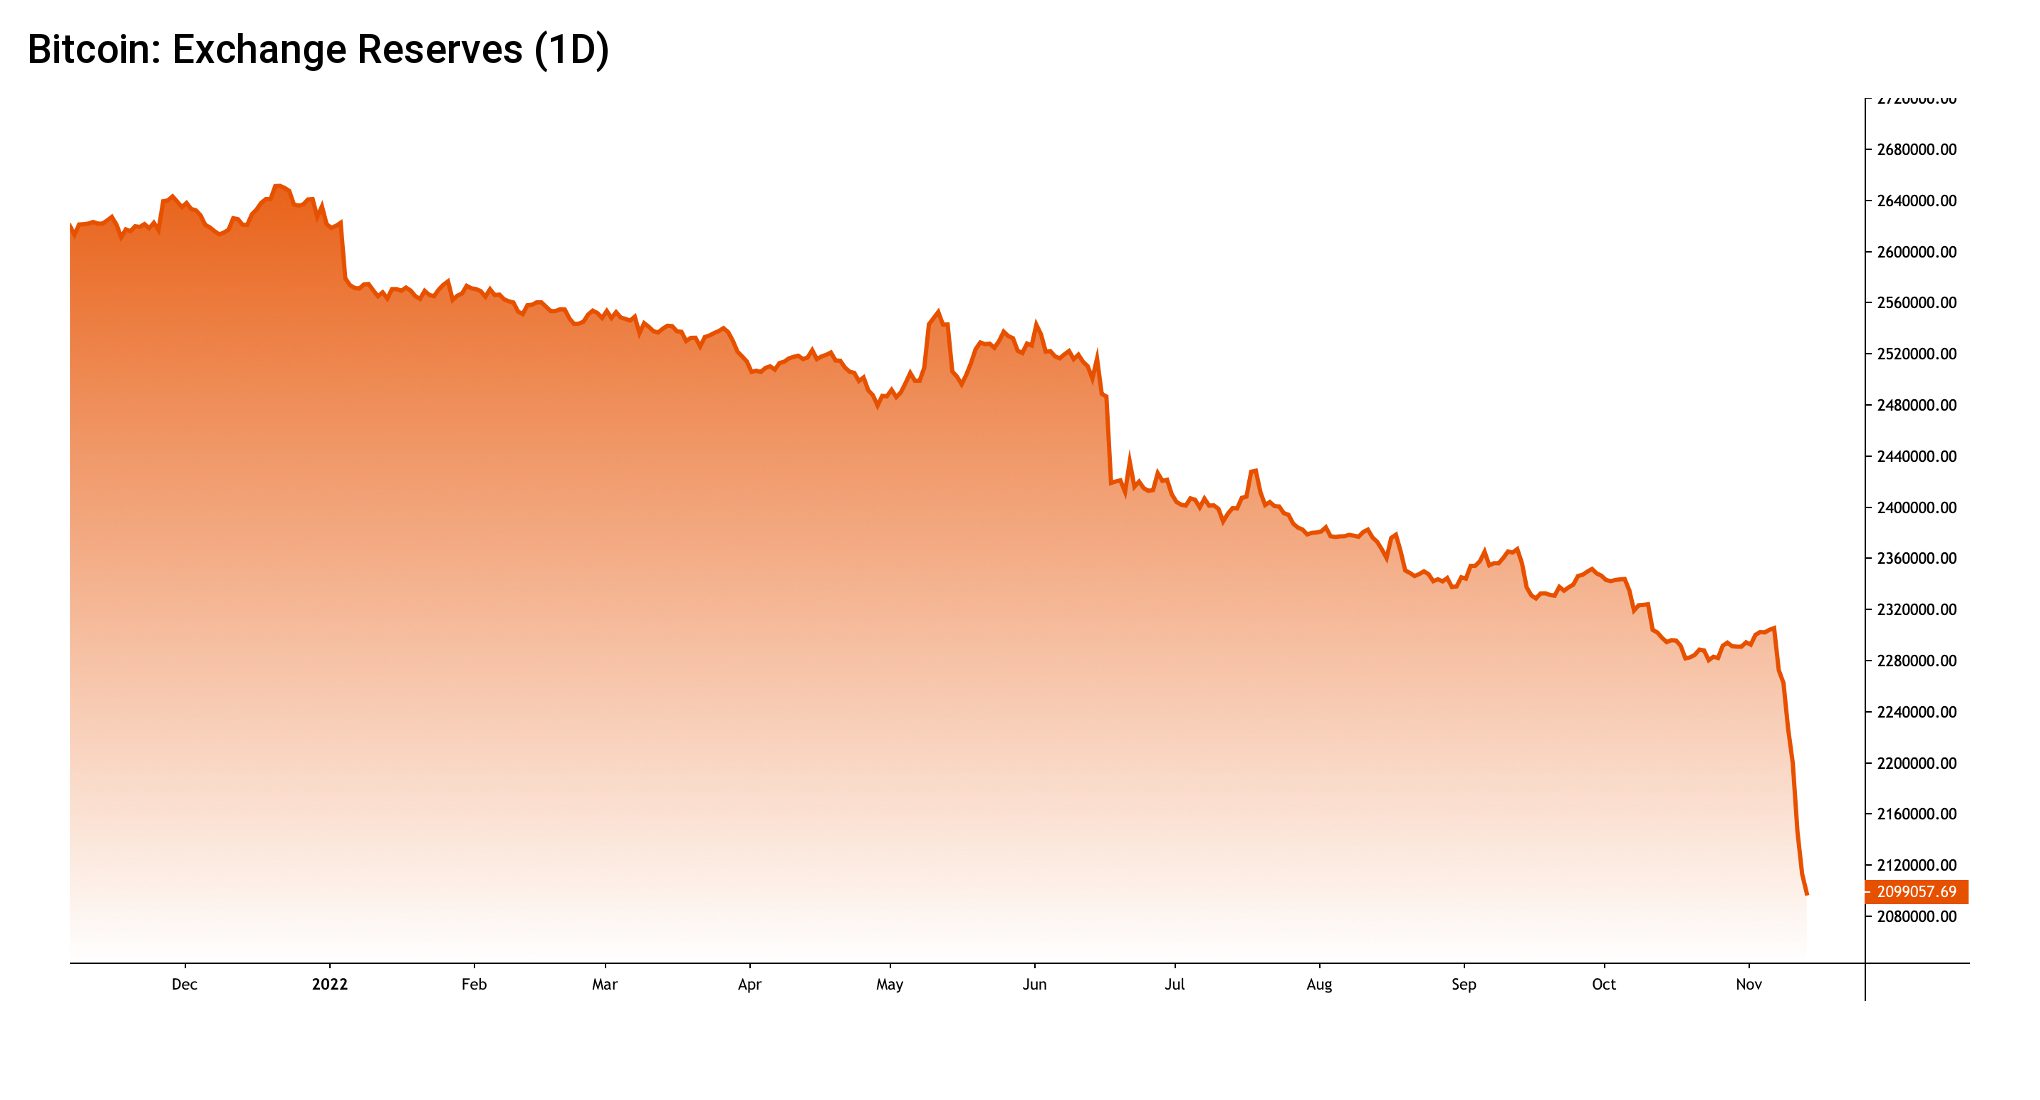
During a bull cycle, assets are usually withdrawn from exchanges into private wallets and allocated to long-term cold storage. This is especially true in bitcoin’s case. Respectively, in a bear cycle, investors move the funds back to exchanges in order to convert them to fiat currencies, stablecoins, or other digital assets.
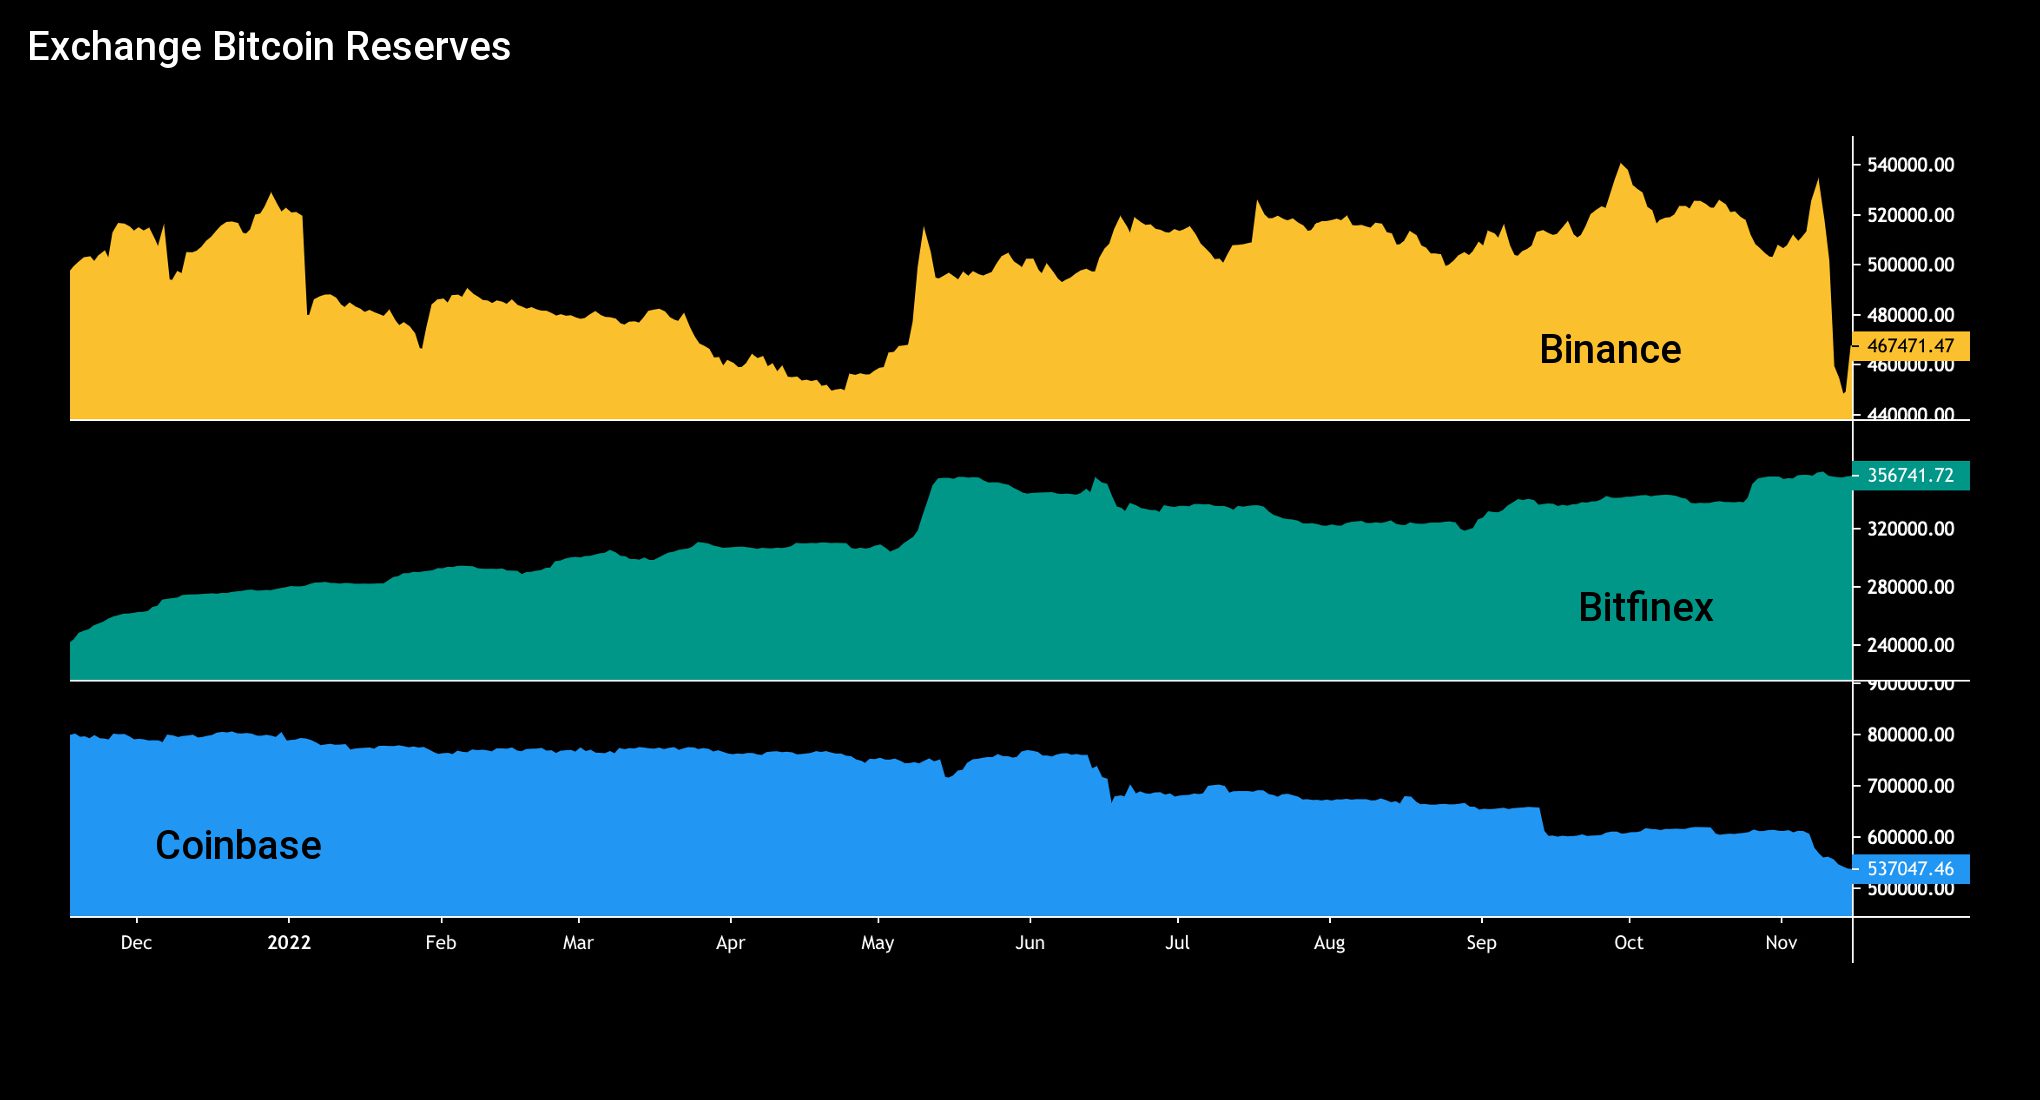
Binance’s native bitcoin unit reserves have declined -15 percent from 53 000 to 45 000 units; meanwhile, the exchange bitcoin reserves of Bitfinex continued to climb through 35 000 units. Coinbase’s bitcoin reserves are still in a secular downtrend, dropping -23% from early 2022.
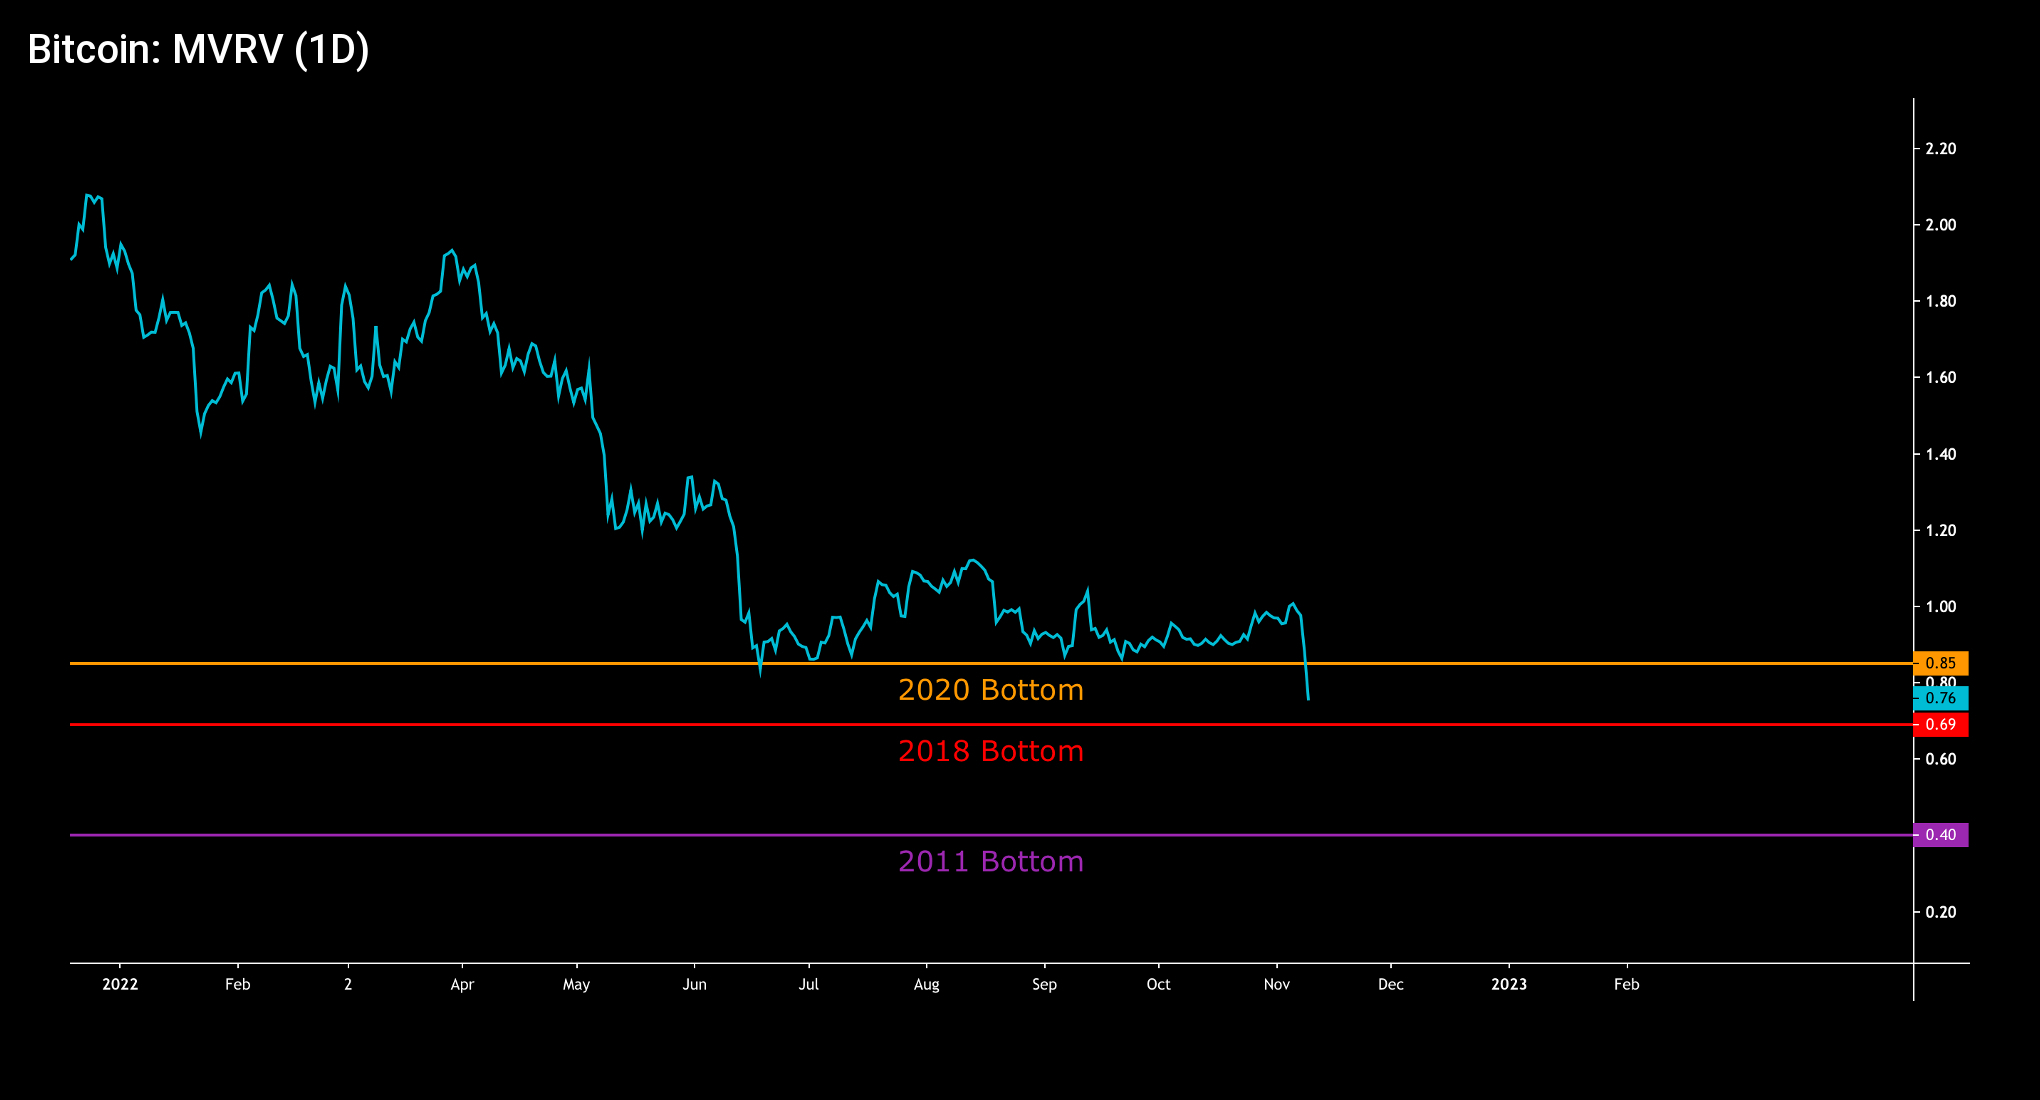
MVRV
The significantly reduced spot price is driving bitcoin’s MVRV indicator lower, close to 2018 lows. MVRV is now at 0,76 and passed the 2020 low of 0,85 (orange) during the FTX collapse. The next support level is found at 0,69 (red), which was last touched by MVRV in the 2018 bear cycle. Historically, any MVRV of below one has indicated a good buying opportunity.
MVRV sell zone: > 3,7
MVRV buy zone: < 1
WHALES
The crypto asset markets are heavily influenced by whales, who by the common definition own at least 1000 native bitcoin units. Whales are known to make smart entries and exits compared with the retail investor segment and many analysts try to interpret their behaviour.
Value in Addresses with ≥ 1K Native Bitcoin Units
Data source: Coin Metrics
No Data Found
Whales have a tendency to front-run markets and their behaviour in 2022 shows a somewhat surprising risk-on move during the early spring.
F.R.E.E. MADEIRA PROJECT
Swedish bitcoin pioneer Christian Ander has launched the F.R.E.E. Madeira project together with the local authorities of the Portuguese island. The main focus of the project is to create a thriving environment for bitcoin users and companies in the industry. [8]
The project also aims to work at the interface of legislation, education, energy, administration, commercial services, migration, and events. Ander’s company Goobit, which builds SaaS and AML software, is also behind the project. At the same time, Goobit’s role is to prevent illegal transactions and sanctioned parties from operating on the island.
Christian Ander is previously known for the Swedish company BTCX, which has been listed on the Stockholm stock exchange as part of the Goobit group. Established in January 2012, BTCX is one of the oldest blockchain companies in the Nordics, together with the Finnish Coinmotion. [9]