

The TA of week 37 focuses on the macro environment and how Bitcoin is deep in the accumulation zone. Additionally, we explore the factors behind the bearish sentiment and why digital assets will eventually recover.
Bitcoin Deep in The Accumulation Zone
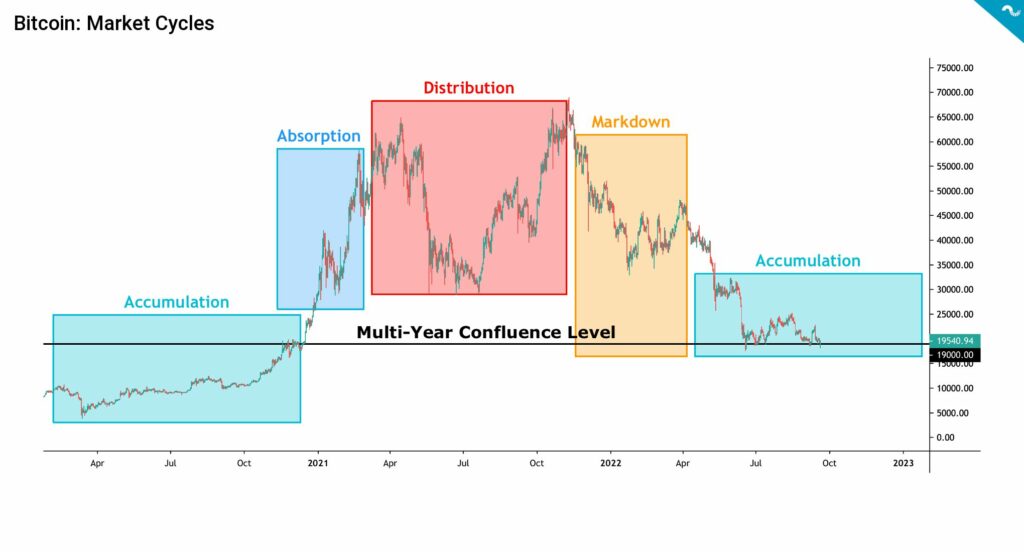
The digital asset market took yet another leg down during week 37 as Ethereum’s Merge anticipation unraveled. Many analysts estimated the Merge to be a “sell the news event,” which attracts speculative money ahead of the scheduled date, but fails to excite markets afterward. Sell the news structure is common in high beta assets classes and particularly well known in the technology field. In terms of market cycles, bitcoin is currently deep in the accumulation zone (turquoise), which will likely last till 2023. So why is the cryptoasset market so bearish? Let’s have a brief summary:
Sell-off in high beta asset segment
The leading cryptocurrency Bitcoin is currently down -60,47 percent year-to-date, and it closely correlates with technology-related stocks like Meta Platforms (Facebook), which is down -56,82% YTD. Thus Bitcoin is weakening in the same category with other high beta assets and especially the technology sector.
Hawkish central banks (i.e. Fed)
While US central bank Fed implemented an exceptional quantitative easing (QE) campaign in 2020, the course seems now to be shifting. Andreas Steno Larsen previously estimated that at least 20 percent of all US dollars in circulation were created in 2020 alone. The side effect of this “money creation” was escalating inflation and central banks are now turning from dovish to hawkish. Tighter money supply means less inflow to all assets.
Credit contraction
As explained in the last technical analysis, bitcoin has been benefiting from credit expansion and spot-price has climbed alongside it. Consequently, the current credit contraction cycle has been challenging for the leading cryptocurrency. The impact of credit expansion and contraction has been even more pronounced towards small-cap tokens and NFT market valuations.
Dollar index (DXY) strength
The US dollar has been showcasing exceptional strength characteristics this year, as USD had a 14,58 percent climb from early January 96 level to the current 110. DXY has formed an inverse correlation to bitcoin, and its strength is clearly poison to the crypto markets. The true reason of the US dollar rally is that most global liabilities are denominated in USD. In an approaching recession, entities are forced to deleverage alongside the slowing global growth, making dollar funding increasingly expensive.
- Disclaimer: Despite of the bearish outlook, I personally expect bitcoin to reach the $100K target price by 2025
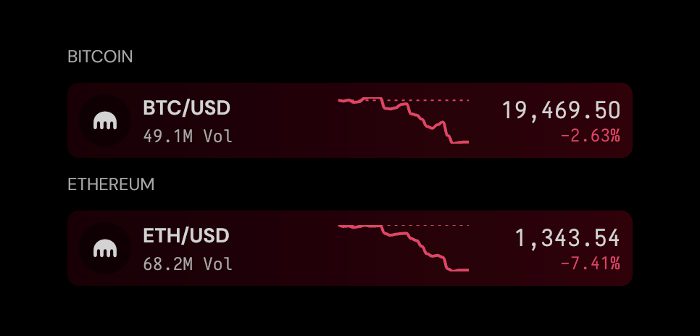
In the middle of Ethereum’s post-Merge sell-off, its trading volume again surpassed Bitcoin, generating a “flippening”. On Monday 19th, Kraken’s trading volume for Bitcoin was 49,1 million US dollars, while Ethereum’s volume was $68,2M. Ethereum has weakened significantly more than other cryptoassets, dropping -15,1 percent in a week. Bitcoin has only declined -by 5,8% within seven days, and XRP has somewhat surprisingly gained 22,8%. The leading stock market index S&P 500 is down -1,95%, and gold -2,89%.
7-day price performance
Ethereum (ETH): -15,1%
Litecoin (LTC): -11,4%
Aave (AAVE): -9,2%
Chainlink (LINK): -1,7%
Uniswap (UNI): -9,6%
Stellar (XLM): 10,7%
XRP: 22,8%
– – – – – – – – – –
S&P 500 Index: -1,95%
Gold: -2,89%
– – – – – – – – – –
Bitcoin RSI: 39
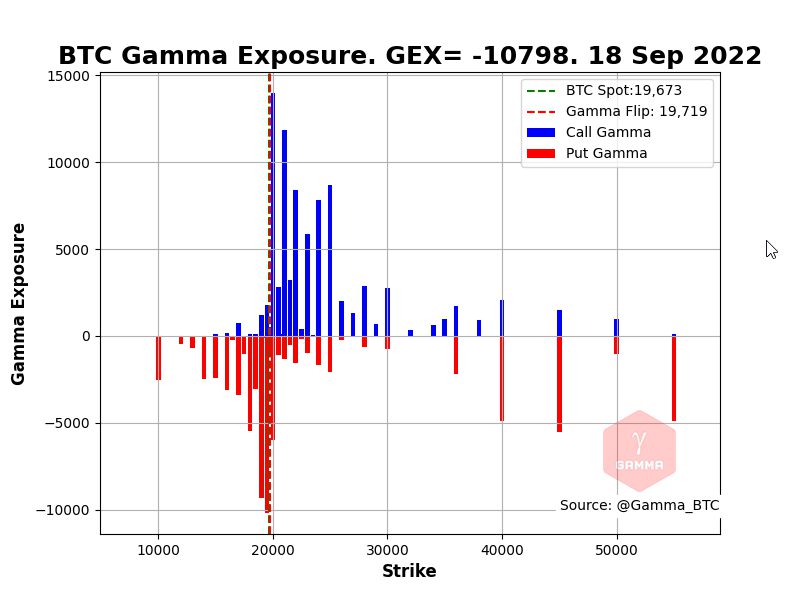
In the derivatives market, the volume of put options has increased significantly, accompanied by a reduction in call options. This confirms the bearish sentiment of market participants and the market maker seems to be close to a gamma exposure flip. If the spot price continues to fall, the volatility will increase, and the fall will be escalated by hedging action of the market maker. The levels of $17K and $18K currently represent the main hedging zones.
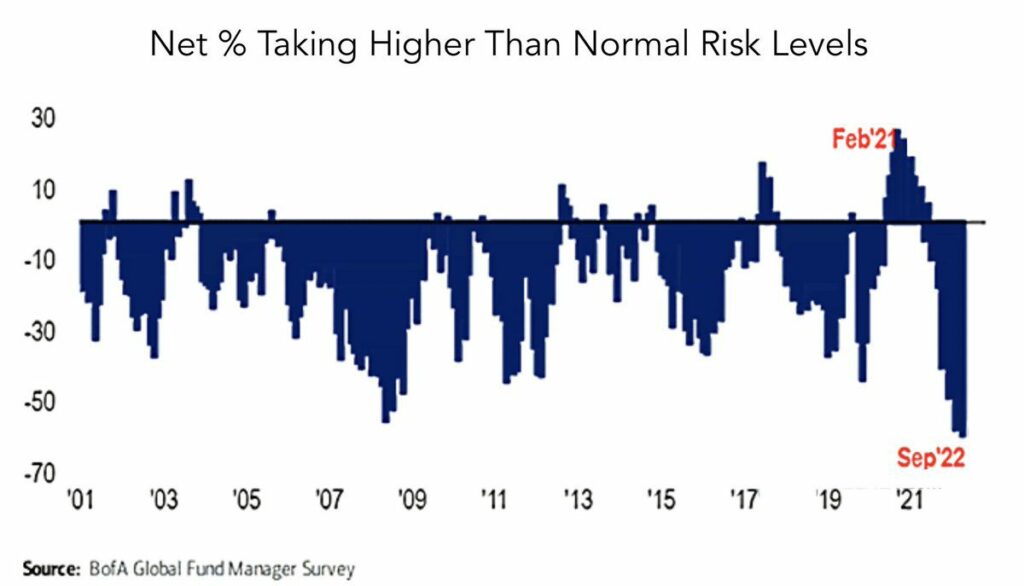
The risk appetite mirrors the poor state of the macro economy, and fund managers are most risk-averse in twenty years. In addition to exceptional inflation figures in the west, China is experiencing a confluence of multiple challenges. First of all, the Chinese housing market, considered the largest asset class in the world, is going through a big deleveraging cycle. China is also seeing sluggish growth due to its zero covid policy. Additionally, the offshore Yuan (CNY) has depreciated below the psychological level of seven US dollars (USD).
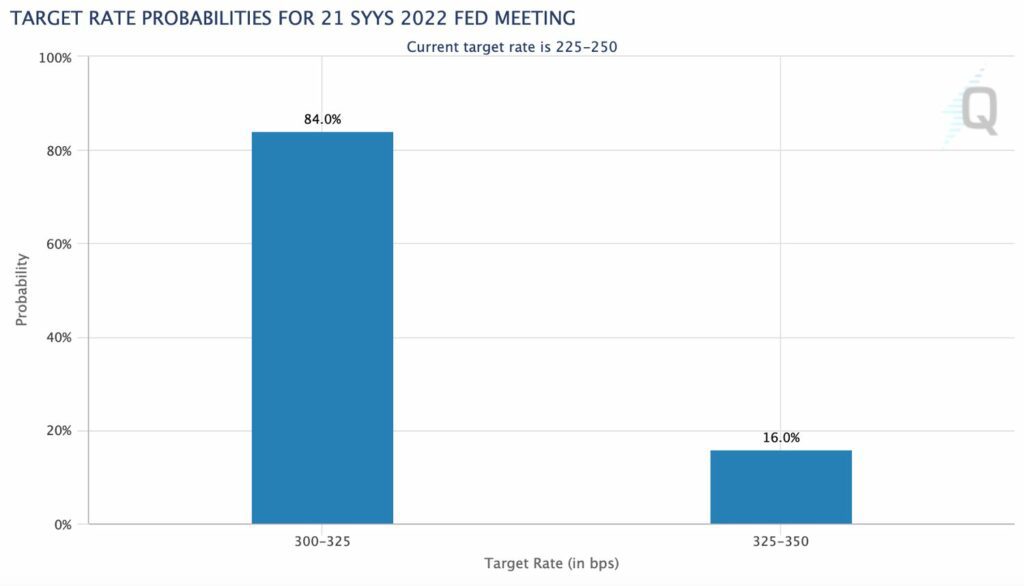
Fed Expected to Raise Rates by 75-100 Basis Points
The markets are in an expectant mood ahead of Wednesday’s FOMC meeting. The central bank Fed is again expected to hike rates by 75 or 100 basis points. CME’s data shows how most of the market participants, or 84 percent, expect a 75 basis point increase, meaning that 100 basis points might really scare the sentiment. After September’s FOMC, Fed has only two meetings left for 2022:
- November FOMC: 2.11.2022
- December FOMC: 14.12.2022
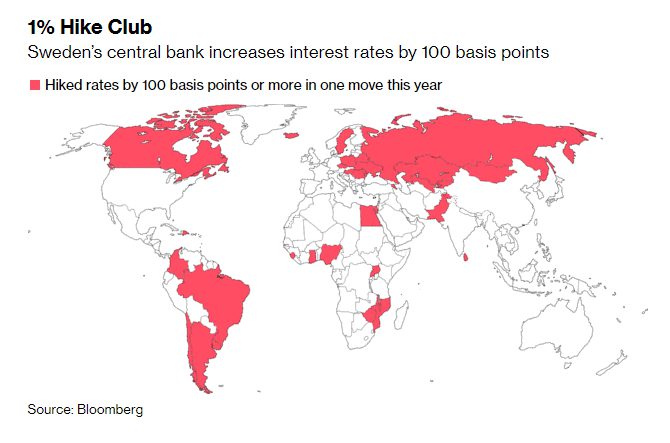
The small European central banks are also following suit, and Sweden’s Riksbank raises the policy rate to 1,75 percent. Riksbank has announced the need to raise rates further within six upcoming months.
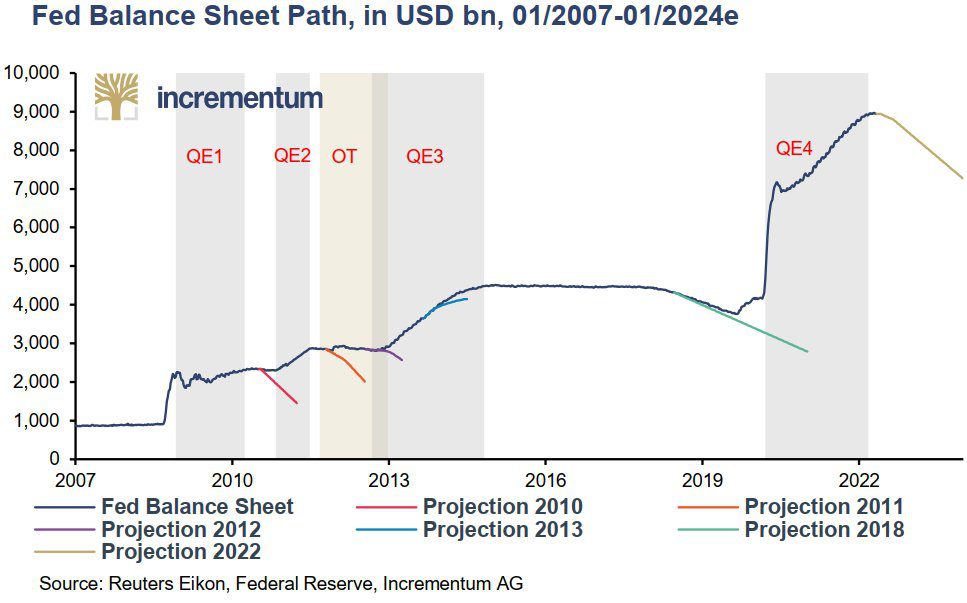
The following chart shows the magnitude of the Fed’s balance sheet growth since 2008 and how it peaked in early 2022. The balance sheet reduction is clearly draining the markets and drying up liquidity. However, it’s good to remember that Fed’s balance sheet was also shrinking during bitcoin’s huge bull market of 2017. The following bear market of 2018 and 2019 correlates with deepening balance sheet reduction, so there could be a correlation with bitcoin’s spot price.
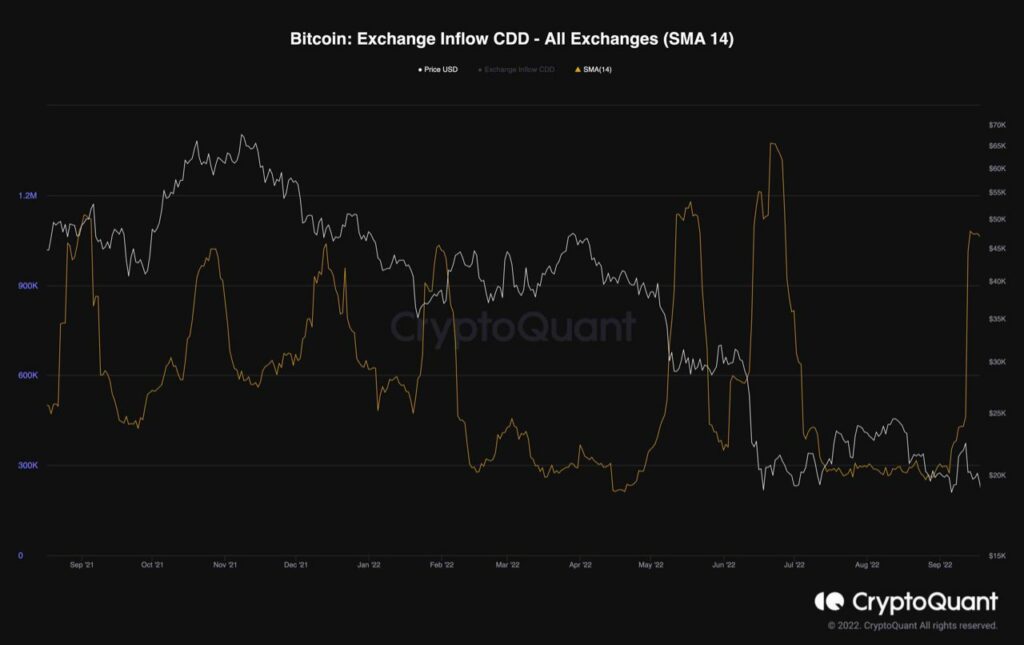
LTH Selling Pressure Signals Capitulation
Long-term holders (LTH) are a critical cohort among market participants, and we can interpret the market’s direction by following their actions. Historically, whenever long-term holders sent a considerable amount of bitcoin units to the exchanges, the market experienced a decline. The Exchange Inflow CDD is a valuable metric to track their behavior, as high values indicate that more long-term holders moved their coins for potential selling. The Exchange Inflow CDD metric has recently spiked, indicating possible selling pressure coming from the long-term holders. Consequently, a rally down toward the $16K level might be the most probable scenario for Bitcoin in the short-term time horizon.
What Are We Following Right Now?
Mikko Ohtamaa has stacked a list of Finnish blockchain-related companies, showing the surprisingly large size of the industry.
Fed might have to pivot its hawkish course due to yield curve inversion.
CME group is about to launch Ethereum options.
Create your account with Coinmotion today to start investing and spending cryptocurrency.

The views, thoughts, and opinions expressed in the text belong to the author and not necessarily to the author’s employer, organization, committee, or other group or individual.