

The TA of week 25 explores a selection of technical indicators, including cumulative delta and indexed price models. Additionally we study on-chain macro data and central bank policies.
Point of Convergence
While Bitcoin’s spot price has dropped -70 percent from November 2021 highs, it’s currently meeting a confluence of technical support. The current $20K support bounces on 2017 cycle top, which bitcoin briefly crossed on June 18th. Additionally the spot price is technically supported by a trendline from 2020 lows, which forms a parallel line with the double top pattern of 2021. These multiple technical indicators converge here and generate an essential area for bitcoin’s future direction.
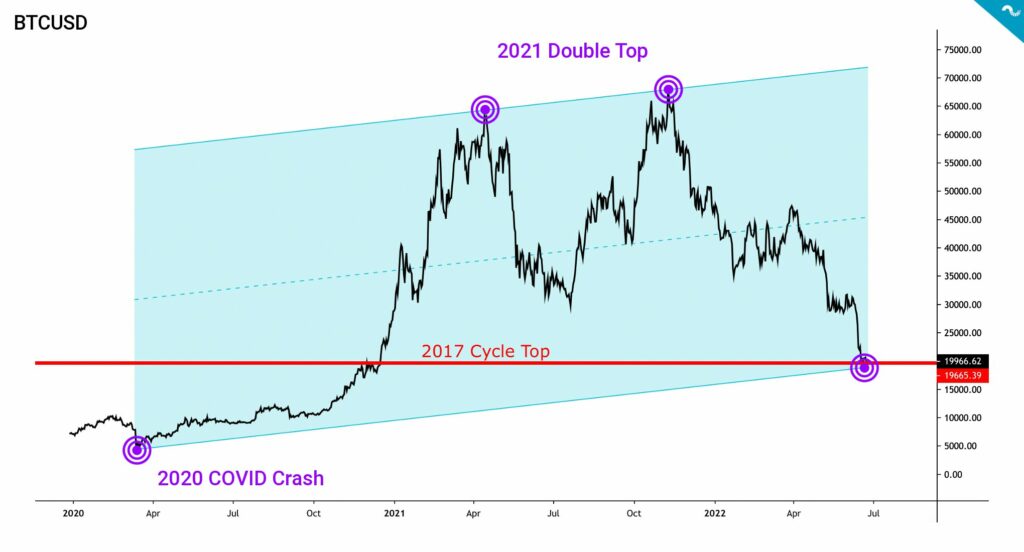
Bitcoin has been able to bounce 11 percent from its June 18th bottom and has strengthened 2,3% on a weekly basis. The leading cryptocurrency is oscillating between $20K and $21K levels, occasionally trying to break through. Bitcoin climbed to $21 478 during weekend, however higher attempts were rejected.
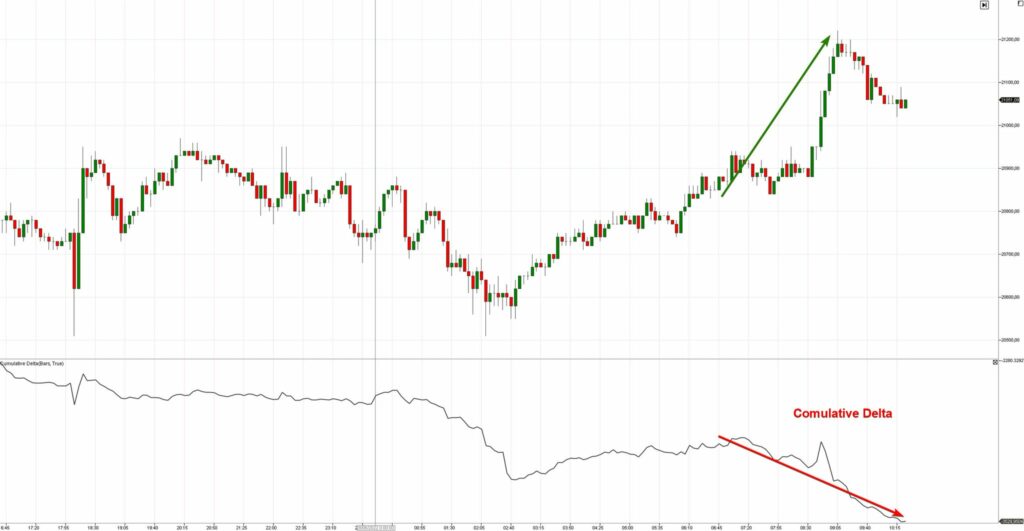
The latest cumulative delta data shows how investors are still willing to sell into spot price strength. Cumulative delta subtracts market sell orders from market buy orders. Positive cumulative delta means more aggressive buyers and negative cumulative delta more aggressive sellers, vice versa.
Bitcoin’s correlation with the stock market index S&P 500 has decreased notably to 0,49 from last week’s 0,54. S&P 500 Index has strengthened over 6% in a week while Bitcoin still seems to be unsure about its direction. In general the decreasing correlation with stock market is a bullish sign at it hints towards a larger decoupling. Bitcoin’s RSI is on level 35 from previous week’s 22 and still signals bitcoin being oversold.
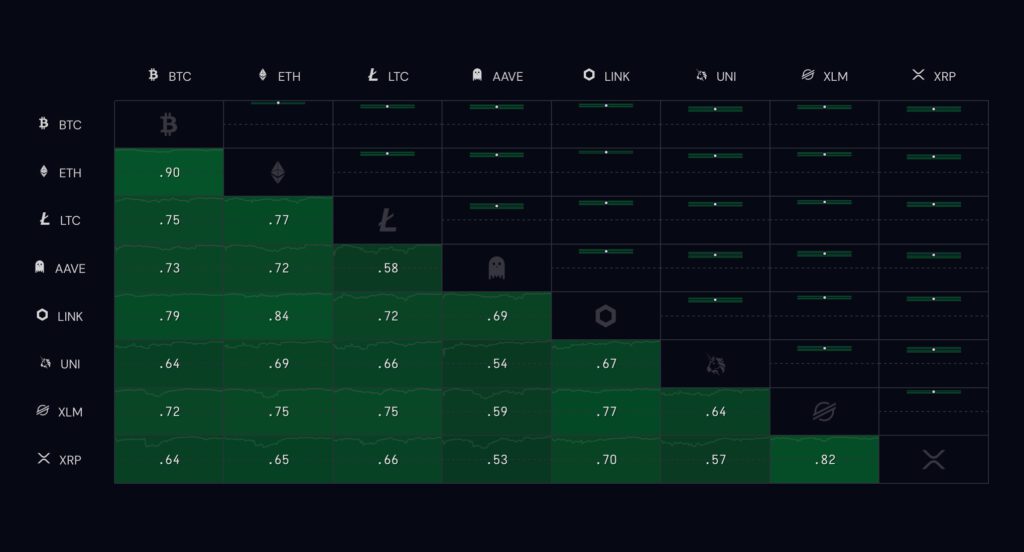
Bitcoin’s dominance took a dive down in mid-June as it plunged from 48 percent to 43%. The dominance drop is amplified by the bottomed DeFi tokens that recoiled up in a spectacular fashion. The leading decentralized exchange Uniswap (UNI) is up almost 30% from last week.
7-Day Price Performance
Bitcoin (BTC): +2,3%
Ethereum (ETH): +8,2%
Litecoin (LTC): +6,4%
Aave (AAVE): +9,5%
Chainlink (LINK): -4,8%
Uniswap (UNI): +25,4%
Stellar (XLM): +6,2%
XRP: +9,1%
– – – – – – – – – –
S&P 500 Index: +6,1%
Gold: -0,8%
– – – – – – – – – –
Bitcoin’s 90-Day Pearson Correlation with S&P 500 Index: 0,49
Bitcoin RSI: 35
Current Drawdown Compared with Historical Cycles
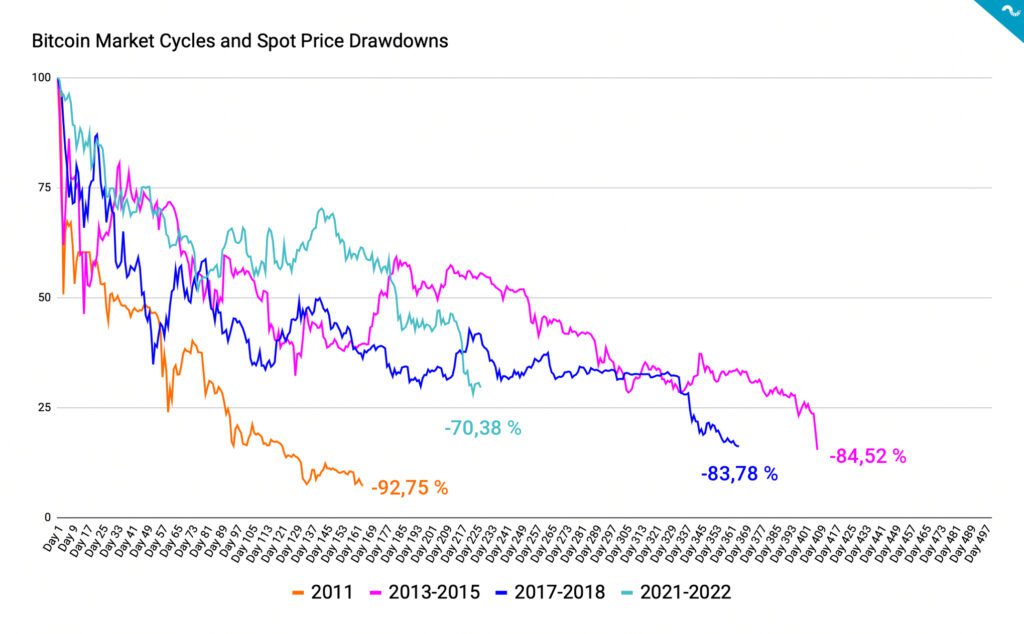
Bitcoin’s spot price has now decreased -70 percent from November 2021 cycle top and many analysts consider the $20K level to be a heavy support. Coinmotion Research stacked indexed data from previous market cycles and compared them with the current drawdown.
The bear market of 2011 was most brutal by this date, including bitcoin’s spot price drop from June’s $29 to November’s $2. The bear market of Bitcoin’s early days eventually took the asset down -92,75 percent. The market cycle of 2013-2014 was phenomenal as Bitcoin climbed parabolically 8414% from $13 to $1135. However the subsequent bear cycle was equally massive and propelled Bitcoin into a -84,52% dive. In the last bear market, bitcoin dropped -83,78% from late 2017 peak to 2018-2019 bottom.
If we benchmark the current market cycle against the 2017-2018 cycle bitcoin would still need to drop -59% in order to reach -83,78%. A hypothetical -59% decrease from $21K level would drop bitcoin into $8610, which would definitely reset the whole market. In my opinion, a -59% drop is unlikely and bitcoin will more probably bottom around $15K-$20K if the macro remains bearish.
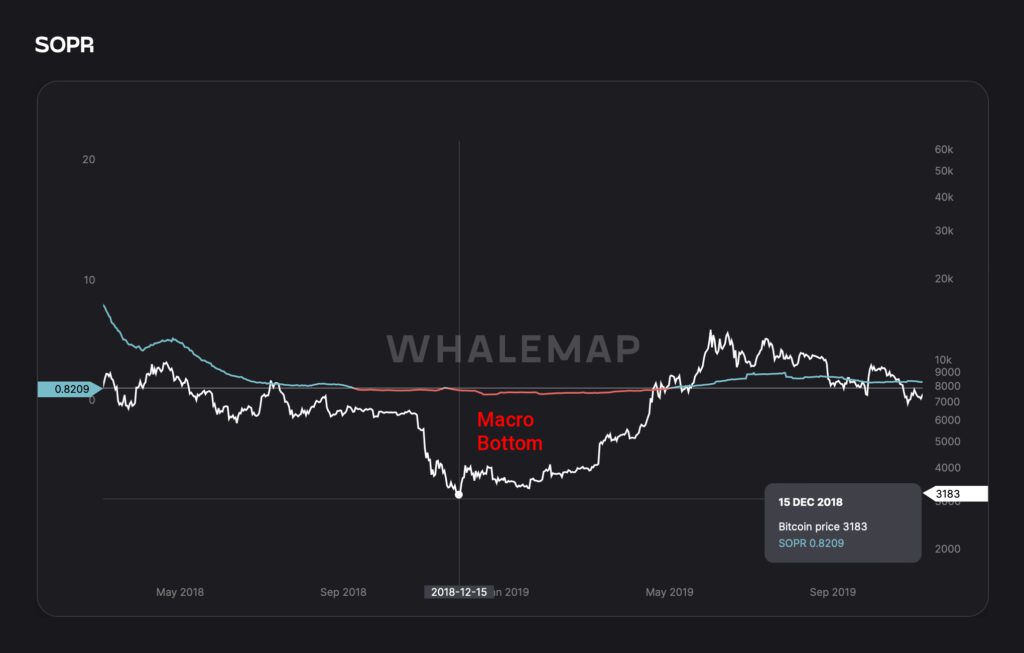
The Macro Bottom
Let’s look at some on-chain data, Bitcoin’s Spent Output Profit Ratio (SOPR) of long term holders has recently dropped below the value of one (1), indicating the investor segment being at loss. When looking at longer time horizon the LTH-SOPR indicator has only entered the loss area three times before. The current LTH-SOPR dive into red zone starts to look like a macro-level bottom.
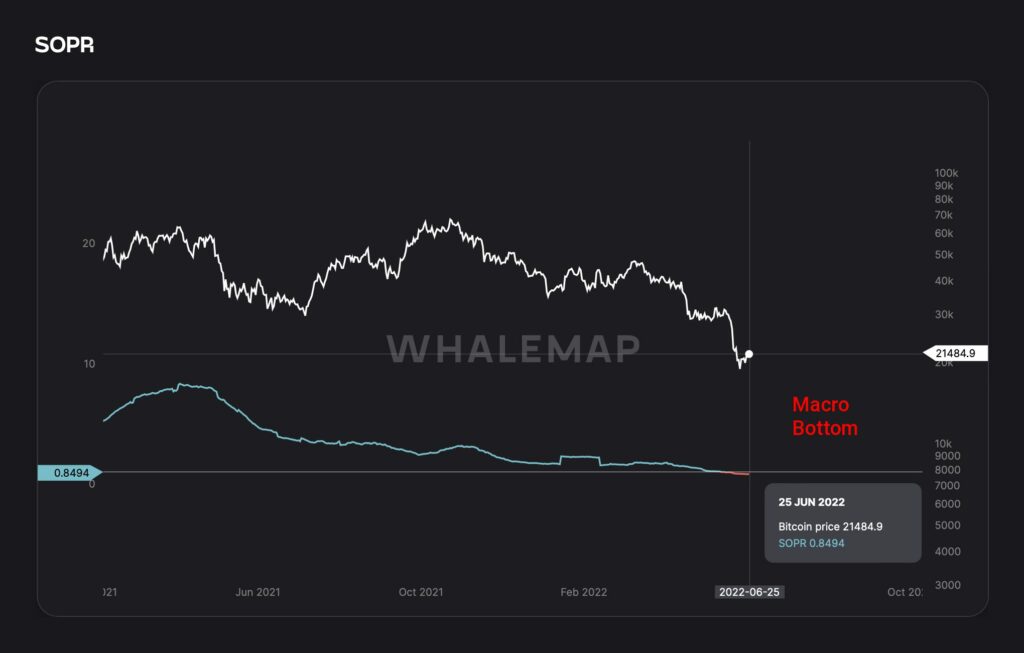
The SOPR data provided by Whalemap shows last macro bottom of 2018 spanning over 8 months, however the market cycles are now considered to be shorter. The macro bottom of 2015 lasted for 13 months. As the decrease of length between 2015 and 2018 macro bottoms was -38,46%, we could expect the current macro bottom last around 5 months, assuming the pattern continues.
Are Central Banks Returning to QE?
As most investors know the central banks policies, and especially U.S. Federal Reserve, have a vast effect on capital markets. Federal reserve has conducted exceptionally dovish monetary policies during recent years and Andreas Steno Larsen estimated that around 20% of all U.S. dollars were printed during the year 2020 alone. The quantitative easing and exceptionally low interest rates also benefited cryptoassets, and especially the small-cap decentralized finance tokens, as the flow of free dollars uplifted all asset classes.
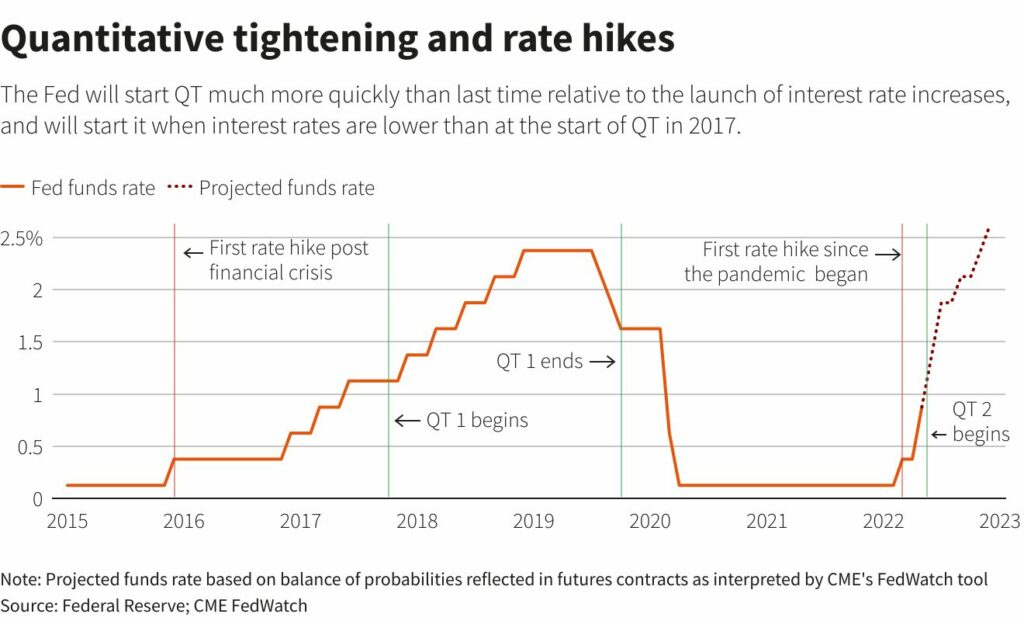
When inflation numbers started to escalate in 2021, the Fed announced inflation to be “transitory”. Obviously the assessment was wrong or it was done in order to calm the markets. Nevertheless central banks are now facing inflation levels not seen in 30 years. In big picture the central banks should pivot between controlling the inflation with quantitative tightening (QT), while keeping the economic gears running with quantitative easing (QE). Sounds like a tough spot, right?
As many have been speculating, the central banks cannot continue the tightening program for too long as QT and higher rates are literal poison to the markets. Leading macro analysts like Andreas Steno Larsen and Luke Gromen are expecting the central banks to return back to QE soon. As Steno Larsen commented, “QEternity” might be the next pivot.
What Are We Following Right Now?
Solana has recently introduced a new Saga smart device, in addition to Solana Mobile Stack (SMS). The Saga smart device is based on Android operating system and will act as a hardware wallet for cryptoassets. The Saga smart device will have a 6,67 inch OLED screen as well as 512 gigabytes of internal memory. Saga is expected to be priced around 1000 U.S. dollars.
Luke Gromen, founder of macroeconomic research firm FFTT, expects Fed to soon pivot back to QE.

According to Murad Mahmudov, markets are currently in a state of “high fear and low greed”.
Bitcoin and cryptocurrencies deleveraged before the broader makets. Bitcoin’s decoupling is healthy for the long-term prospects.

The views, thoughts, and opinions expressed in the text belong to the author and not necessarily to the author’s employer, organization, committee, or other group or individual.