


Not much has happened on the chart, but there are some interesting things which can help us to get ready for the future price moves.
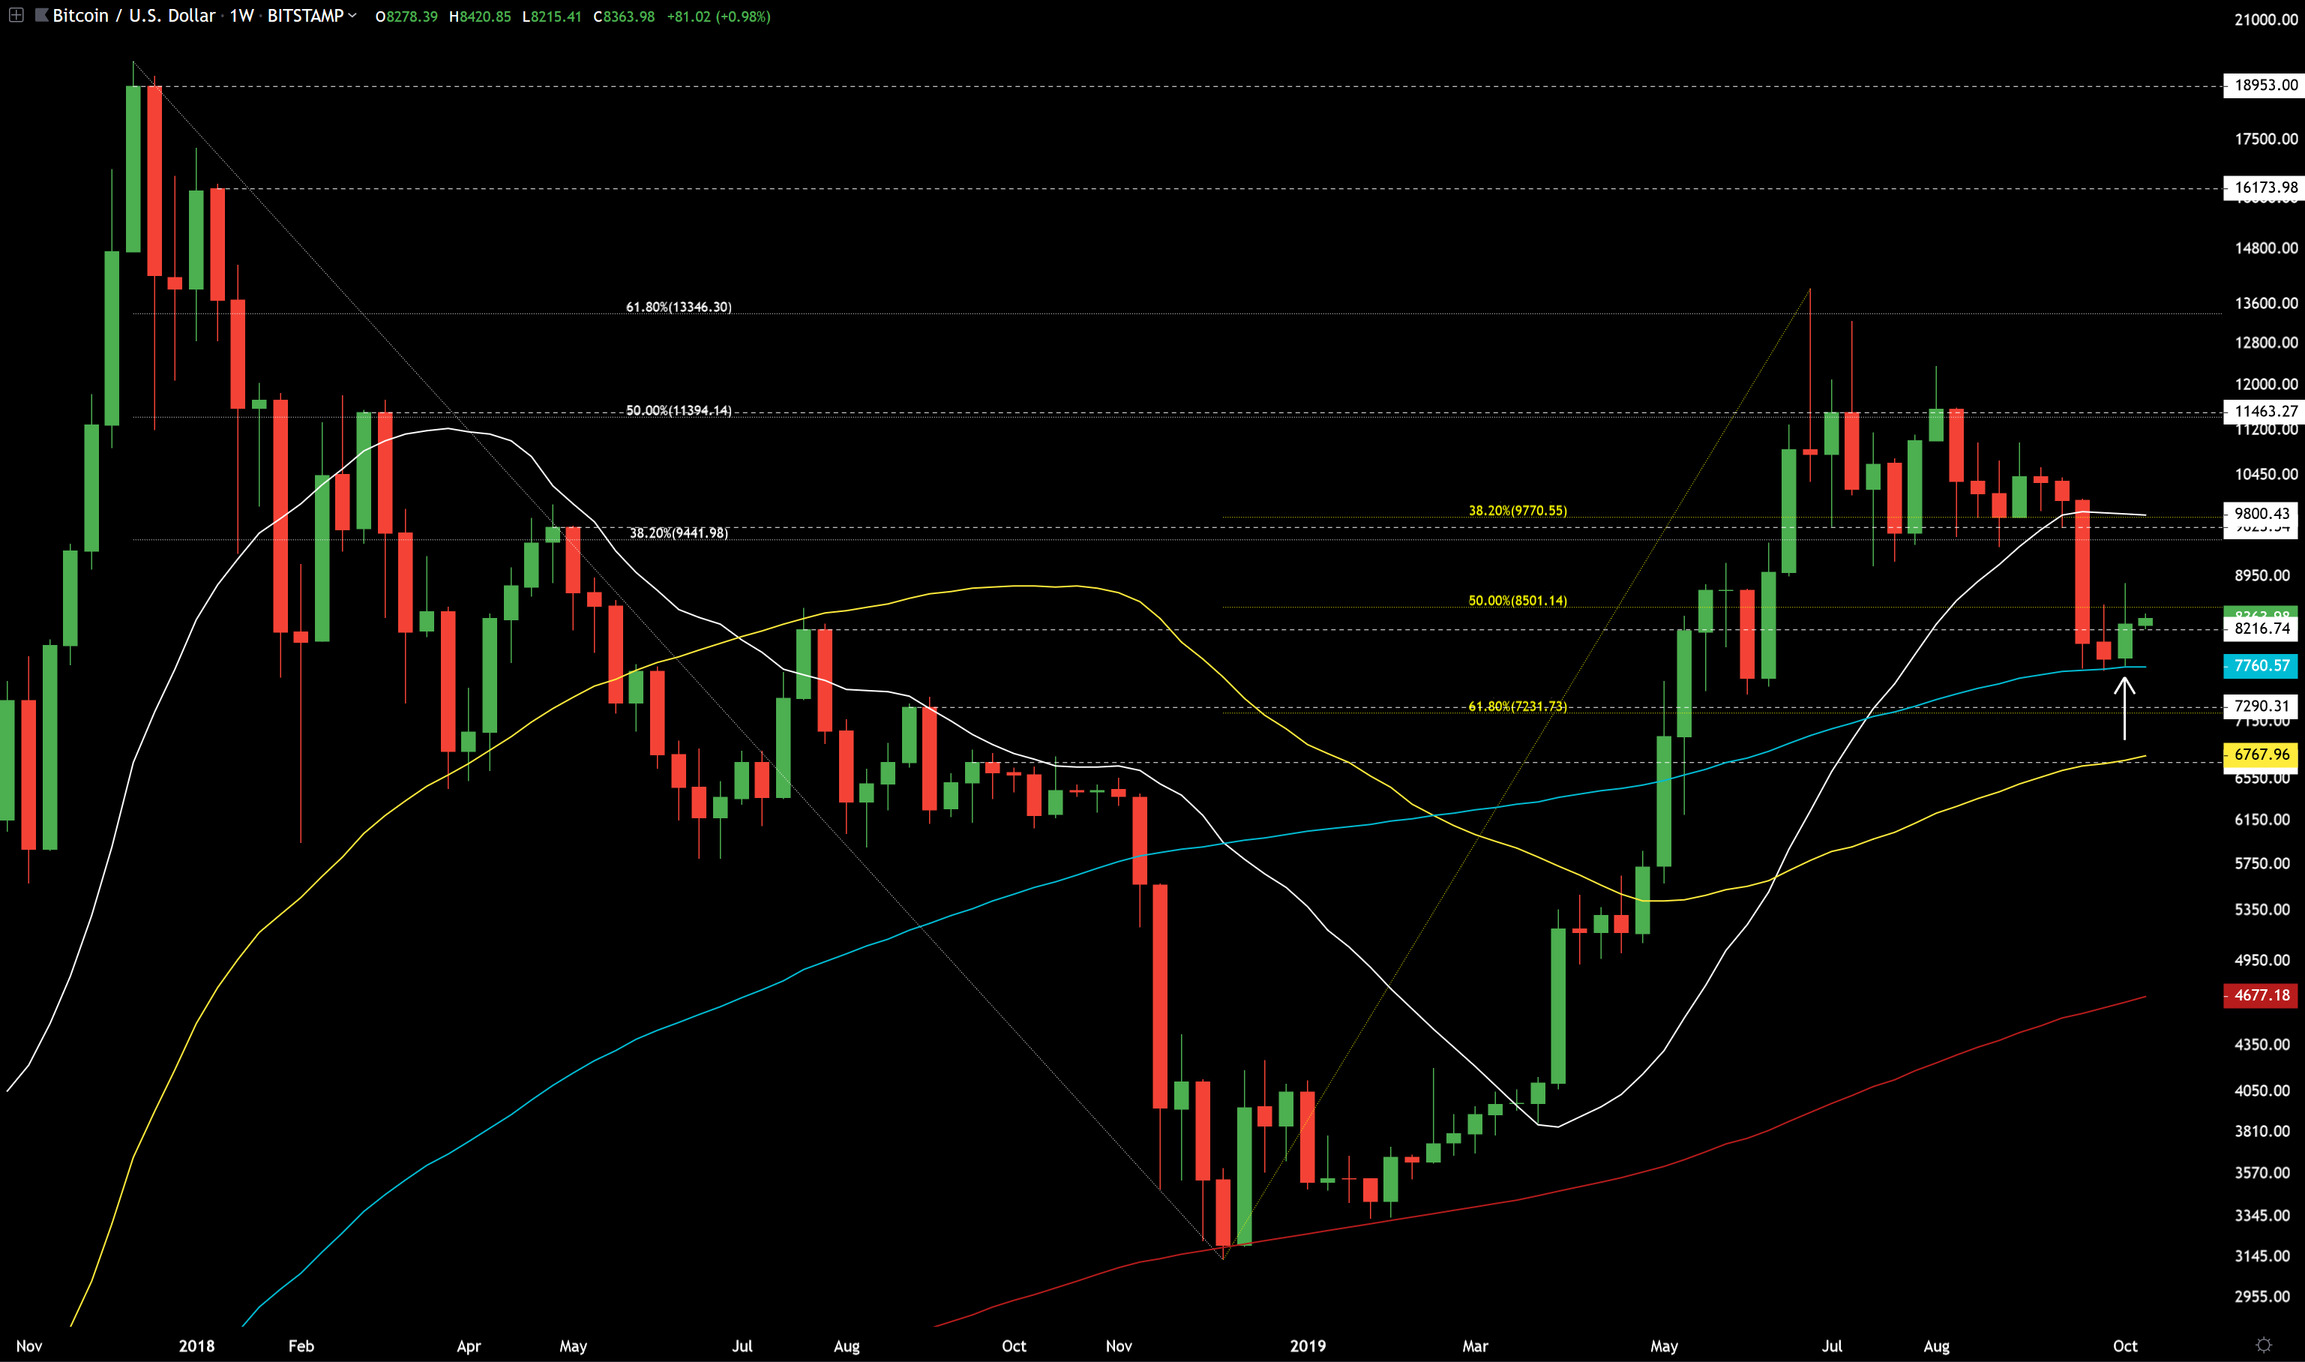
Weekly chart with simple moving averages (SMA) from 20 weeks (white), 50 weeks (yellow), 100 weeks (teal), 200 weeks (red), fibonacci levels from the bear market (white) and from the rise from ~$3k. There are also few important weekly support/resistance (S/R) lines showing on the chart.
We had green weekly engulfing candle off from the SMA100 support (white arrow). In this environment, big drop from >$10k consolidation meeting strong support SMA100, this kind of engulfing candle is nicely bullish thing to happen. Inside that long consolidation after the $13880 top these green weekly engulfing candles didn’t cause that much buying, but now there is a bigger possibility that the bull whales keep on buying this more because of this kind of weekly candle.
Many analysts probably see this pattern after $7714 bottom as a bear flag consolidation before short term trend continuation down, but as this could happen, it is not wise to trust this kind of thinking too much. We have met a big support here and can now see little bullish reaction from it (weekly engulfing candle). This short term consolidation near lows could be accumulation before pump to the next higher resistance level.
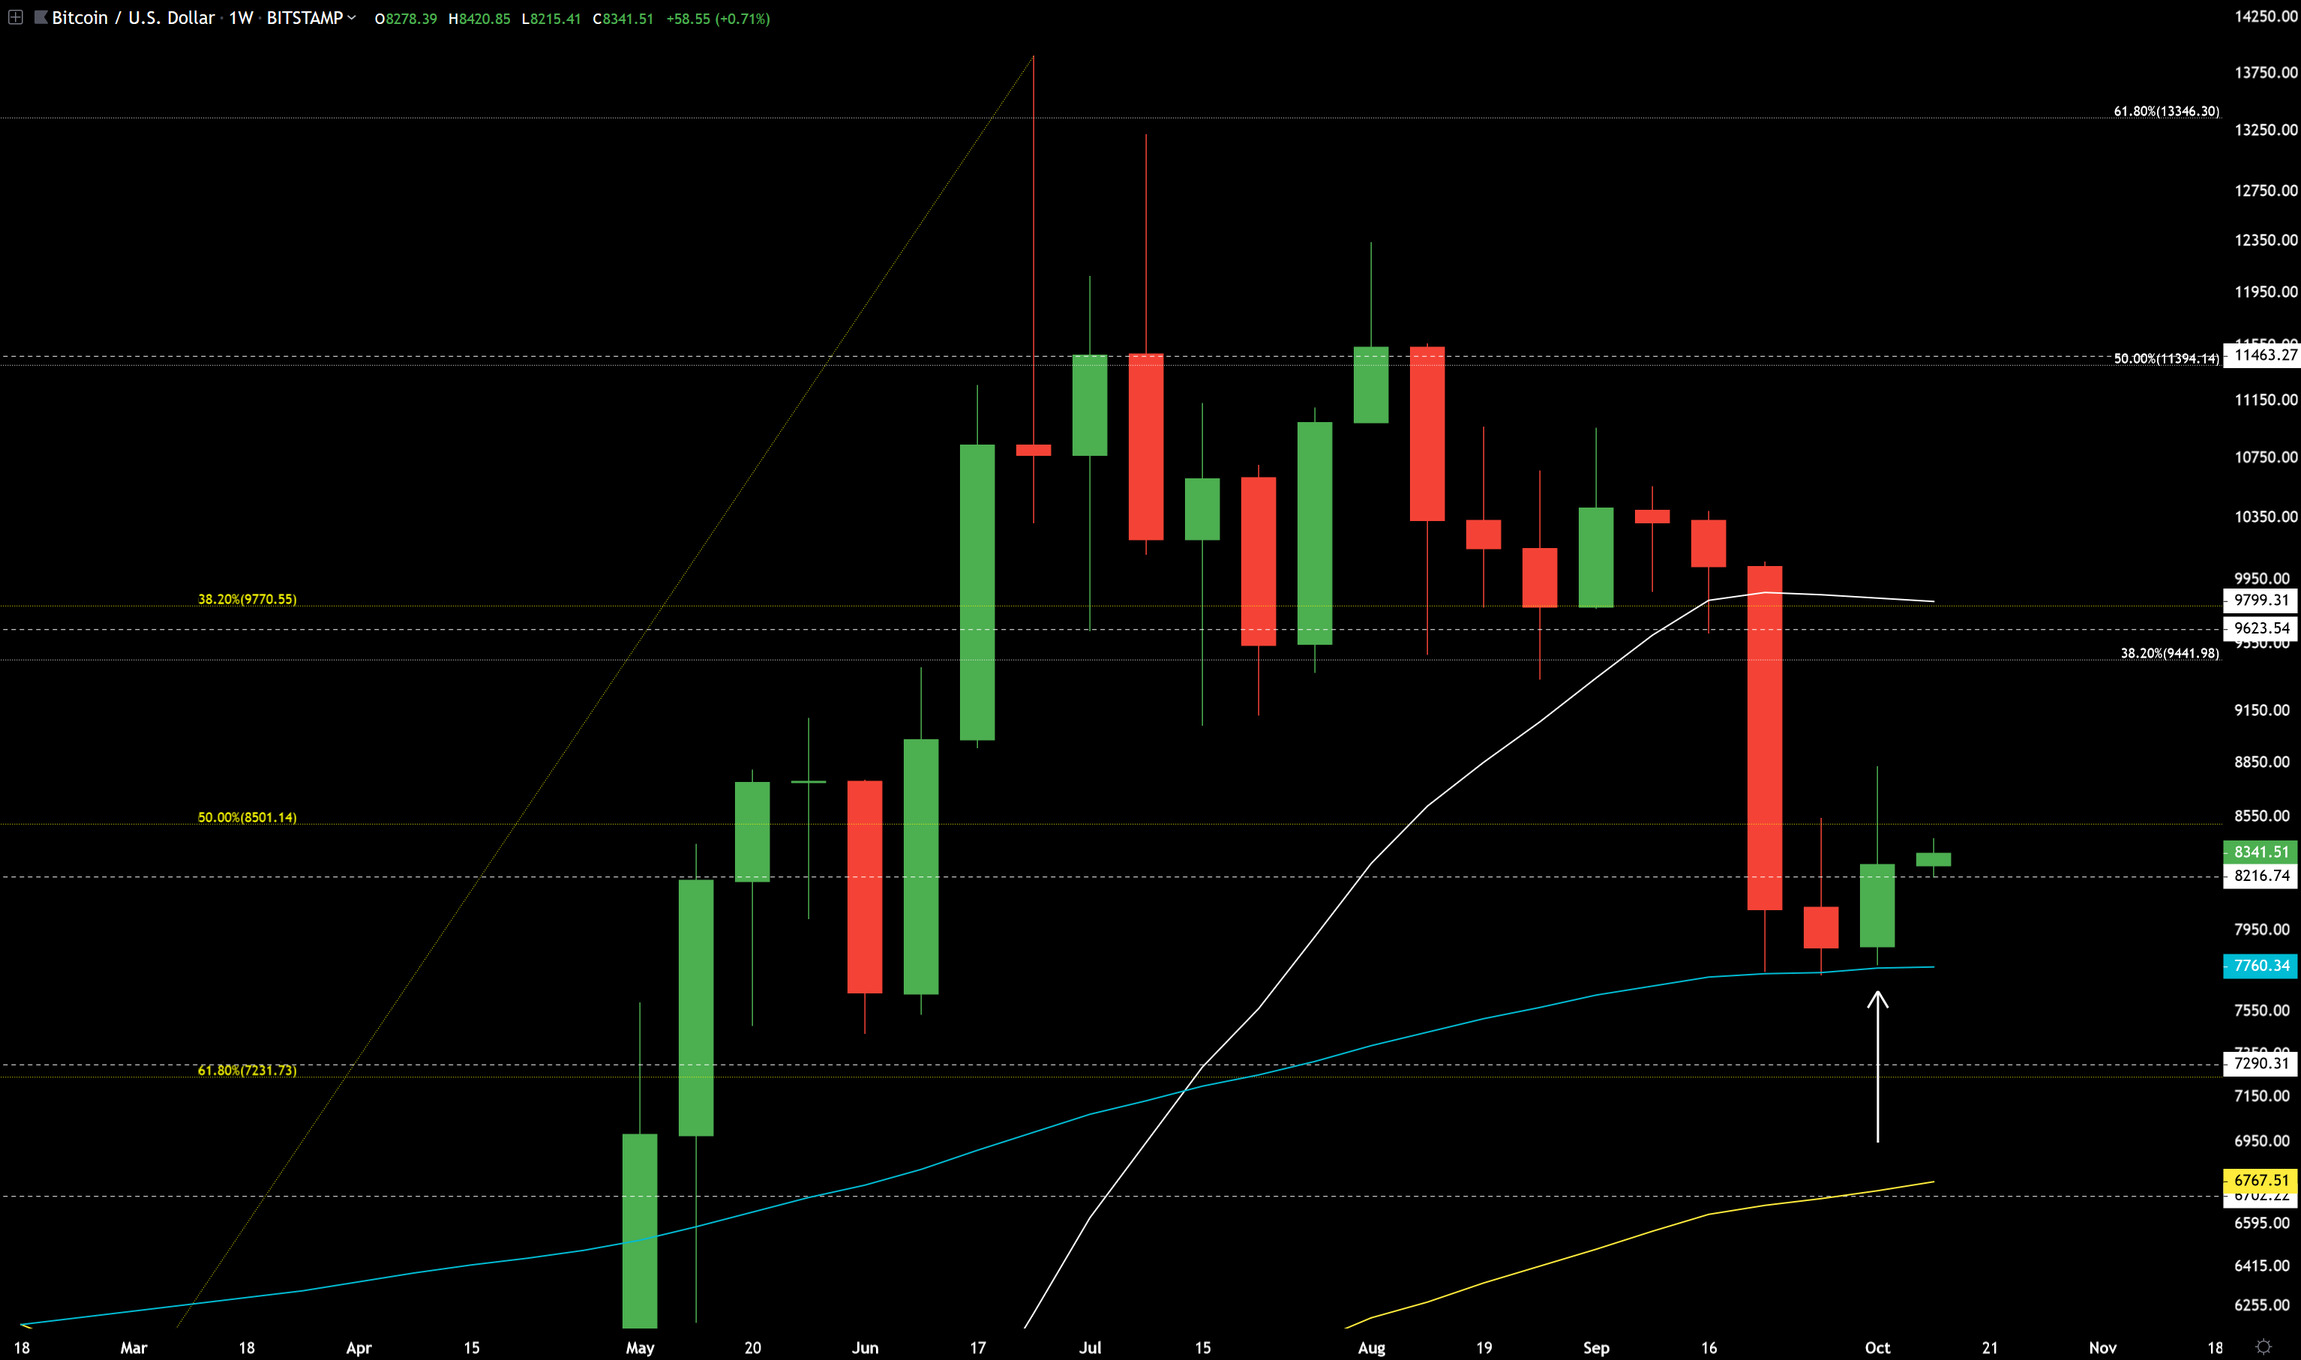
Same chart zoomed in a bit. Now let’s look at the resistance levels above and support levels below for the movement which will follow when this current consolidation ends.
Above we have the 38% fibonacci level from the bear market at $9441, weekly horizontal level at $9623, yellow 38% fibonacci level at $9770 and SMA20 at $9800. With all these S/R levels there it seems obvious that, if the price gets moving up from here, it will soon reach this area at $9441-$9800.
I can see it as a possibility what to think carefully that the price will just shoot right through this level and leave bears crying in this trap, but traders have their short term tricks to see reactions from these S/R levels and then based on these they decide what to do once the price reaches these. My own short-term tricks are too valuable information to reveal for the public. If you’re a trader, you have to come up with your own to be successful.
Knowing the S/R areas is very important, knowing which moving averages or horizontal lines to trust and when, but learning how price reacts close to these areas and what it means is important too.
Below as support levels we have weekly horizontal level at $7290, yellow 62% fibonacci level at $7231, another weekly horizontal level at $6702 and the SMA50 at $6767. If the price breaks down from SMA100, then I think drop to SMA50 is a bit more likely than stopping at 62% fibonacci level. It looks better on chart like that to my eye, but long-term 62% fibonacci levels are always strong supports so it’s important to watch closely what happens there too.
SMA50 is a very strong support. I do not believe weekly candle will close below it even, if we drop more from here. Whales will be buying that moving average in frenzy (while most will be very scared, if bitcoin is going to die (again)).
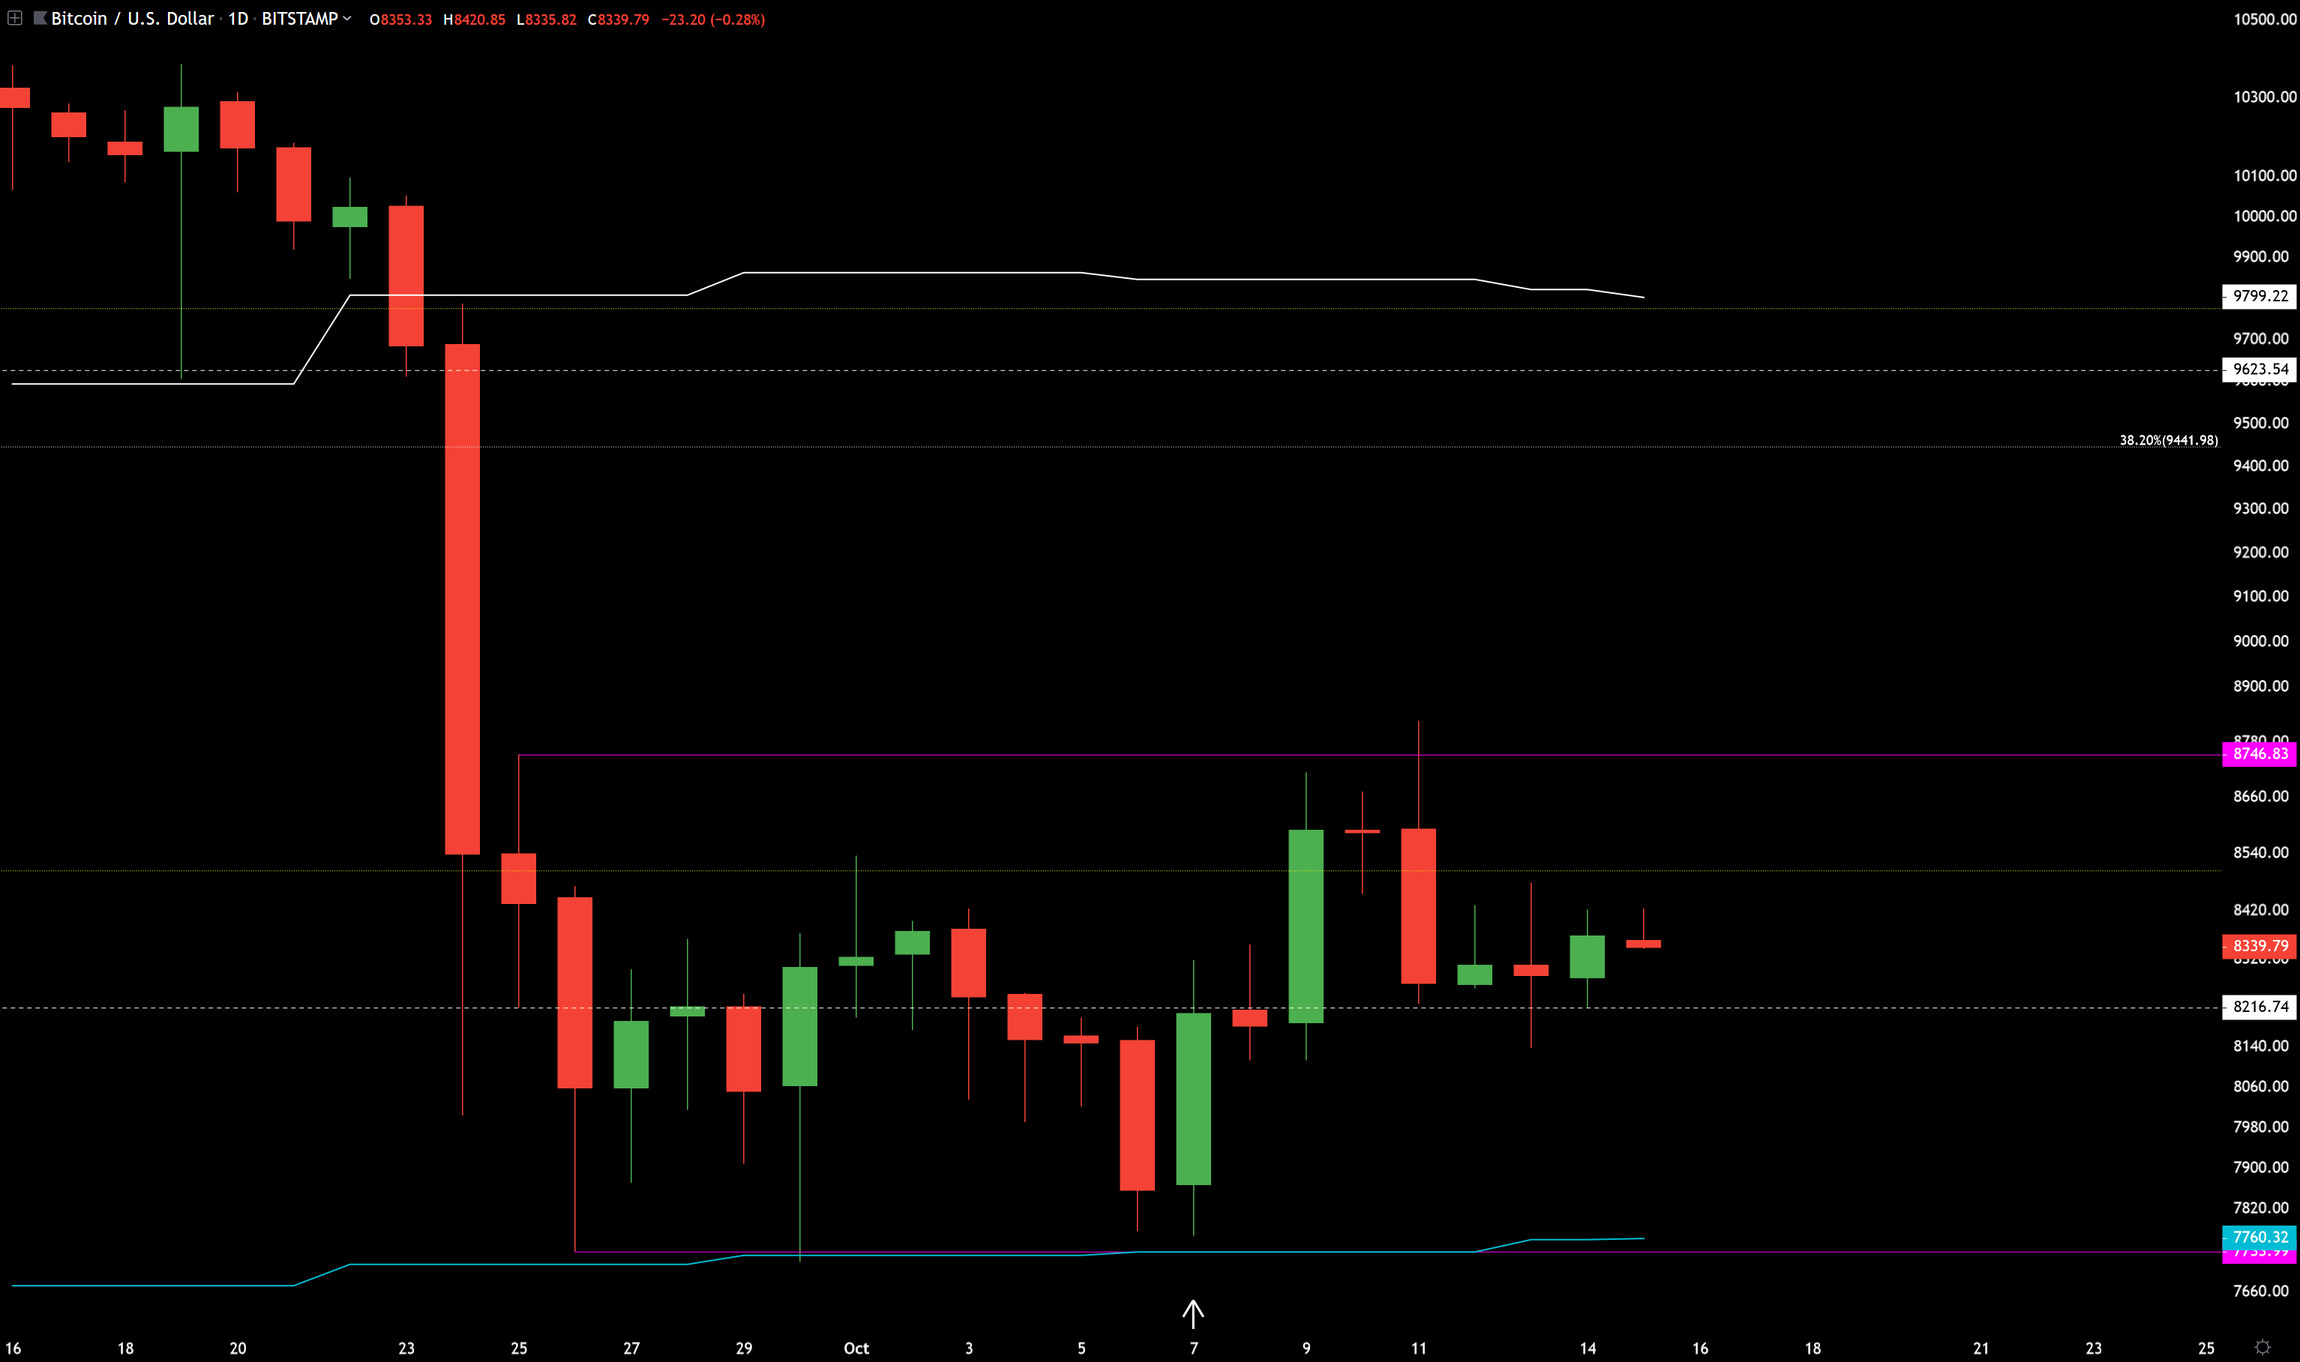
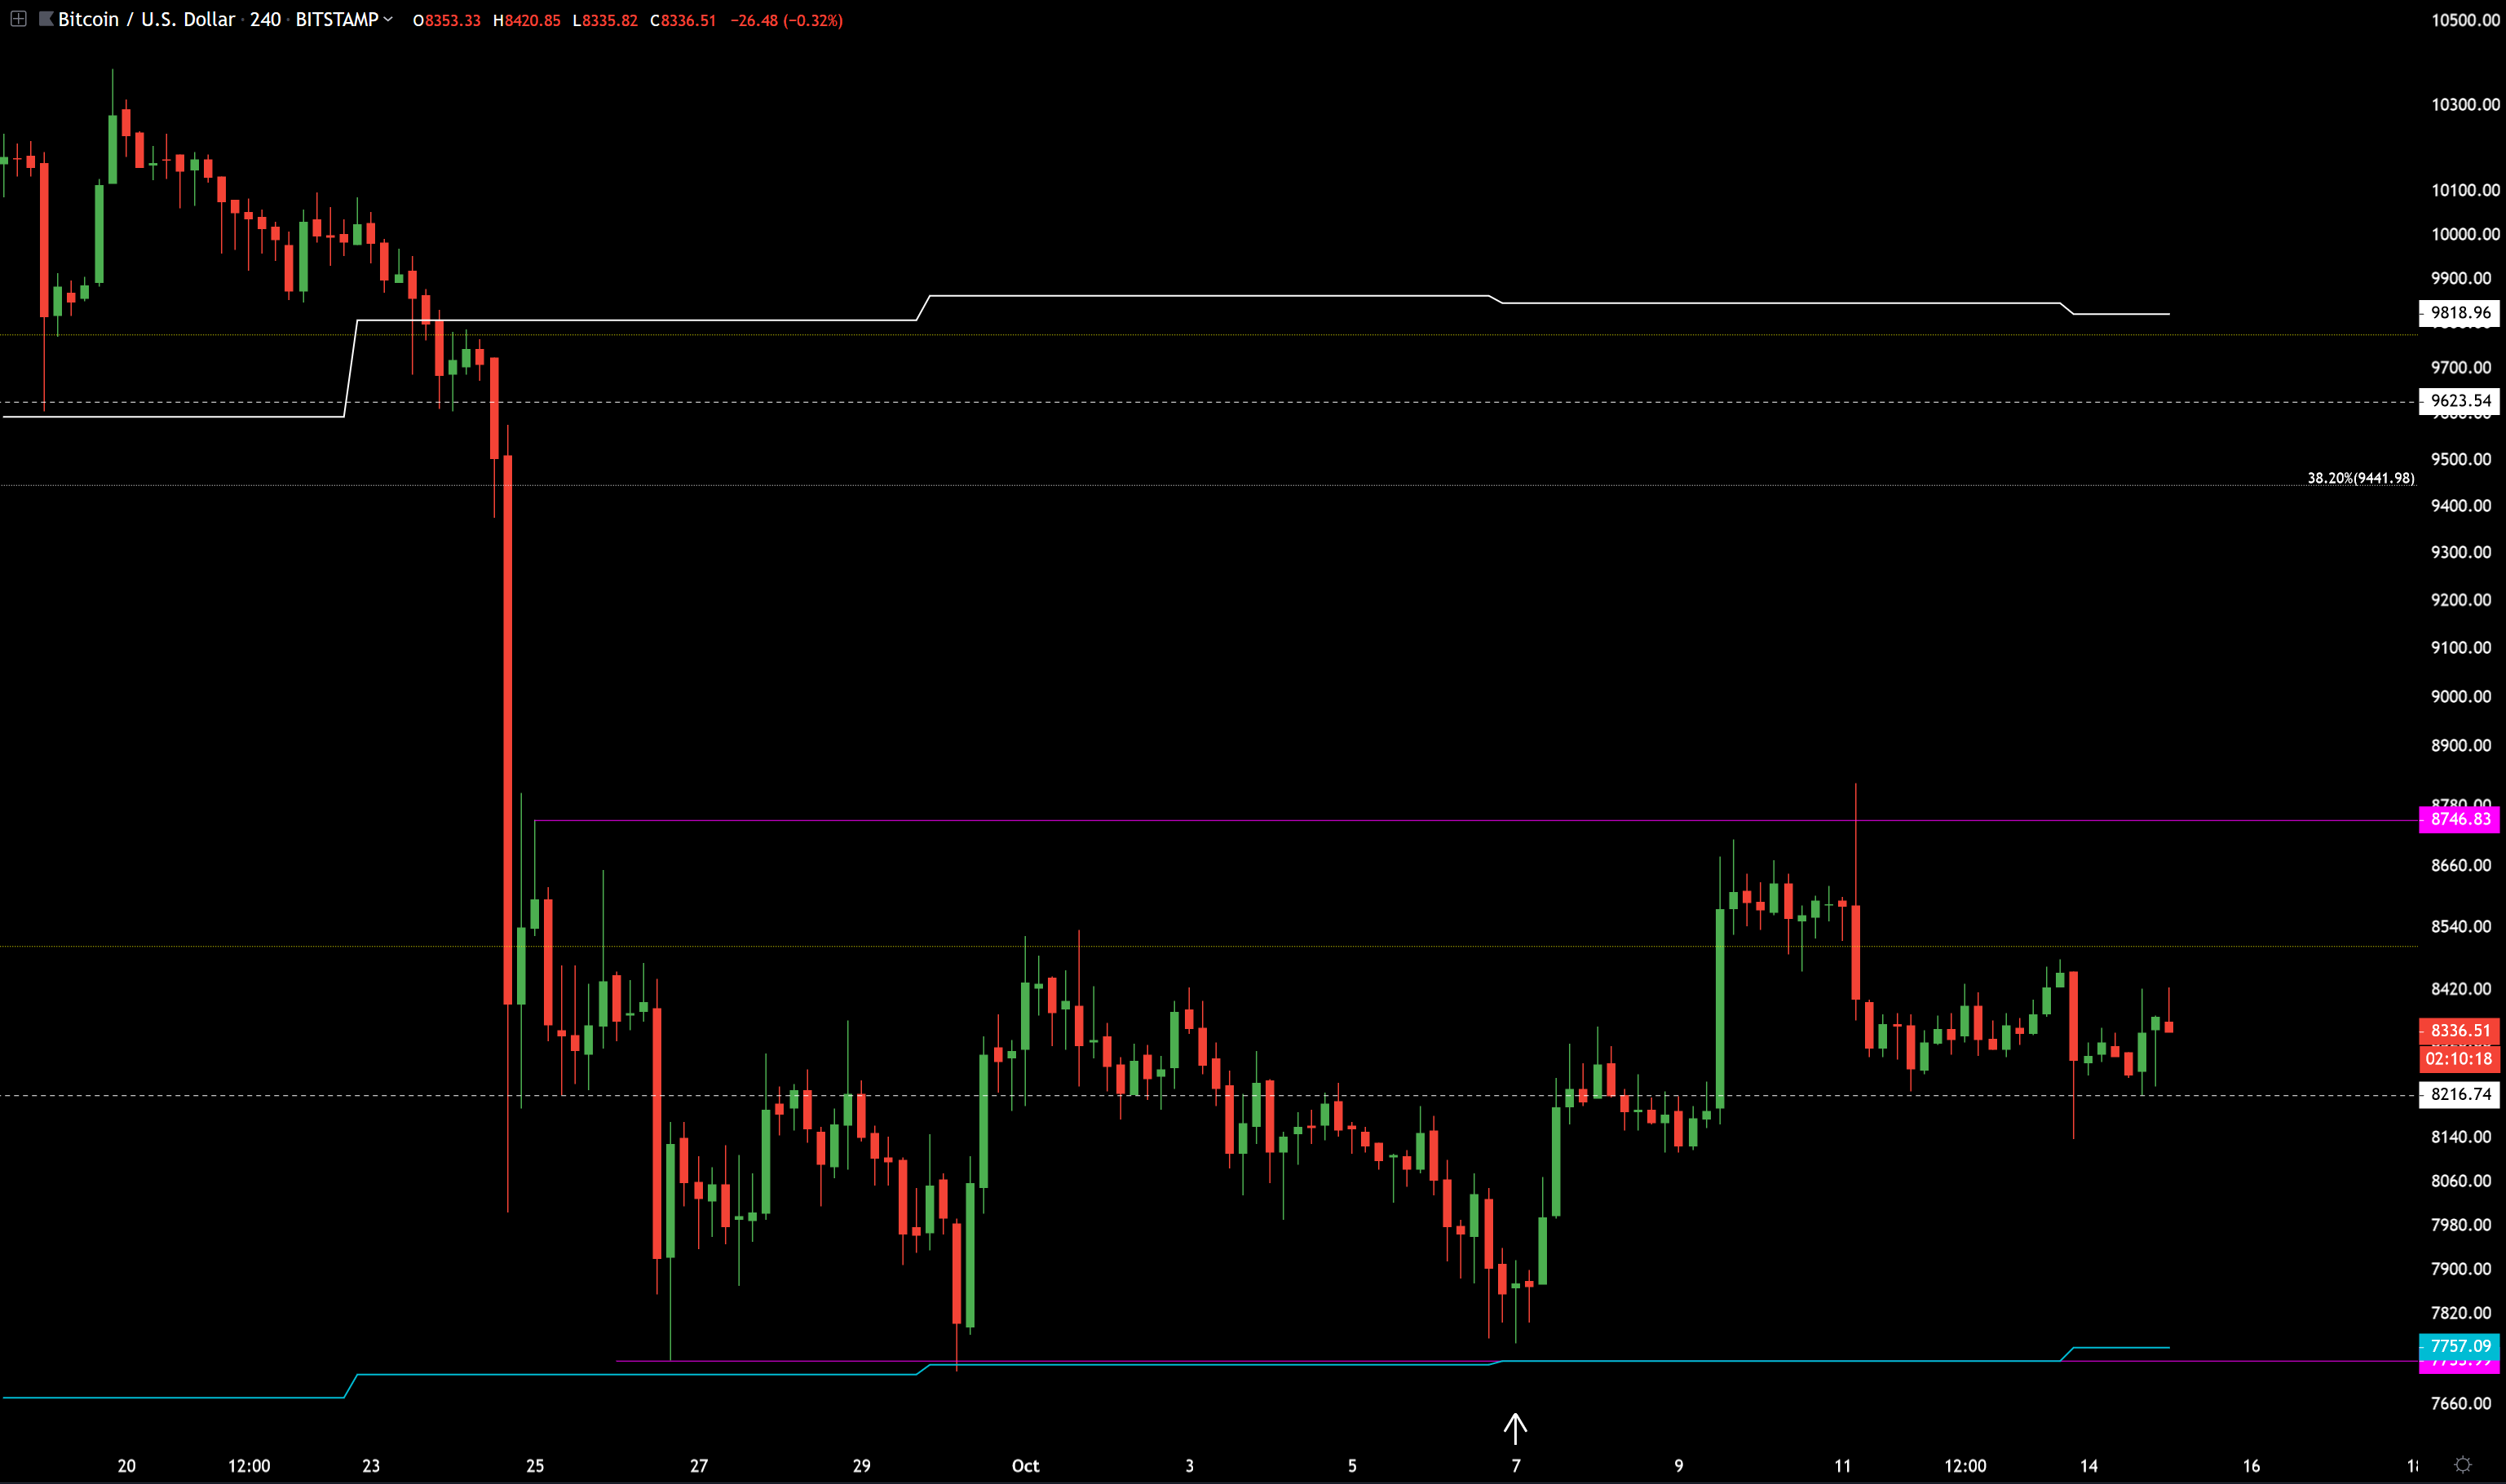
Same tools on 1 day and 4 hour charts, but with few daily horizontal lines added (pink). Now lets see what could end this consolidation and get the price moving to the above resistance levels or to the support levels below.
If the 4h candle closes above that pink upper daily horizontal level, it will be pretty good sign that the consolidation has ended and if daily closes above that then that will be a very good sign. Daily is less risky, but can give a lot higher entry price.
Vice versa if the 4h candle closes below the pink bottom daily horizontal level and the weekly SMA100 it will be a good sign that the breakdown is about to happen, daily giving more certainty.
I wrote a bonus article between analysis in which I try to simply explain why bitcoin is so good investment and why technical analysis works.