

The technical analysis of week 40 assesses the potential for the “Uptober phenomenon.” Additionally, we are mapping out expert Charles Edwards’ statements related to halving and allocations. We are also examining the historical cyclicity of bitcoin and finding out why the GBTC is the leading indicator for the market.
The cryptocurrency market has continued its sideways movement from last week, with bitcoin weakening by -0,4 percent. Market sentiment is clearly cautious as investors attempt to price in bitcoin’s upcoming halving in the spring and speculate on the ETF fund’s impact on bitcoin’s price.
Expert Charles Edwards recently analyzed bitcoin’s upcoming halving event, noting that 44 percent of bitcoin’s price appreciation occurs within 12 months following the halving. Bitcoin is currently in the pre-halving cycle, culminating in the halving of the block reward approximately 200 days from now in April.
“44% of all of bitcoin’s returns have occurred in the 12 months after each halving. In other words, all of bitcoin’s cycle returns can be expected to occur soon.” – Charles Edwards
Edwards also mentions his plans to transition to a full crypto allocation by the end of the year. He estimates that the best buying opportunity will occur 4-6 months after the halving. Coinmotion’s TA has previously assessed that the price peak is likely to be formed in the year following the halving, as well.
“My goal is to be fully allocated to crypto by end of this year. Any cash positions I held for the last 12-24 months for rare opportunities will be deployed. Could a better chance come in 2024? Absolutely. But my data suggests it’s best to be allocated 4-6 months out from the halving.” – Charles Edwards
From a purely technical perspective, bitcoin is still trading near its multi-year confluence zone at $29 000 (blue). This particular confluence zone served as a support level for bitcoin in 2021 and 2022 (green) but later turned into a resistance level (red). This year, the zone has acted as both a support and resistance area for bitcoin.
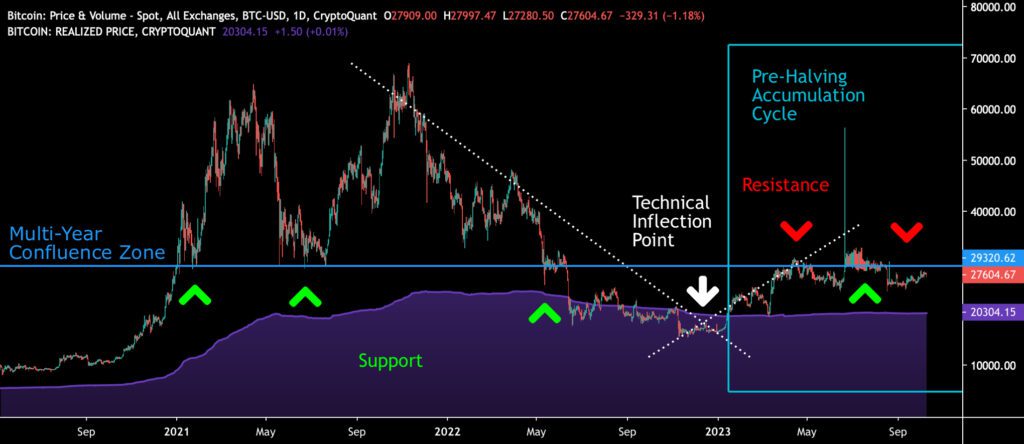
Sources: Timo Oinonen, CryptoQuant
The purple wave of realized price, located around the $20 000 mark, acts as a lower support level for bitcoin. Realized price is commonly considered a market watershed because it represents the average price of all bitcoin purchases. At the same time, the difference between the $27 000 spot price and the $20 000 realized price indicates that the majority of bitcoin investors are still in profit.
According to the Material Indicators heat map, a strong support level is forming around the $27 000 price, which provides hope for spot price upside. The Cumulative Volume Delta (CVD) still indicates a high appetite among large market participants.
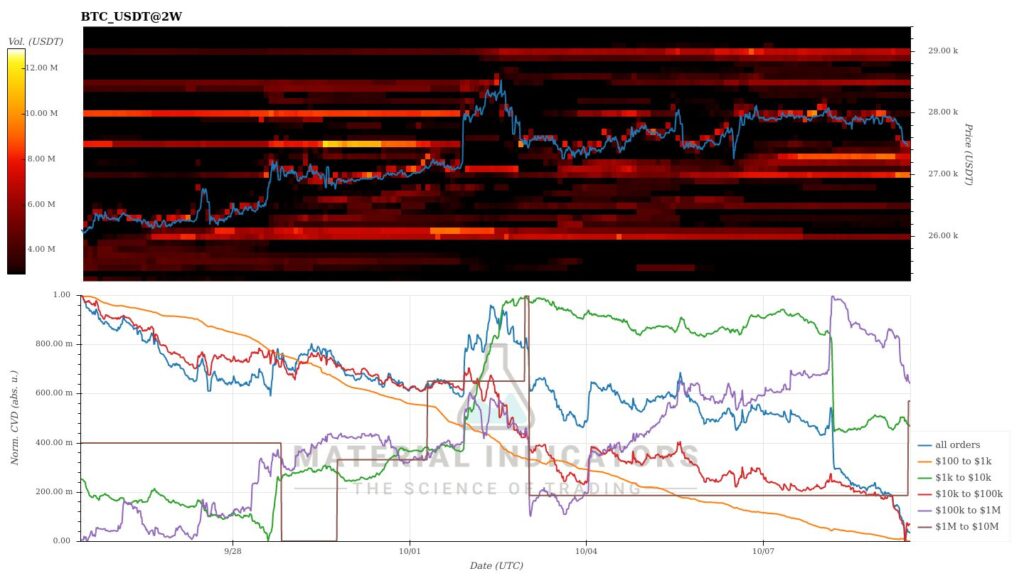
Source: Material Indicators
As the weekly performance of the cryptocurrency market continues to remain mildly negative, bitcoin still maintains its position at the top of the Coinmotion repertoire, rising 64 percent since the beginning of the year. The second-largest gain in the year-to-date (YTD) metric belongs to XRP (44 percent), which received a boost in the summer due to the U.S. Securities and Exchange Commission’s (SEC) commodity classification. Closely correlated with XRP, Stellar has strengthened by 43 percent since January.
This year, the market has witnessed a clear “redistribution of wealth” as the SEC classified bitcoin, Ethereum, and XRP as commodities, further solidifying their positions. Meanwhile, the year-to-date performance of many smaller tokens has remained rather lackluster, with Cardano, Litecoin, and Uniswap still in the negative. Uniswap’s YTD performance is notably down by a brutal -21 percent.
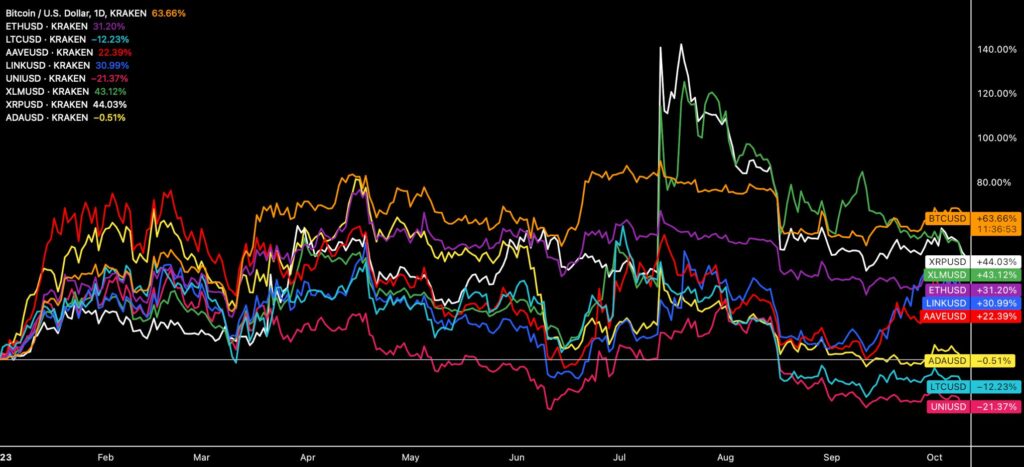
Source: TradingView
7-Day Price Performance
Cardano (ADA): -3,4%
Bitcoin’s Cyclicality Indicates a Reached Market Bottom
The Bitcoin market is characterized by cyclicality, defined by halving events that recur every four years. The next halving is now less than 200 days away, scheduled for April 2024. You can also grasp Bitcoin’s cyclicality by comparing spot price peaks to previous years.
Compared to previous cycles, bitcoin’s spot price capitulation was seen at the turn of the year, representing a multi-year technical inflection point. As the chart below illustrates, the current bitcoin cycle (2021-2023, turquoise) strongly correlates with the 2013-2015 cycle (violet) and the 2017-2019 cycle (red). Just like in previous cycles, bitcoin hit its market bottom after approximately 300 days in this cycle as well.
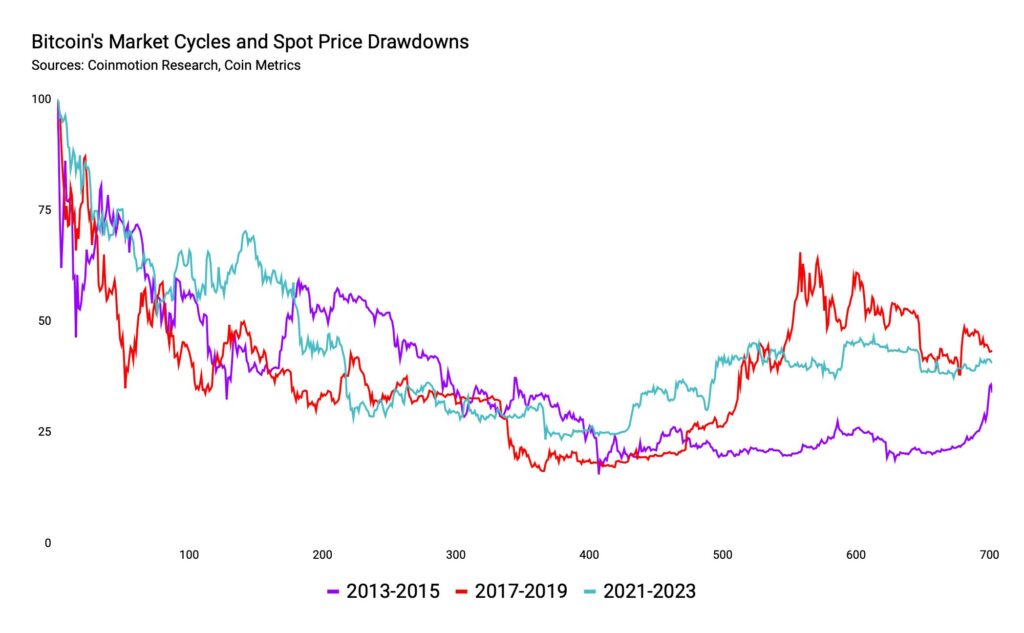
Sources: Coinmotion Research, Coin Metrics
A more detailed analysis of the chart shows that the current cycle closely mirrors the 2017-2019 cycle. In 2019, BTCUSD embarked on a steep relief rally in the summer, reaching nearly $13 000 in June. Bitcoin’s relief rally this year has been more modest but still achieved a 64 percent year-to-date (YTD) growth figure.
Bitcoin’s more modest performance compared to 2019 can be attributed to factors such as the quantitative tightening (QT) period and a high-interest rate environment. In 2019, cryptocurrencies were supported by quantitative easing (QE) and an extended period of near-zero interest rates. Particularly during the COVID era, quantitative easing led to a depreciation of the dollar, flowing into high-beta asset classes like bitcoin and smaller tokens.
GBTC as a Signal in the Storm of Uncertainty
Grayscale’s Bitcoin Trust (GBTC) has achieved an iconic status in the cryptocurrency space over the years. Launched as early as 2013, Grayscale has been a pioneer, owning 3,065 percent of the theoretical total supply of 21 million bitcoins. The company’s balance sheet consists of a total of 643 572 bitcoin units.
Particularly in 2020-2021, Grayscale’s GBTC gained popularity among institutions due to its significant premium. Hedge funds used GBTC for the famous “arbitrage trade,” which aimed to benefit from GBTC’s premium within a 6-month lockup period. This arbitrage worked until February 2021, and it can be argued that a significant portion of institutions entering the Bitcoin scene took advantage of this particular anomaly. As is typical with anomalies, its window of opportunity closed, and in 2021, the premium that had reached over 33 percent turned into a discount.
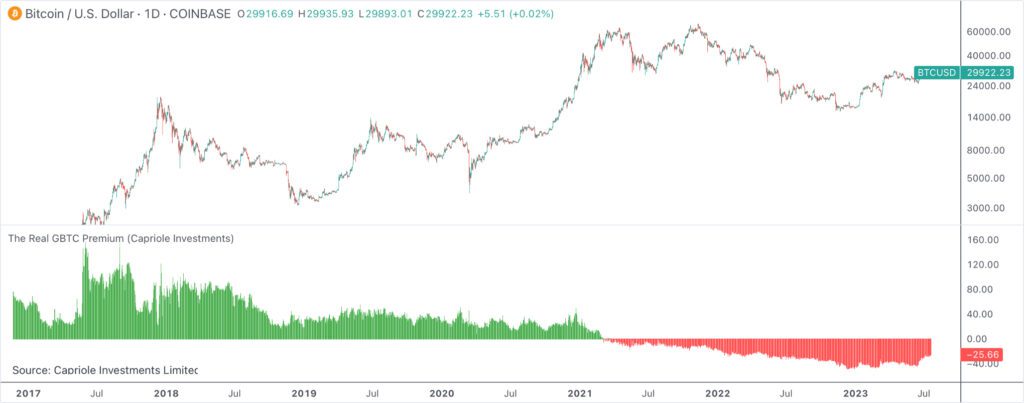
Source: Capriole Investments
The shift from a premium to a discount was a significant paradigm shift for the GBTC fund, exerting selling pressure on the underlying asset class bitcoin. The discount can also be considered a market watershed, with the spot price following the premium down in a delayed correlation.
After nearly two years of a discount period, the premium is once again approaching zero, anticipating a possible ETF conversion. The rising premium can also be viewed as a leading indicator for bitcoin, while GBTC has been on the rise over six-, three-, and one-month periods. Historically, the correlation between GBTC and the bitcoin it holds has been strong, so this setup may act as a magnet for the bitcoin spot price.
For investors with a high-risk profile, the setup continues to offer the opportunity for a “discount trade,” where GBTC shares are purchased at a discount of around twenty percent. This trade naturally relies on the scenario where the ETF conversion becomes a reality.
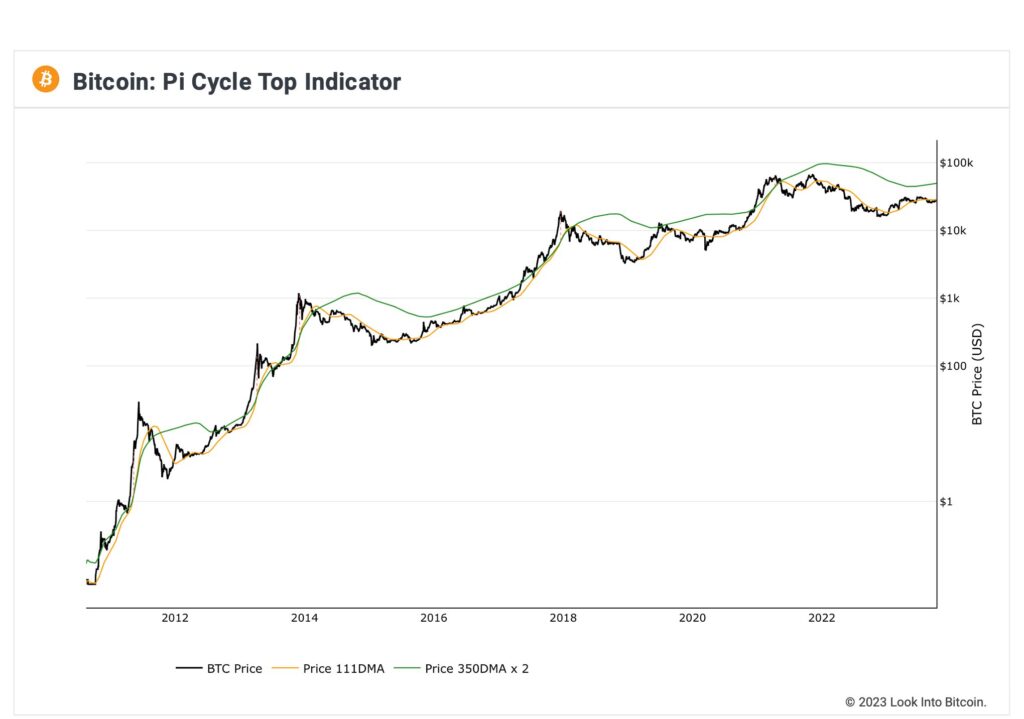
The Pi Cycle Top Looking Towards 2024
Despite market uncertainty, bitcoin’s technical setup still appears favorable. One positive technical indicator is the Pi Cycle Top indicator developed by Philip Swift, which consists of a 350-day moving average multiplied by two (green).
Now, the green Pi Cycle Top and the yellow 111-day moving average are once again converging, forming a pattern reminiscent of 2019. This technical structure, along with the upcoming 2024 halving, anticipates a modest spot price growth angle.
Source: Look Into Bitcoin
What Are We Following Right Now?
A long analysis by Lyn Alden on the macro market, dollar hegemony, and the “Fourth Turning” based on Strauss-Howe generational theory.

Analyst Raoul Pal’s thesis on the “exponential age.” According to Pal, technological advancement is continuously accelerating. Furthermore, he argues that there are several technological disruptions on the horizon, such as artificial intelligence, blockchain, cryptocurrencies, and biotechnology, all of which are progressing exponentially. This means that the applications of these technologies and their impacts are growing faster than linearly.
These technological changes have profound ripple effects on the economy and society. They can create new opportunities but can also cause significant disruptions to traditional industries and job markets. For investors, the exponential age means that traditional investment strategies may become outdated, and they must consider the rapidly changing technological landscape.

The Empire podcast delves into the intricate phases and details of the legal proceedings involving Sam Bankman-Fried, the founder of FTX exchange. Expert opinions on the potential length of Bankman-Fried’s future sentence have ranged from decades to as much as 115 years.

Stay in the loop of the latest crypto events
- Dive into Cardano (ADA): A newcomer’s comprehensive guide
- 200 Days Until the Halving: Bitcoin’s Next Chapter
- Risk management strategies to minimize losses: Lesson #9
- Identify trends, buy and sell signals with technical indicators: Lesson #7
- How to send money home via crypto: Remittance made easy
- Continuing the Transformation: Coinmotion Welcomes New CEO Antti-Jussi Suominen
- Aave: The DeFi Powerhouse Changing the Crypto Landscape

The views, thoughts, and opinions expressed in the text belong to the author and not necessarily to the author’s employer, organization, committee, or other group or individual.