The technical analysis of week 45 digs into multiple bitcoin metrics including: Estimated leverage ratio (ELR), exchange reserves, and deposits. We also explore Ethereum’s deflationary future.
Estimated Leverage Ratio (ELR) Reaches New Highs
Estimated Leverage Ratio, or ELR, is a metric that measures the amount of leverage exposure in derivative exchanges. The ELR reached new highs this week, reaching 0,199 on 9th November. The estimated leverage ratio is calculated by dividing open interest by the amount of reserve. High ELR indicates investors increasing risk and low ELR traders derisking, vice versa.
Estimated Leverage Ratio = Open Interest ÷ Amount of Reserve
High ELR: Investors Increase Risk
Low ELR: Investors Decrease Risk (or Derisk)
The early 2021 data shows how bitcoin’s price (BTCUSD) and ELR were correlated until May’s price correction. The market deleveraged following the correction with ELR dropping to 0,1 level. However when BTCUSD continued to slide down, ELR quickly reached towards pre-correction levels, creating a divergence between the two indicators. This divergence could be interpreted as smart money being bullish on bitcoin and willing to increase risk, despite the falling spot price.
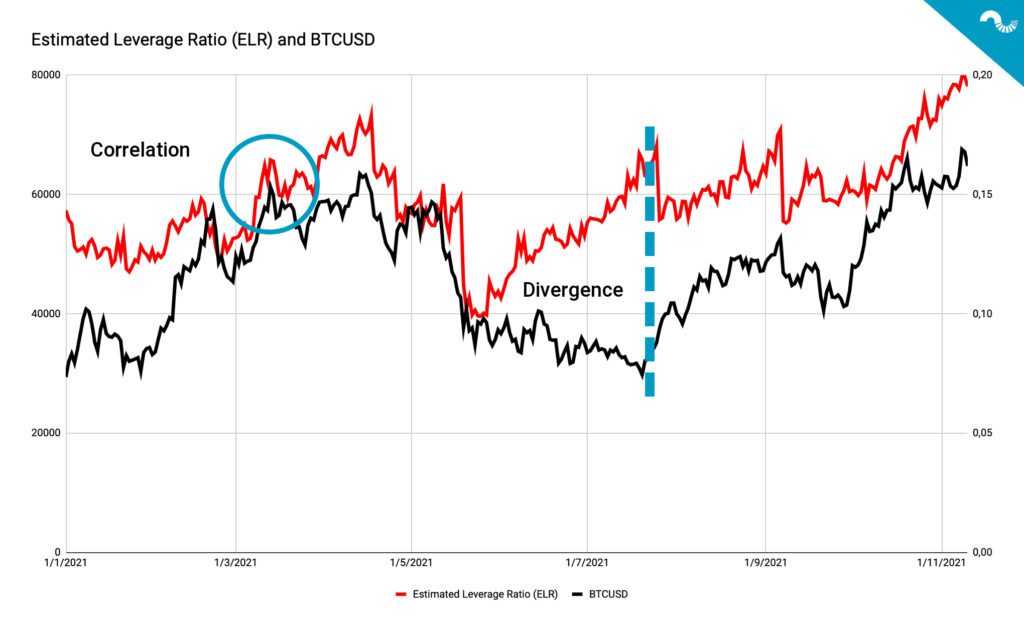
In the third (Q3) and fourth (Q4) quarters ELR has been more correlated with bitcoin’s spot price again and the two indicators have ascended towards the end of 2021. The ELR started to drop slightly towards the weekend of week 45, which might not be a bad sign. The excessive amount of leverage starts to act as a speculative ballast for bitcoin’s price and needs to be flushed out on a timely basis.
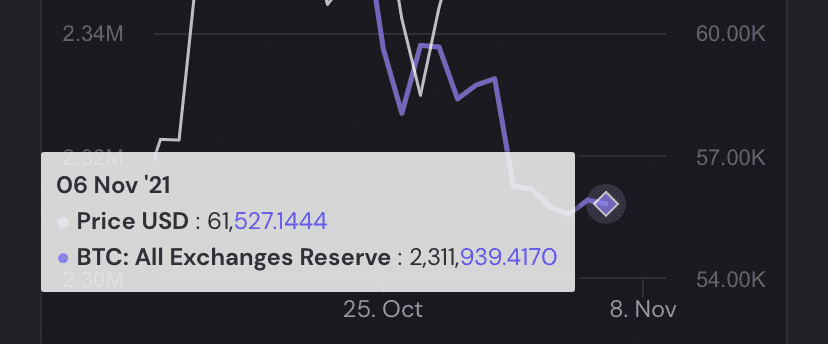
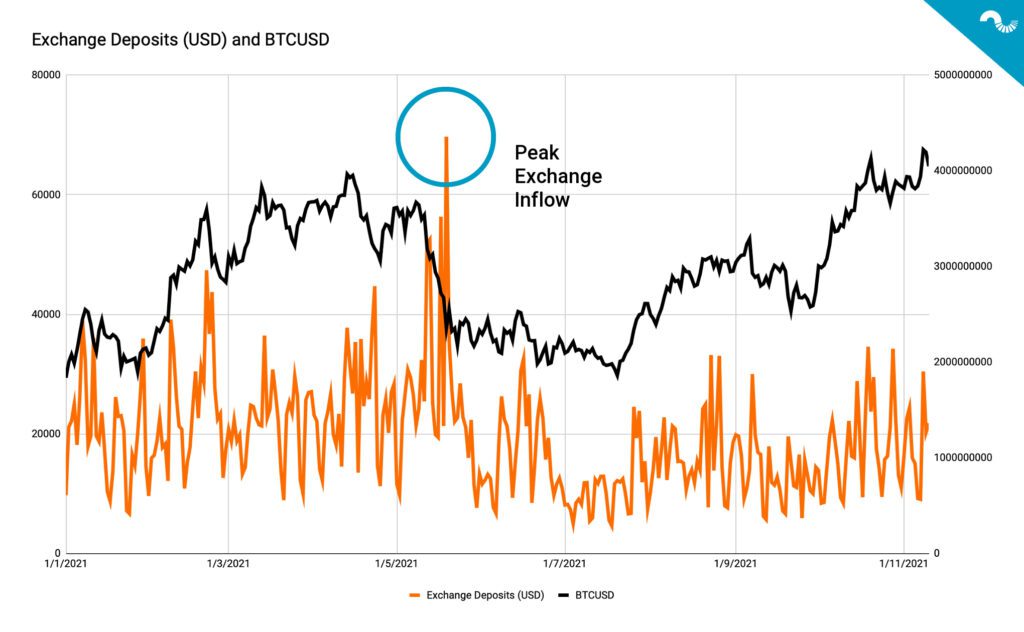
Exchange reserves are at 2021 bottom and platforms only hold approximately 13 percent of bitcoin’s circulating supply, i.e. 2,31 million native units. Low exchange levels have been a bullish sign as they have been a bullish indicator as by reflecting long-term bitcoin holding in cold storage. As a contrast the rising exchange reserves are by default caused by assets flowing into exchanges, in order to convert them into FIAT form or other digital assets. Exchange deposits are steady but still below spring 2021 figures. Low amount of exchange deposits might also indicate trades happening outside popular exchanges, in OTC markets.
Ethereum’s Supply Approaches The Peak
Cumulative Value of ETH Burned after EIP-1559
September: 2021: 1,35B USD
October 2021: 2,52B USD
November 2021 (so far): 3,11B USD
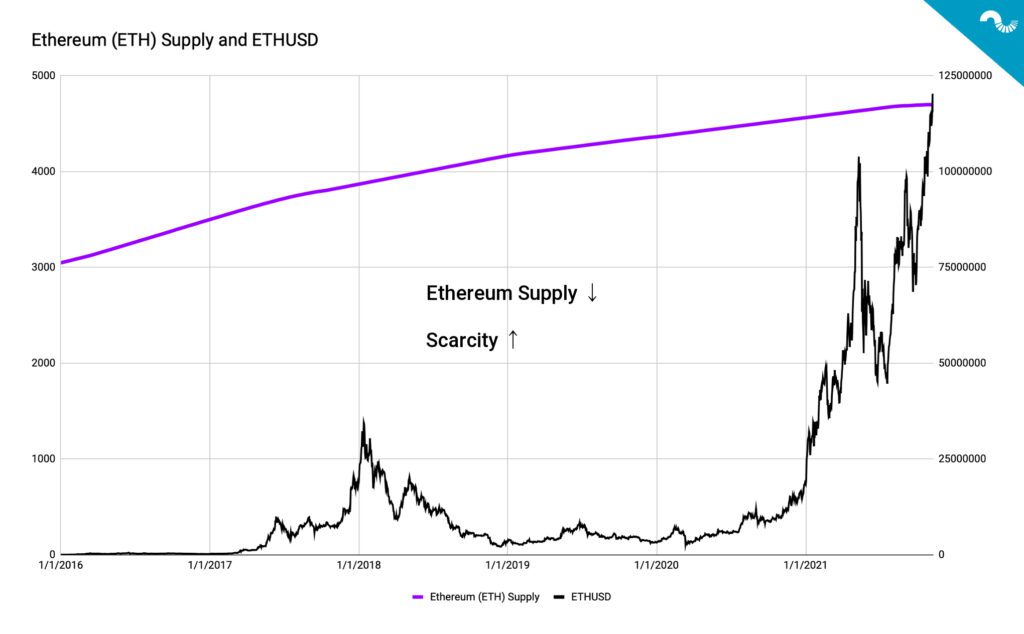
While Ethereum has been following Bitcoin’s price performance, it recently has been trying to absorb some features vis-à-vis BTC. Ethereum’s recent upgrade package EIP-1559 implemented a number of enhancements, the most important change being Ethereum’s increasing scarcity. In relation to Bitcoin, Ethereum has long been seen as the “uncapped” DeFi platform, in contrast to “digital gold”. The EIP-1559 is radically reducing Ethereum’s supply, which is expected to peak around April, according to recent data.
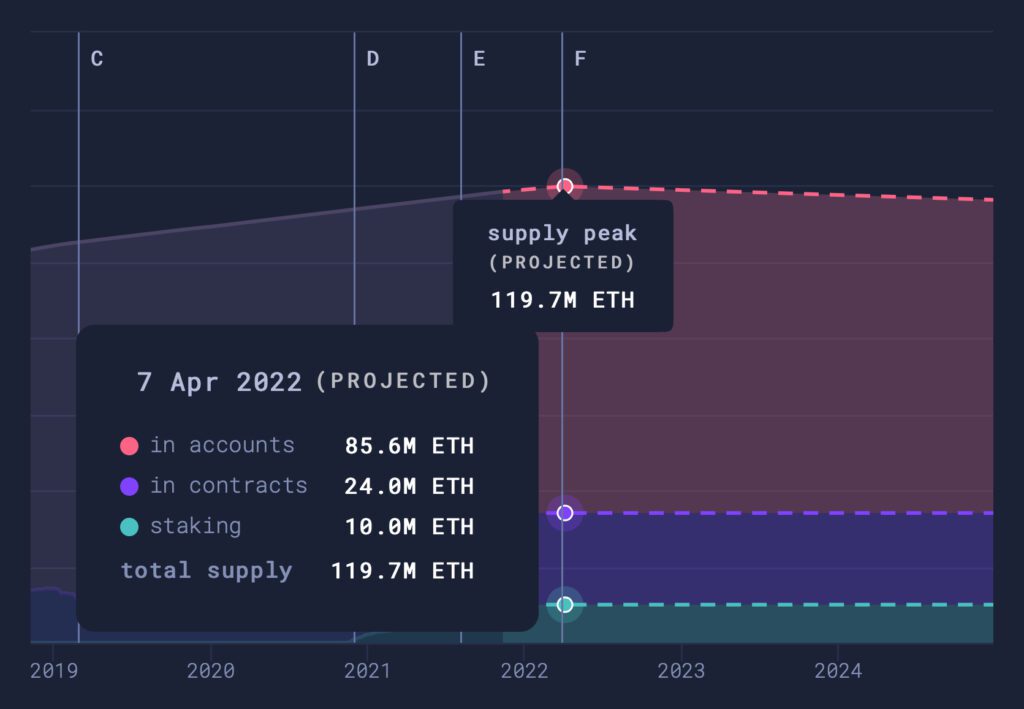
The upcoming supply peak, projected to reach a total of 119,7 million native Ether units will ultimately make Ethereum as a scarce asset. And what is even more interesting, after the supply peak Ethereum’s units in circulation will gradually decrease, rendering it a deflationary asset. As we know by bitcoin and gold, scarcity has a tendency to drive to price up.
Although the EIP-1559 promised to lower Ethereum’s notoriously high gas fees, that hasn’t been the reality. Ethereum’s gas fees are currently at 155,7 gwei, at the same level as in spring 2021 bull cycle. Furthermore Ethereum is facing growing competition from younger projects like Solana (SOL). Using Solana as a reference, it doesn’t weight decentralization that much, but instead focuses on network speed and usability. Ethereum needs to find its own niche in the new competitive environment and creating value by deflationary supply is a good path.
