
Technical analysis for week 47 interprets the recent market correction, how long-term holders are making profit, and what will happen next.
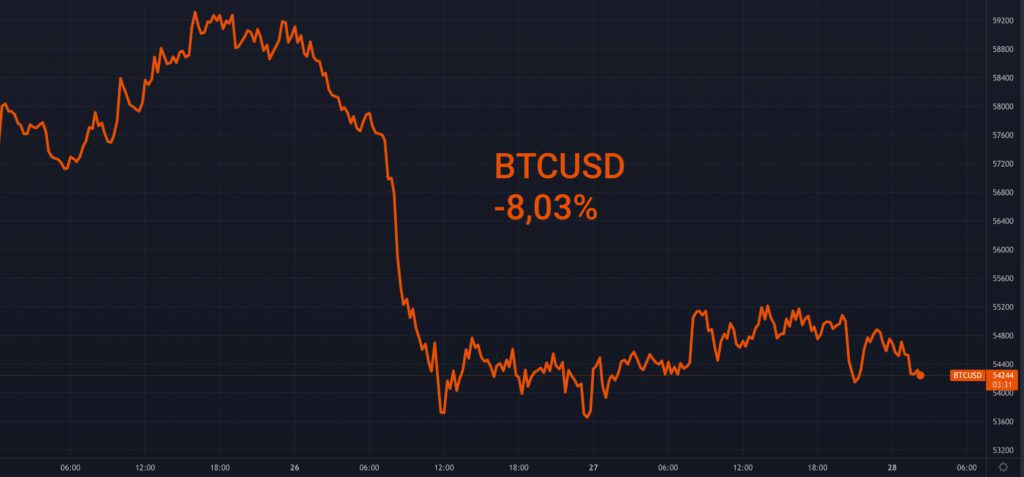
Markets Stirred by New COVID Variant, Bitcoin Down -8%
The emergence of a new coronavirus variant Omicron profoundly scared the markets this week, sending bitcoin to a -8 percent decline. In addition to cryptocurrencies, Omicron also caused panic in stock market. Bitcoin and particularly small-cap speculative digital tokens have seen an inflow of new retail money recently, however they have also attracted a lot of speculative leveraged money. Bitcoin’s estimated leverage ratio (ELR) dropped slightly from Friday’s 0,217 to Saturday’s 0,208, mirroring a deleveraging market. A decreasing leverage would be healthy for the market as excessive leverage has a tendency to prevent spot price hikes.
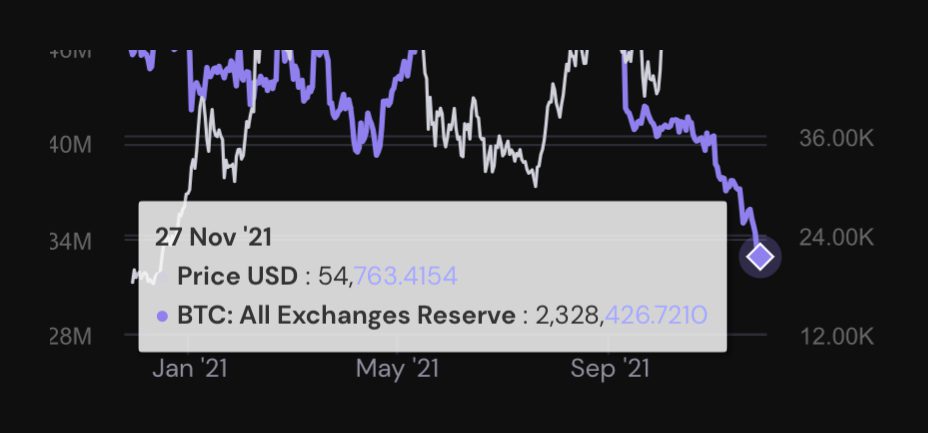
Somewhat unsurprisingly bitcoin’s exchange reserves continued to drop, recording a new yearly low at 2,328 million units. The continuing decrease of exchange reserves indicates and increasing outflow of funds, a bullish trend for bitcoin’s spot price. By default the decreasing exchange reserves mirror more long-term holding and increasing exchange reserves mean selling pressure, respectively.
SOPR: Long-Term Holders Making Profit, Short-Term Holders Taking Losses
The year 2021 has been extraordinarily fascinating for bitcoin’s spot price, including the double tops in quarter two (Q2) and ongoing quarter four (Q4). The previous year 2020 is known for institutional adoption, initiated by Michael Saylor, and investors who entered the market in 2020 are certainly now in profit. For further research the SOPR, or Spent Output Profit Ratio, is a good instrument for estimating the profit ratio of different market participants.
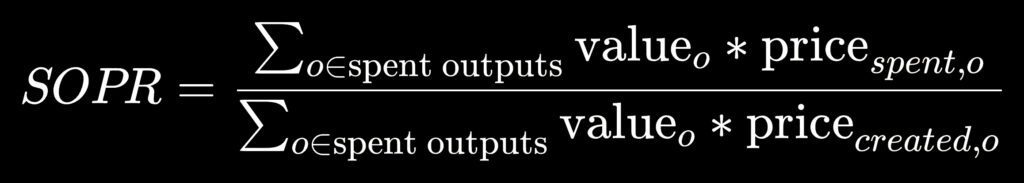
The SOPR indicator, originally created by Renato Shirakashi, is calculated by dividing the realized value (USD) by the value at creation of the output. Or more simply: Price sold divided by price paid. SOPR indicator can be interpreted by following logic:
SOPR > 1 = Sellers at a Profit.
SOPR < 1 = Sellers at a Loss.
SOPR indicator is usually divided into Short-Term Holder SOPR (STH-SOPR), and Long-Term Holder SOPR (LTH-SOPR).
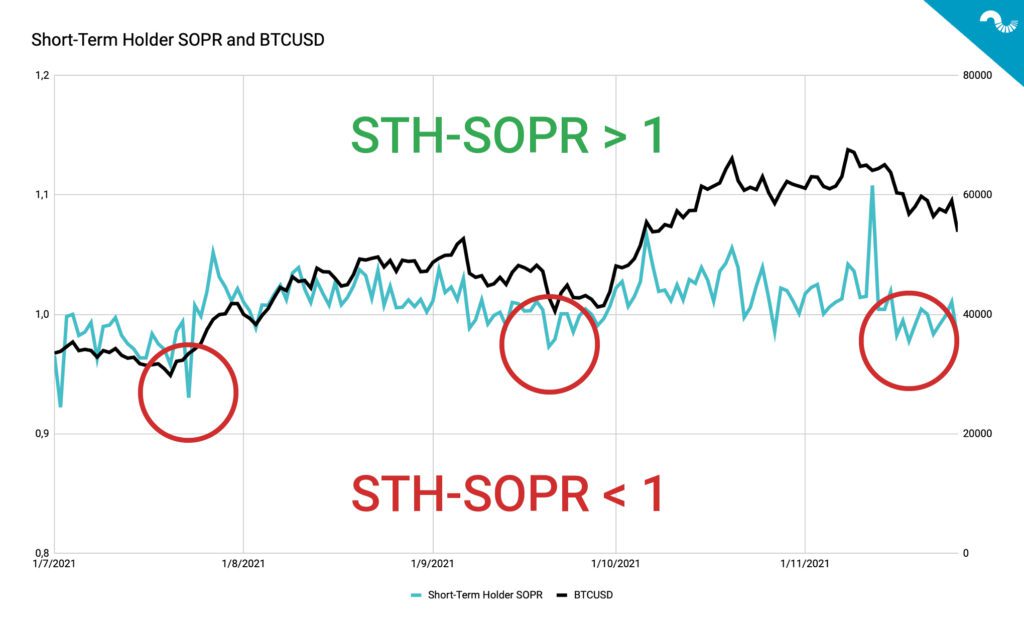
Short-Term Holder SOPR
As mentioned, a SOPR less than one (< 1) indicates sellers being at a loss. Looking back at data from July 2021 onwards, the short-term holders have been at a loss on multiple occasions during each month. Short-term holders were taking notable losses in mid-July, September, and recently in November (red circles). The average SOPR for short-term holders in H2 2021 was 1,008.
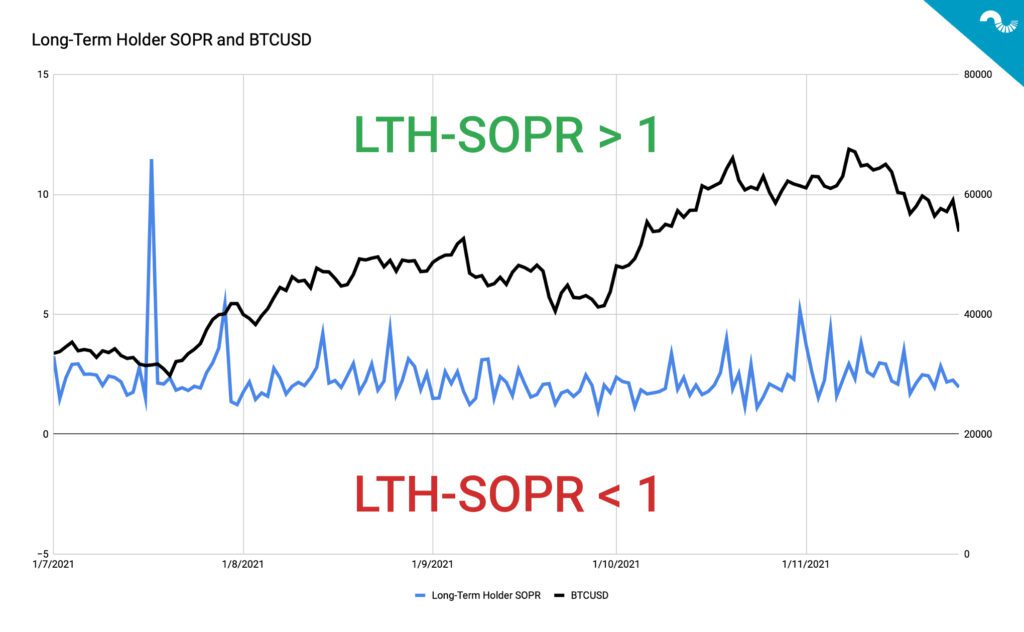
Long-Term Holder SOPR
In sharp contrast to short-term holders, the long-term investors are well in profit territory, averaging at 2,32 SOPR from July 2021 onwards. The highes SOPR was recorded in July 17th at 11,47, coinciding with the bullish correction of bitcoin’s spot-price. The spent output profit ratio for long-term investors clearly shows the benefit of HODL philosophy in bitcoin market. Buy & hold strategy implemented over long time horizon decreases risk, increases profit, and reduces investor workload.
What’s Next?
The dropping spot price combined with arguably overleveraged markets create fear, uncertainty, and doubt (FUD) among investors, however the long-term outlook remains bullish. As Coinmotion’s chairman Henry Brade recently tweeted, market-selling bitcoin now is the most counterintuitive thing imaginable. The issuers of national currencies are likely to continue their unsustainable monetary policies and bitcoin acts as the de facto hedge to counter these macro-level risks.