


The technical analysis of week 51 explores recent spot market bounce together with different indicators: NVTS, RSI, and MVRV. Additionally we analyse Bitcoin’s UTXO Age Distribution, more commonly known as HODL Waves.
The Market Bounces, NVTS Indicating Oversold Bitcoin
The price action of Christmas week has been bullish so far, propelling Bitcoin upwards almost seven percent within past 7 days. Ethereum climbed more modestly, rising only 2,2%. Some native DeFi tokens like AAVE showcased exceptional performance this week, rising close to 40%. The market sentiment seems to be recovering after early December’s correction.
7 Day Cryptocurrency Performance:
BTC: +6,5%
ETH: +2,2%
AAVE: +38,8%
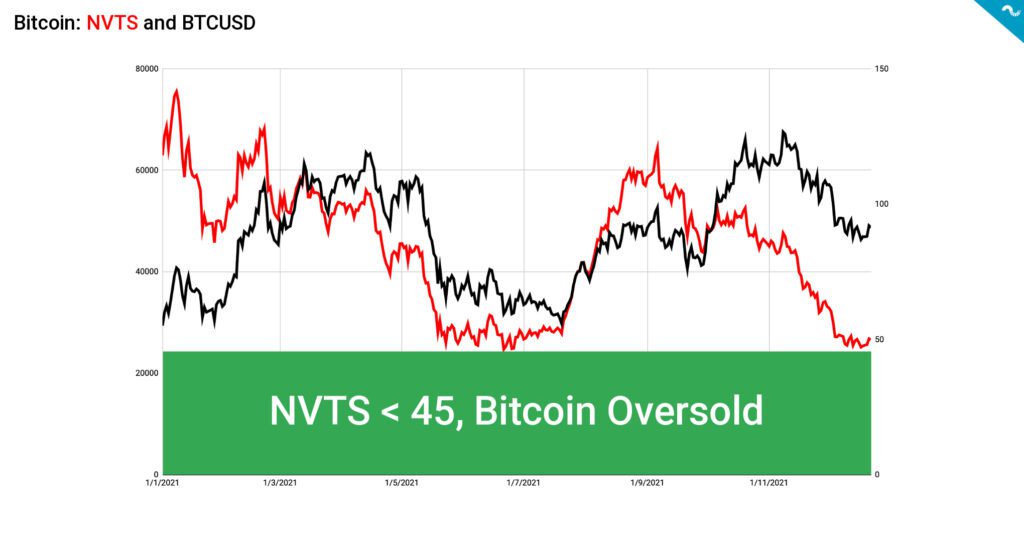
The recovering spot price is supported by weakening selling pressure. Bitcoin’s NVTS, or NVT Signal, indicates bitcoin being in close proximity to oversold sector, currently bouncing on NVTS 45 level. Bitcoin is generally considered to be oversold when NVTS is below 45 and overbought above NVTS of 150.
The NVT, or Network Value to Transactions Ratio, can be defined as Bitcoin’s P/E ratio. NVT was first introduced by Willy Woo in February 2017, Woo is specialized in Bitcoin’s fundamental and quantitative analysis. Bitcoin NVT is calculated by dividing the Network Value (MCAP) by the the daily USD volume transmitted through the blockchain, and NVT indicates whether bitcoin’s price is overvalued or undervalued. Bitcoin saw particularly high NVT values during the early years and NVT is a sound indicator for revealing high speculative value.
RSI Showing Huge Growth Potential for BTCUSD
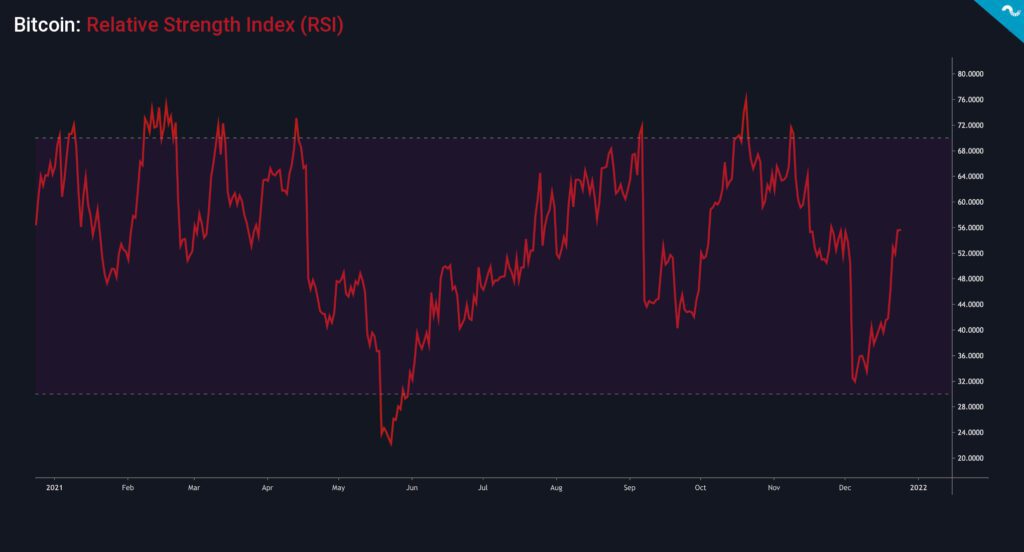
Bitcoin’s Relative Strength Indicator (or RSI) is currently at 55,39, implying good upward momentum for bitcoin. The RSI bottomed at a value of 22 during May’s heavy price correction, and crashed again in early December. However RSI stayed above 30 early this month, not falling into oversold territory of < 30. RSI is considered to show oversold market below 30, and overbought market above 70. Relative Strength Index crossed 70 on multiple occasions during 2021: In January, February, March, April, September, October, and November. These over 70 RSI anomalies represented good selling spots. RSI can be interpreted by following logic:
↑ High RSI: Bitcoin’s Price Performance Positive Compared to Past 12 Months
↓ Low RSI: Bitcoin’s Price Performance Negative Compared to Past 12 Months
RSI > 70: Overbought
RSI < 30: Oversold
MVRV Indicator Still Low
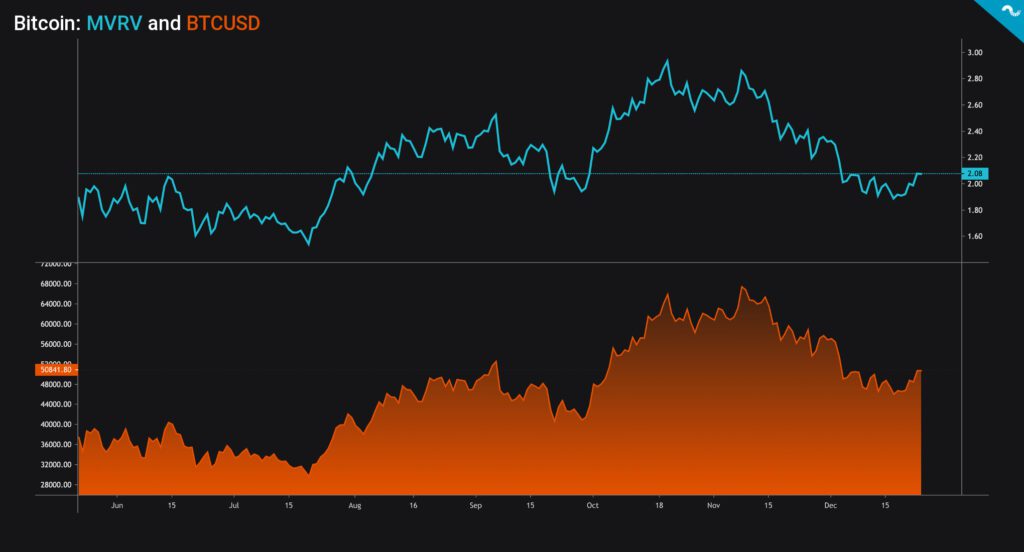
MVRV (or Market Value to Realized Value) is currently at 2,08, showing “fair price” for bitcoin. The MVRV previously indicated bitcoin overvaluation through first quarter of 2021 as it mirrored overvaluation in January, February, and March. The last time MVRV showed clear undervaluation was in 2020 March’s Covid-induces crash. The current MVRV level shows significant room for bitcoin’s spot price to grow before it’d be anywhere near overvaluation.
MVRV, or Market Value to Realized Value, was firstly developed by David Puell and Murad Mahmudov in early October 2018. The Puell Multiple indicator used in technical analyses is also named after David Puell. MVRV is calculated by dividing the market cap by realized cap and it’s a good instrument for estimating if market participants are in profit or not. Bitcoin is generally considered as overvalued when MVRV exceeds 3,7 and undervalued when it’s below 1.
HODL Waves Mirror Long-Term Accumulation
Satoshi Nakamoto originally designed Bitcoin as a transparent network. The transparency allows researchers to deeply explore the network and its UTXO structure. UTXO Age Distribution, or more commonly known as HODL Waves, presents a macro view of Bitcoin investor behaviour. The UTXO data can be analyzed by dividing the HODL Waves into six segments. Here’s a rough estimate on each HODL Wave’s trend:
7Y-10Y: Long-Term Holding
3Y-5Y: Accumulation
2Y-3Y: Selling Pressure
6M-12M: Accumulation
3M-6M: Selling Pressure
1M-3M: Selling Pressure
As we can see the UTXO data supports the current paradigm of long-term holder accumulation and growing weakness in shorter term cohorts. The 7Y-10Y wave (violet) has been going sideways for years, presenting no significant change in ultra long-term investor behaviour. These bitcoin investors are “holders of last resort” and they likely just hold regardless of the spot price. The 3Y-5Y wave (ocean blue) is showing clear accumulation, this wave represents long-term holders and also institutional investors. Resonating with Michael Saylor’s investment philosophy, they are are in for the long-term game. There’s some weakness to be seen in the 2Y-3Y (cyan) wave, however these investors are likely moving to longer cohorts.
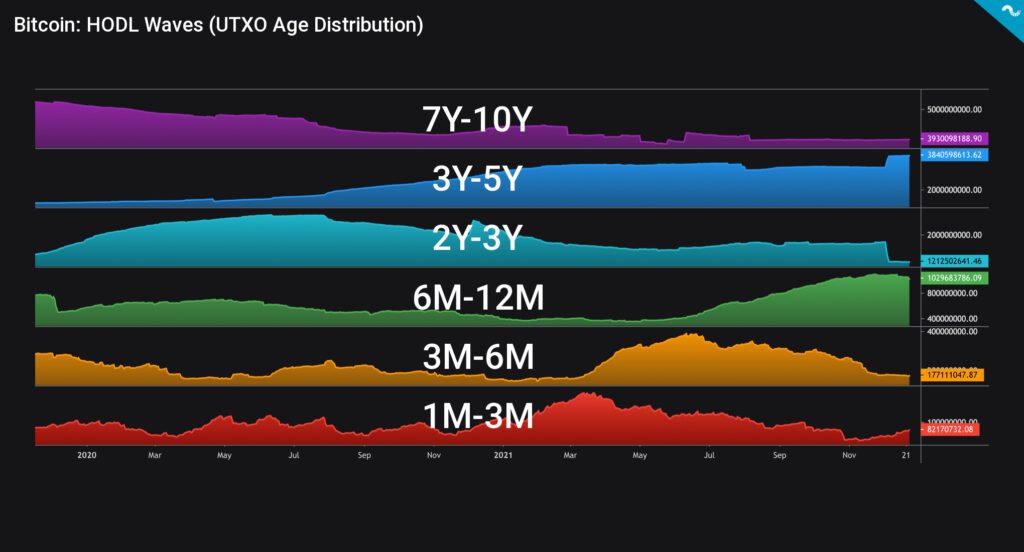
The 6M-12M wave (green) shows heavy accumulation, this wave clearly attracts investors from shorter timeframes. Consequently the shorter range 3M-6M (yellow) and 1M-3M (red) waves show selling pressure after spring 2021 bull market. As we stated in recent technical analyses, SOPR metric shows that short term investors are increasingly underwater. Bitcoin market tends to be volatile and it rewards long-term thinking. As Michael Saylor famously said: “Like Bitcoin, living things are volatile. Dead things, not so much”.