
The technical analysis of week 52 tracks the quickly approaching Death Cross pattern. Additionally we explore Saylor’s DCA strategies, exchange inflows, and David Puell’s recent analysis.
Incoming Death Cross?
Looking back at the last week of 2021, bitcoin had an intriguing year full of volatility. Bitcoin’s spot price ascended from early January’s $29 022 to its eventual peak of $69 045 in November, offering a wide range of entry and exit points for investors. Obviously the most profitable strategy has been buy & hold over long time horizons.
Death Cross and its inverse variant Golden Cross were the two most relevant indicators for 2021’s price action. Death Cross and Golden Cross are pretty simple indicators, but let’s have a short recap. As the name suggests Golden Cross indicates bullish market sentiment and Death Cross bearish sentiment, vice versa. The both indicators use 50 day moving average (50DMA) and 200 day moving average (200DMA). Death Cross occurs when 50DMA crosses 200DMA to the downside = bearish. Golden Cross occurs when 50DMA crosses 200DMA to the upside = bullish.
↑ Golden Cross: 50DMA Crosses 200DMA to The Upside
↓ Death Cross: 50DMA Crossed 200DMA to The Downside
The recent Death Cross situation took place in early June of 2021 and we covered the situation back then in TA of week 23. The June’s Death Cross did generate some selling pressure indeed, although market had already corrected during May. The descending curvature of 50DMA can already be seen in April, marking an exit point for traders.
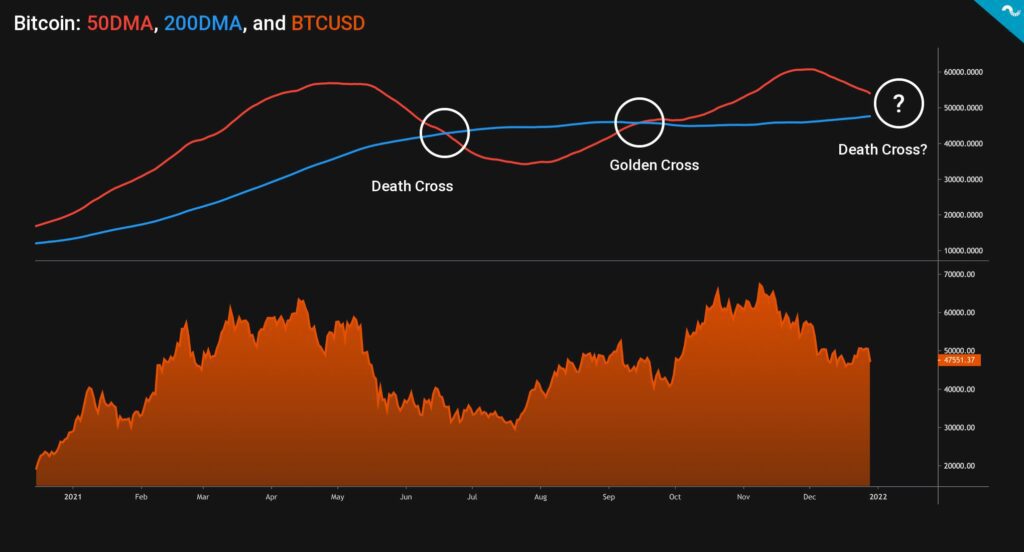
Death Cross’ inverse pattern Golden Cross occurred in September, setting the scene for an ascending cycle into the eventual spot peak of $69K in November. Since then market has been showing some signs of weakness, yet we still haven’t seen a true correction. 50DMA is again approaching 200DMA from above and first weeks of 2022 will show if the Death Cross will be generated or not. We’ll be following it closely.
Saylor in Full Accumulation Mode, Again
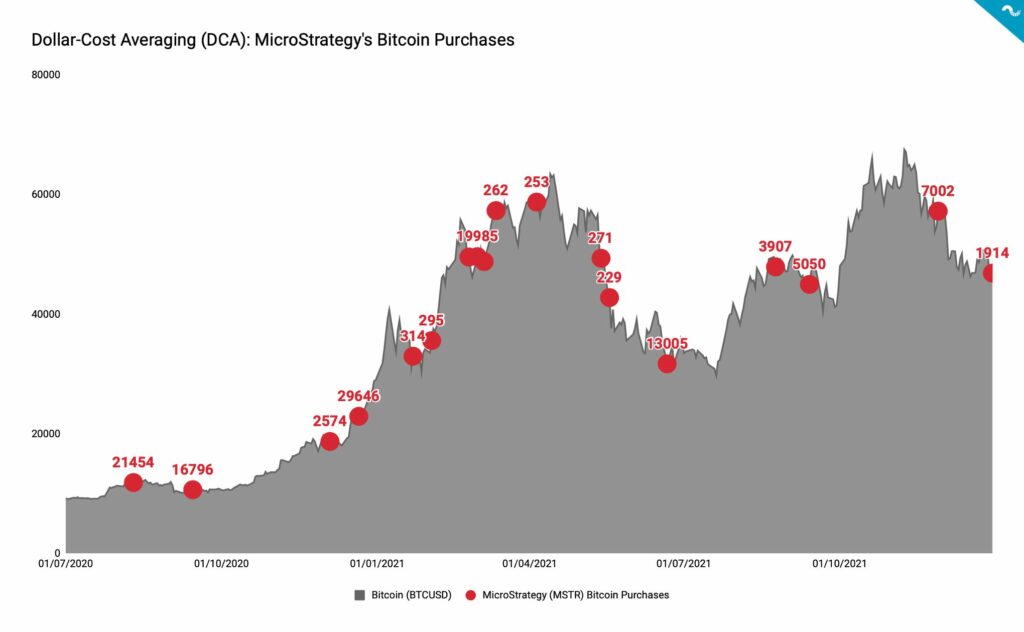
MicroStrategy (ticker: MSTR) continued its buying streak this week by announcing a new purchase of 1914 native bitcoin units. Michael Saylor is known for his relentless Dollar-Cost Averaging (DCA) strategy and the company currently holds a total of 124 391 BTC. MicroStrategy has developed itself into de facto bitcoin tech company, acting as a benchmark for other potential institutions. MicroStrategy’s path with bitcoin began in summer 2020 when Saylor announced the use of bitcoin as cash alternative in MSTR’s balance sheet. While the company also builds software products, it’s considered to be an unofficial Bitcoin ETF.
Exchange Mean Inflow Rising
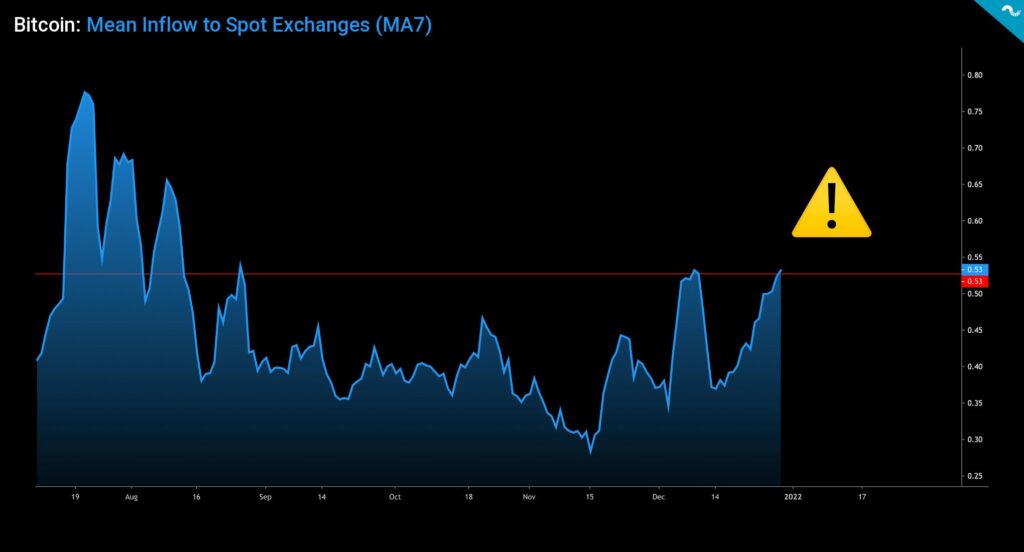
While Bitcoin’s Exchange Reserve Ratio still stays low, as scanned in the TA of week 50, other exchange inflow metrics are revealing escalating upward momentum. The Mean Inflow to Spot Exchanges indicator (excluding derivative exchanges) is rising towards mid-August numbers after shortly bottoming in mid-November. Increasing inflow to spot exchanges will likely generate selling pressure as the transferred coins usually get converted into FIAT or other digital assets. Growing spot exchange inflow is clearly a red flag, however we’ll see if the trend continues in Q1 2022.
Analyst David Puell Bullish on Bitcoin
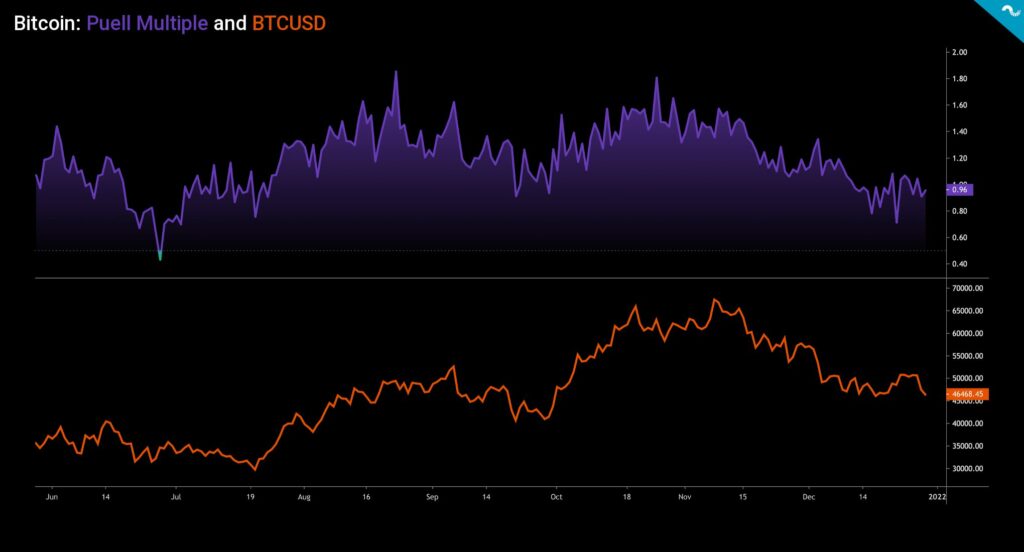
David Puell recently commented the cryptocurrency market: He sees that the current market is mainly driven by institutional demand and whales, while the proper retail boom mainly occurred in early 2021. Bitcoin’s volatility was low throughout 2021, with 30 day volatility staying in 0,03 – 0,06 range. In 2020 the 30 day volatility peaked at 0,11, almost double the 2021 peak volatility. Puell also notes that Bitcoin is not in a bubble state, although we’re close to end of the cycle.

The Puell Multiple indicator, developed by David Puell himself, is currently consolidating at 0,9 level. Puell Multiple explores Bitcoin’s supply side and the profitability of miners. High Puell Multiple levels have by default indicated incoming selling pressure from miners, consequently the lowish below 1 PM shows no miner-related risk. The last time Puell Multiple crossed value of 4 and gave a short signal was in late November of 2017, mirroring the end of ICO-induced bull cycle. The Puell Multiple ultimately climbed to 6,59 on 18.12.2017, giving a heavy short signal. The 2021 Puell Multiple peak was in mid-March, rising to 3,48.
Puell Multiple > 4 : Short Signal
Puell Multiple < 0,5: Long signal