

The technical analysis of week 43 presents a new bitcoin $100 000 target price. Additionally, we will review thoughts from David Duong and models by Raoul Pal. We will also explore why the $35 000 level is critical for bitcoin and examine inter-asset class correlations.
The crypto market’s upward momentum has continued this week, complementing the previous week’s parabolic price movement. Bitcoin has strengthened nearly 27% in the past 30 days and 108% year-to-date. One trigger for the October rally was the appearance of the iShares Bitcoin Trust ETF’s ticker symbol (IBTC) on the DTCC website.
David Duong of Coinbase Research sees bitcoin’s price performance diverging from other cryptocurrencies, especially due to the sharp -28% decline of the ETHBTC pair. Ethereum has now weakened significantly against bitcoin, with Duong criticizing ETH for its “lack of a fundamental investment narrative.” The expert also points out that the trading volume has increased from $31 billion in September to $47 billion in October.
“That said, bitcoin has been outperforming the rest of the digital asset class, reflected in the ETH/BTC cross, which is down for its fourth consecutive week to new yearly lows. Part of the reason why is that ETH market makers have been long gamma while the market has been focused on spot bitcoin ETFs. Although technicals suggest this could be the precursor to some mean reversion, the lack of a strong fundamental narrative for Ethereum puts constraints on our conviction.” – David Duong, Coinbase Research
Raoul Pal, known as a dedicated crypto bull, published an extensive set of charts this week that reflect the relationship between the M2 money supply and bitcoin price development. From a technical standpoint, the inflection point of the money supply and bitcoin at the turn of the year and nearly a 12-month upward trend clearly exhibit a correlation.
Pal has long been talking about the central bank policy inflection point, where quantitative tightening (QT) would shift to quantitative easing (QE). As a high-beta risk asset, bitcoin has clearly benefited from the effects of the “cheap dollar” and zero interest rate cycle. In previous years, cheap credit flowed abundantly into assets like the NFT market.
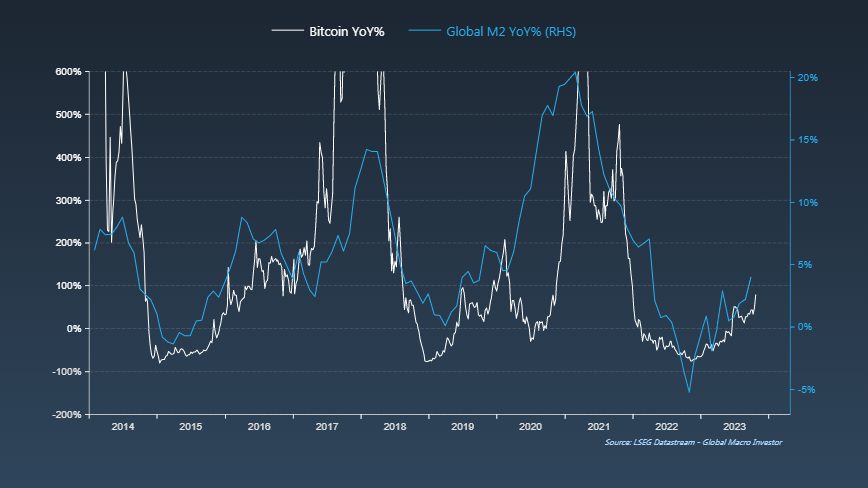
Sources: Raoul Pal, GMI
From a purely technical perspective, bitcoin entered a new price discovery cycle in October (white), aiming towards the $40 000 to $50 000 valuation levels. At the same time, two significant macro events are supporting bitcoin’s price aspirations: the anticipated launch of a spot ETF and the spring 2024 halving event.
Following the distribution cycle from 2020 to 2022 (purple), bitcoin reached its price bottom and capitulation phase at the turn of 2022 and 2023. The leading digital asset is now in a new pre-halving accumulation cycle (turquoise). Using the 2021 price peak as a reference point, the transition from $69 000 to $100 000 would represent a reasonable 45% increase percentage-wise. In a multi-year perspective, the $100 000 target is certainly achievable.
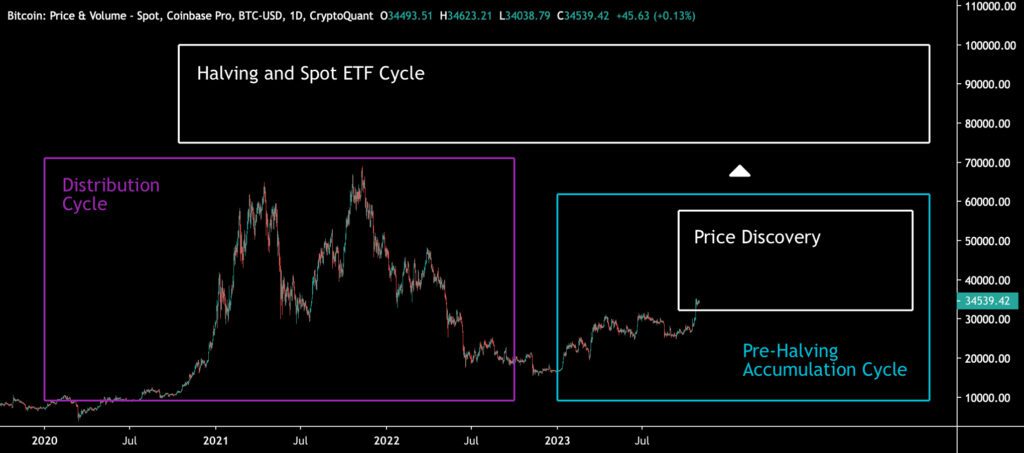
Sources: Timo Oinonen, CryptoQuant
The Material Indicators’ heat map illustrates bitcoin’s attempt to break through the $35 000 resistance level, which has thus far thwarted its upward momentum. The cumulative volume delta (CVD) indicates strong short-term demand from whales but a temporary decrease in other groups.
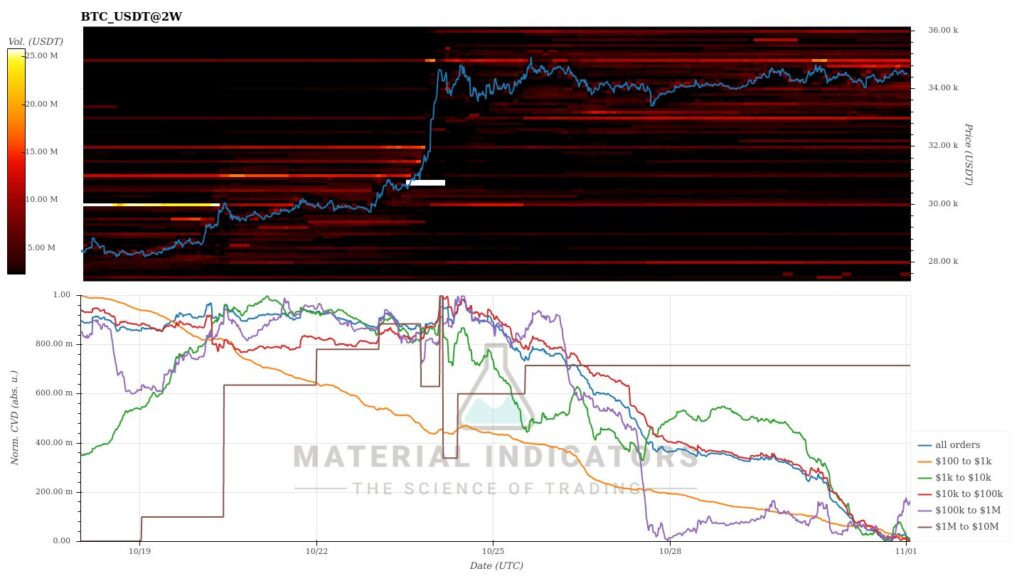
The crypto market, which has been climbing strongly for the past two weeks, is now taking a brief breather as bitcoin seeks to break through the $35 000 level. After a weak year for high-beta tokens, they are showing signs of awakening, with XRP (7,7%), Aave (6,3%), and Stellar (5,7%) notably strengthening on a weekly basis. Following David Duong’s theses, the growing divergence between the crypto market and the largely sideways-moving stock market is a fact.
7-Day Price Performance
Cardano (ADA): 3%
Polygon (MATIC): -0,3%
Chainlink Takes The Second Place in YTD Performance
From a broader perspective, bitcoin maintains its leading position among Coinmotion’s listings, reaching a 108 percent year-to-date (YTD) figure. Chainlink has also entered a parabolic price trend, rising 99 percent since the beginning of the year. This recent price movement for Chainlink contrasts with its lackluster start of the year when LINK fell into negative YTD territory in June. Ethereum’s year-to-date performance is now clearly lagging behind bitcoin, with the ETHBTC pair declining by -28 percent this year.
The crypto market continues to follow the watershed created by the U.S. Securities and Exchange Commission (SEC) this summer, where bitcoin, Ethereum, and XRP received a so-called commodity classification. This classification has provided them with regulatory protection in a rapidly changing environment. The fear of security classification has pushed many altcoins deep into negative YTD territory.
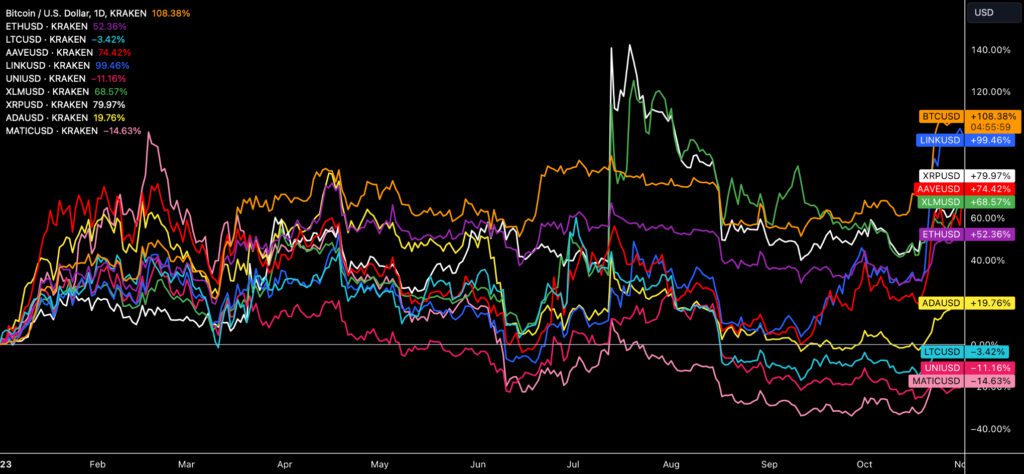
Source: TradingView
Three Coinmotion-listed cryptocurrencies, Litecoin (-3,42%), Uniswap (-11,16%), and Polygon (-14,63%), continue to have a negative year-to-date performance. In the overall picture, it’s important to note the 54% increase in bitcoin dominance this year, as the leading cryptocurrency captures more market share from others. At the same time, cryptocurrencies like Chainlink and Solana represent surprises in the scene, offering significant profit potential for risk-tolerant investors.
$35 000 as a Historical Inflection Point
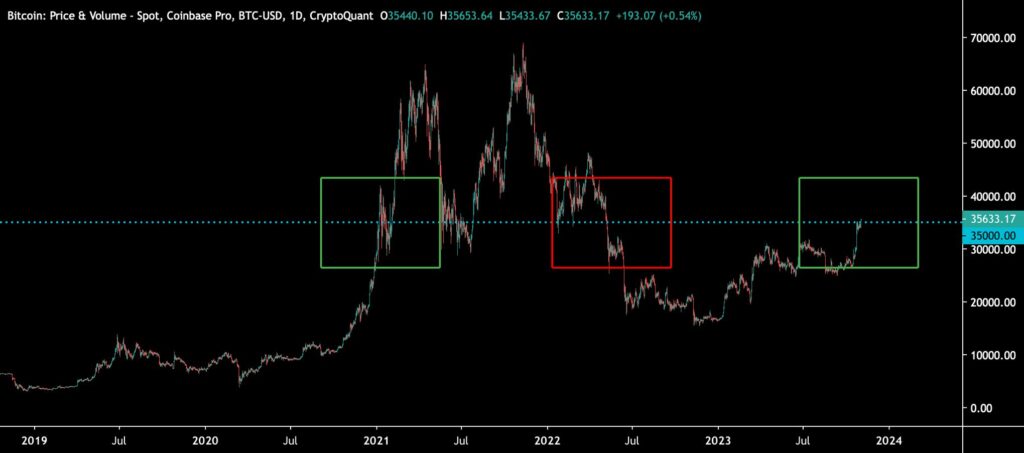
The market’s technical setup has once again brought bitcoin to the $35 000 range, which serves as a multi-year confluence level. The spot price is now attempting to breach this level for the third time, marking a significant technical turning point.
In previous years, bitcoin encountered the $35 000 level in early January 2021, with the upward trend leading bitcoin toward its double-top structure and a $69 000 valuation. Last spring, bitcoin dropped through the $35 000 mark as part of the market’s capitulation, leading to a price bottom and a technical turning point at the year’s end.
Breaking through $35 000 now brings the cryptocurrency closer to our $100 000 target, with $35 000 transforming into a support level. Returning to the previous cycle’s price peak for the cryptocurrency would require a 97% ascent, roughly doubling the current valuation.
Sources: Timo Oinonen, CryptoQuant
Bitcoin’s Correlation to Traditional Assets Close to Zero
Bitcoin was long known as an asset class with an extremely low correlation to stocks and gold. This held true from the early days of bitcoin until 2020, when Michael Saylor’s theses brought the asset into mainstream investor’s awareness. MicroStrategy’s bitcoin allocations served as a reference point for other companies while “TradFi’s” interest escalated. As bitcoin grew during the 2020-2021 bull cycle, it began to correlate more strongly with the stock market.
The correlation between bitcoin and the S&P 500 stock index peaked at 0,75 in May of last year, indicating a very strong dependency. During that time, bitcoin weakened alongside the stock market as the Federal Reserve implemented a more hawkish monetary policy with quantitative tightening (QT) rounds. Since the end of last year, bitcoin’s correlation with the stock market has been in a clear downward trend, reflecting the current divergence created by the cryptocurrency’s rise from the S&P 500.
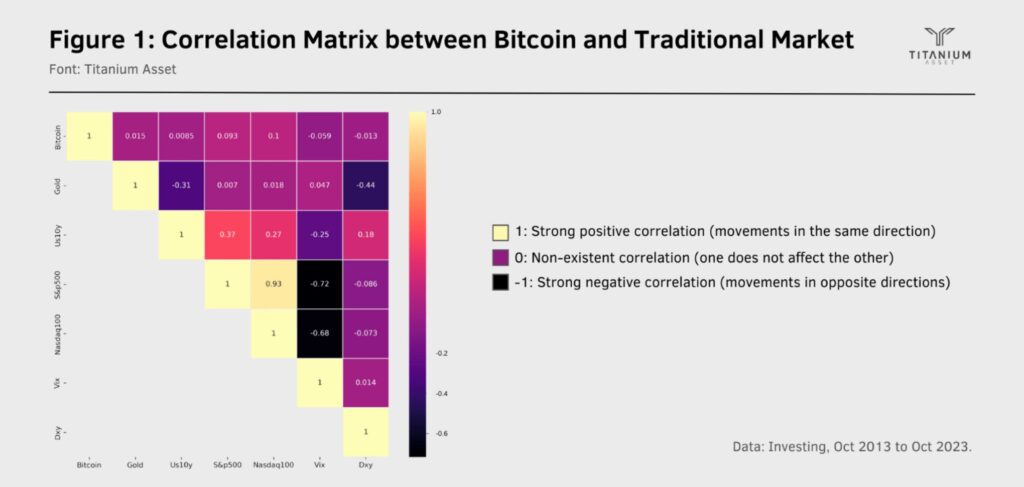
Source: Titanium Asset
A closer examination of the ten-year correlation matrix reveals bitcoin’s very weak relationship with mainstream indices. Logically, bitcoin’s historical correlation with the Nasdaq-100 technology index is the highest within the group (0,1). According to the matrix, the 10-year correlations with the S&P 500 index (0,093) and gold (0,015), which share some characteristics with bitcoin, are very weak.
UTXO Data Indicates Towards an Accumulation Phase
Bitcoin’s UTXO age distribution data, known as “HODL waves,” provides valuable blockchain data related to investor behavior. With the price showing a year-to-date (YTD) increase of over 100 percent, both short-term and long-term UTXO waves indicate accelerating accumulation.
The blue 2Y-3Y wave has been rising since the beginning of the year, with its turning point aligning with the spot price technical inflection point. The 2Y-3Y wave represents medium-term investors who are currently in accumulation mode. Simultaneously, the shorter-term yellow 6M-12M and light red 3M-6M waves are clearly on an upward trajectory, indicating an increase in traders’ appetite. Overall, the majority of UTXO waves are currently pointing up, supporting the upward trajectory of the spot price.
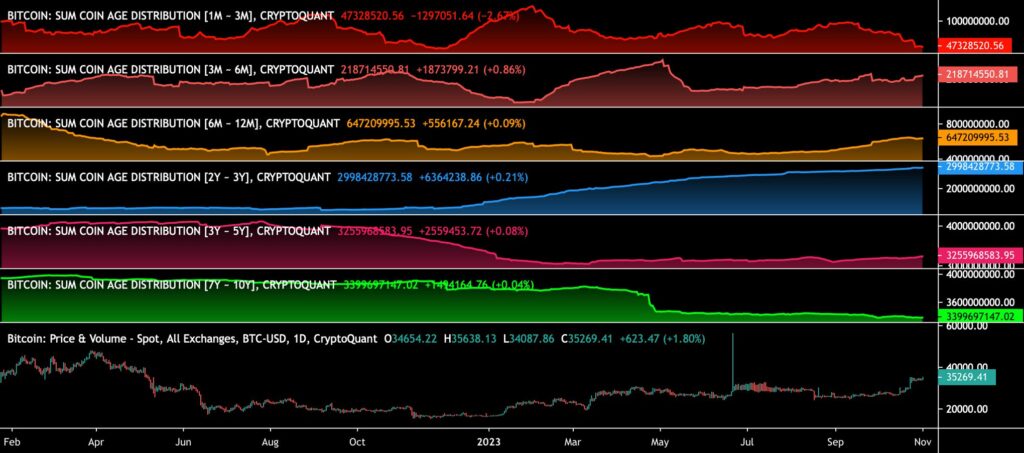
Sources: Timo Oinonen, CryptoQuant
What Are We Following Right Now?
Stephan Livera, who also attended the October Plan B Forum, predicts that bitcoin will skyrocket to $500 000 by the end of 2025. Livera bases his target price on the upcoming parity with gold and also highlights the significance of the spring 2024 halving event as a key background factor.

Analysis by the founder of the iconic BitMEX exchange, Arthur Hayes, on the bursting sovereign debt bubble, its causes, and consequences.

Iris Energy’s Daniel Roberts discusses his company’s journey in green Bitcoin mining. Additionally, Roberts comments on why the development of artificial intelligence correlates with the mining sector.

Stay in the loop of the latest crypto events
- Polygon (MATIC) – Infrastructure for billion users
- Bitcoin’s October Storm and the New Price Discovery Cycle
- Report your crypto investments to Verohallinto: Lesson #11
- A Prologue to the Upcoming ETF Market Reaction
- Dive into Cardano (ADA): A newcomer’s comprehensive guide
- Security measures to safeguard your cryptocurrencies: Lesson #10
- 200 Days Until the Halving: Bitcoin’s Next Chapter

The views, thoughts, and opinions expressed in the text belong to the author and not necessarily to the author’s employer, organization, committee, or other group or individual.